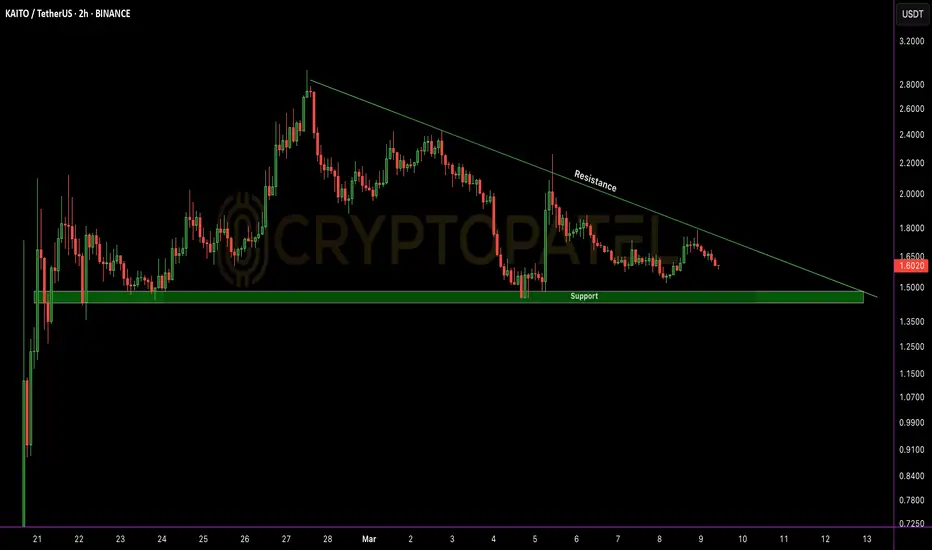
Will $KAITO go down -50% downside move?$KAITO Price Action Update
$KAITO is currently trading at $1.58, holding strong above the key $1.45 support level.
🔹 Key Levels to Watch:
✅ Support: $1.45 – Holding above this level could trigger a strong upside rally, targeting the $1.75 resistance and beyond.
❌ Break Below Support: If $1.45 fails, a 30-50% downside move is possible.
🚀 A decisive move above $1.75 could open doors for further gains. Keep a close watch on these levels for potential opportunities.
🔍 Stay informed, manage risk, and trade wisely.
📢 DYOR – This is not financial advice!
#KAITO #CryptoTrading #MarketUpdate #TechnicalAnalysis
Xrp
Ethereum: The Sleeping Giant!It is pretty evident that Ethereum is forming a falling wedge pattern, which mostly breaks to the upside. We are in for a treat!
The breakout could be anytime soon, with TRUMP already taking office and signing crypto orders from DAY 1 !
The Time Is Now. if you are not holding ETH. it's about time!

Ripple hit 7 Years High: 500% up from Our EntryRipple hit 7 Years High:
🔹 XRP/USDT 500% up from our Initial Entry.
🔹 I am booking 80% Profit here for safe Zone.
🔹 500% Profit not bad guys.
I told you to buy at $0.40-$0.50 and ignore the negative news and drama (thanks, Gary Gensler). Hope you held strong because now you're in huge profits. 🎉
❤️ $3 is just around the corner.
What’s Next?
▪️ I’m expecting $3-$5 in this bull run for XRP.
▪️ Don’t repeat last bull run’s mistake: Holding blindly and not selling when it’s time.
My Suggestion:
▪️ Take out your initial investment and 70% Profit and hold the rest as profit.
▪️ While $10 is possible, it’s unlikely this bull market.
Smart moves can turn this into a big win.
Of corse NFA & DYOR

#AETHIR Price Prediction & 1300% Potential In Bull MArket #AETHIR Price Prediction & 1300% Potential In Bull MArket 🚀
TSX:ATH is showing strong bullish momentum with a breakout on the daily chart. Given the project's potential, especially as a competitor to , there's a clear path for significant upside.
With #RENDER market cap at $4.5 billion and AETHIR at just $380 million, a 13x increase to $1 seems achievable in the current bull market, placing #ATH in a $5 billion market cap range.
Key Levels:
▪️ Accumulating between $0.05-$0.073 is ideal for positioning.
▪️ Targets: $0.15, $0.30, $0.50, $0.70, $1, $2.
▪️ Stop-loss: Below $0.04 (high risk, high reward).
This dip presents a solid buying opportunity for those looking to ride the upcoming bullish trend.

XRP/USDT $10 Potential In bull market🔥 CRYPTOCAP:XRP Monthly Chart Analysis 🔥
Looking at the #XRP monthly chart reminds me of the legendary 2017 Ripple bull run 🚀
🔰 Back then:
🔹 3 massive monthly candles with high volume printed a staggering 7400% gain in just 3 months.
🔰 Now:
🔹 We’ve already seen the 1st big monthly candle with high volume.
🔹 If history repeats, we could see 2 more massive monthly candles soon.
🔰 Potential Targets:
🔹 By the end of January or early December, XRP could hit $5+!
🔹 $10 is a riskier target, but if we get 3 big monthly candles, who knows? 😄
Are you also waiting for the next big monthly candle? Let’s see if #Ripple can make history again
(This is just my opinion, not financial advice. DYOR.)

XRP/USDT 366% up from our Entry so Book profit ?XRP Up 366% 🚀
I told you to buy at $0.40-$0.50 and ignore the negative news and drama (thanks, Gary Gensler). Hope you held strong because now you're in huge profits.
❤️ $2 is just around the corner.
What’s Next?
▪️ I’m expecting $3-$5 in this bull run for XRP.
▪️ Don’t repeat last bull run’s mistake: Holding blindly and not selling when it’s time.
My Suggestion:
▪️ Take out your initial investment and hold the rest as profit.
▪️ While $10 is possible, it’s unlikely this bull market.
Smart moves can turn this into a big win.
Of corse NFA & DYOR

XYO/USDT Bullish Chart AnalysisXYO/USDT Bullish Chart Analysis
$XYO is looking strong, with a 108% gain last week, supported by good volume.
Reminder: Don’t buy in FOMO! Always wait for a better entry.
▪️ Suggested Entry Zone: Between $0.0075 and $0.006
▪️ Target Levels: $0.022/$0.039/$0.063/ATH
▪️ Stop Loss: $0.005 (This setup comes with high risk and high reward.)
What to Watch:
A triangle breakout on the higher timeframes could lead to a big move upward. 🚀
Be patient and trade smart.

Bitcoin Big Decision: $100k Breakout or $75K Drop?#Bitcoin Big Decision: $100k Breakout or $75K Drop?
🔰 Key Levels:
▪️ $100k Resistance: CRYPTOCAP:BTC is showing weakness around this psychological level due to low trading volume.
▪️ Swing Low Support: $95,650 – A breakdown here could signal bearish momentum.
▪️ Trendline Resistance: $94,100 – Breaking below this level may lead to a 10%-20% correction.
🔰 Bearish Outlook:
If #BTC breaks both $95,650 and $94,100, downside targets are $85,000 and $75,000.
🔰 Bullish Case:
If BTC holds above $94,100, a continuation toward $120K is possible, supported by volume.
⚠️ Risk Management: Current volatility is high. Traders should monitor these key levels closely and use stop-loss orders to mitigate risks.

XRP/USDT 115% up and Still Target is $2 & $5CRYPTOCAP:XRP Breaks $1 After 3 Years: Is $5 Next? 🚀
#XRP Bullish Run in Full Swing
🔹 Ripple hits $1 – a massive achievement, especially after being delisted from the stablecoin list.
🔹 It’s been 1057 days (nearly 3 years) since XRP last touched $1
What's Next? #Ripple shows $5 potential in the current bull market, but consider booking profits above $2 for safety.
🔹 XRP is pumping hard after news of Gary Gensler's possible resignation following a Trump victory.
Performance Update:
🔹 XRP/USDT is up 66% since my breakout post.
🔹 Up 115% from our initial post.
Hope you’re riding the wave and enjoying the gains.

Ripple Bull Market Chart Analysis#XRP High Timeframe Analysis
🔹 Current Setup: CRYPTOCAP:XRP
is consolidating within a symmetrical triangle formation on the higher timeframe, with the 200 EMA slope remaining neutral, signaling potential continued range-bound movement.
🔹 Key Observations:
- Price has tested the support level multiple times without a definitive breakdown, hinting at a possible bullish breakout.
- A strong breakout above the pattern resistance, with a confirmed candle close above $0.6639, would signal bullish momentum, opening a pathway toward $1.4065 as the primary resistance/target level.
🔹 Trade Setup:
- Long Position: Await a candle close above $0.6639 to confirm bullish continuation.
- Invalidation: If the price breaches the support and closes below $0.4302, this setup will be invalidated.

Bitcoin Breakout confirmed so what Next?#Bitcoin Chart Analysis
CRYPTOCAP:BTC has broken TL resistance and is heading towards $66,000. The key resistance level is at $66K—if broken, we could see a new ATH toward $80K!
However, if $66K is rejected, a retracement to $62K is possible.
Resistance: $64K/ $66.3K
Support: $62.5K / $60K
Watch for a 3H/4H close above $66.4K to confirm ATH potential!

XRPUSDT Wave CountsI have posted a chart of XRP and VIX same like xrp is working, i have mention wave counts of this wave as per my analysis, It can go up to or beyond 1.45 as per my analysis.
You can post your questions or share your view in comments
Thanks


RUNE/USDT 764% Up from Our Entry zoneRUNE/USDT Profit Analysis
1⃣ CRYPTOCAP:RUNE Currently 764% up from our Entry Setup
2⃣ Entry Zone: $1-$0.8 ✅
3⃣ I am Expecting $20-$30 in this bull Run
4⃣ If your Entry is Around $1 then don't forget to secure some Profit
5⃣ Strong Support = $4.10
6⃣ #THORChain is a decentralized liquidity protocol that enables cross-chain asset exchange.

Altcoin Ready to fly soon ? Bitcoin Dominance Chart AnalysisAltcoins preparing for liftoff!
#BTC dominance facing triple resistance:
1⃣ Long-term trendline at 56%
2⃣ 2W cloud
3⃣ Kijin projection
Dominance likely to top soon = #altseason incoming!
Alts about to SURGE. The time is now!

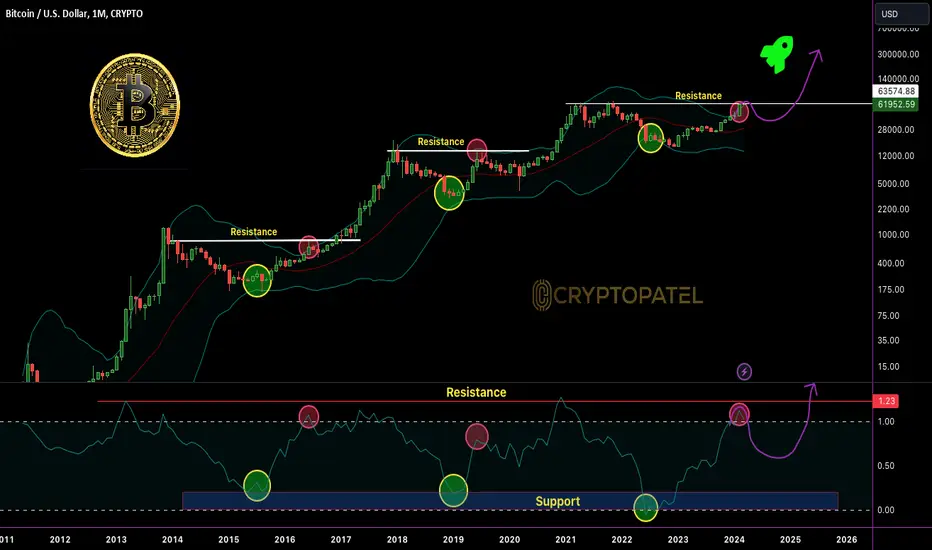
BITCOIN READY TO FLY ?The #BITCOIN party is just getting started
Bollinger bands are still tight - massive expansion ahead.
This bull run is in the early innings.
HODL on, the best is yet to come!
NFA
$XRP is showing signs of preparing for a breakout.Ripple isn't just targeting $2.0; it's also setting its sights on a new all-time high in this bullish market.
• 2 years of accumulation
• Utilized by major financial institutions
• Rapid & cost-effective
It's high time for CRYPTOCAP:XRP to awaken and ascend to new heights!

XRP : Potential Bullish Reversal at Key Support Levels 💎 XRP is currently approaching the supportive trendline of an ascending channel, which also aligns with a key support level and a bullish Order Block (OB) zone, enhancing the likelihood of a bullish reversal from this area.
💎In the event that XRPUSDT breaks below this support level, it would be prudent to wait for the price to reach the next support zone, which was previously a resistance area and is now expected to act as support.
💎However, if XRPUSDT demonstrates panic selling and breaks down below all support levels, it would be wise to refrain from entering trades. Such price behavior often accompanies significant news events or market shifts, suggesting a high level of uncertainty that may not be conducive to profitable trading. Therefore, it is advisable to exercise caution and wait for clearer market conditions before considering any entries.

XRP Analysis: Potential Bullish Breakout from Descending Channel💎 XRP has rebounded from the demand area and is currently attempting to break out of the descending channel, which suggests a potential bullish scenario. To increase confidence in this upward movement, we need to see significant bullish candles.
💎For confirmation, we're looking for a candle closing above the small resistance level of 0.5411. A breach of this level could indicate further upside potential, with targets near the next resistance levels of 0.6237 and 0.6596.
💎However, if XRP retraces back to the demand area, we may see another bounce. Trading near the demand area carries risk, so caution is advised. A breakdown below this area would signal continued bearish control over XRP.

XRP/USDT RIPPLE Ready for $10 in bull market ?#XRP/USDT Bull Market Technical Analysis:
➡️ Last bull #XRP seriously underperformed while stuck fighting the #SEC
➡️ BTC hit new highs while XRP failed to pass 2017's $3.30 ATH
But with the SEC case now won - the floodgates may finally BE OPEN!
➡️ Similar triangle breakdown to 2017 is FORMING!
➡️ If 2017's 40,000% pump repeats - we could see mind-blowing $10+ XRP!
➡️ Survived 2,291 (6+ Years) brutal bear days - this coiling pattern signals Ripple's ready to ERUPT!
My Accumulation Zone: $0.40 - $0.50
Targets: $0.90/$1.95/$4/$7/$10+( bonus )
If you believe in parabolas, triangles, and cycles - CRYPTOCAP:XRP may be on the launching pad again here!!

Bitcoin Ready for $51000 or $31000 ?CRYPTOCAP:BTC Chart Analysis:
Bitcoin Bull Flag:
Chart pattern suggests bullish trend with targets of $48000-$52000.
However, #Bitcoin is heavily influenced by #BitcoinETF news, so caution is advised.
What to do?
If BTC/USDT holds above $41000, a bullish run to $48000-$51000 is possible.
But, a breakdown below $41000 could quickly lead to $31000.
Remember: Always trade with the trend and confirmations, never gamble.
#BULLRUN2024

ASTRADAO/USDT 10x-50x Potential As per Chart and Project#ASTRADAO 10x-50x Potential Project
I am Expecting ASTRA DAO will be next Gem in Bull Market.
Trying to add very Small Quantity.
Accumulation zone: $0.000000070-$0.000000095
Try to Add in Dip when Market Dump.
ASTRA DAO:
Astra DAO is a decentralized crypto asset allocator on Ethereum, offering convenient investment strategies and products/indices.
The native MYX:ASTRA token provides access to utilities, rewards, development funding, treasury reserve, voting, and staking benefits.
Note: DYOR Before Investing.
Do you Own Research before investing in any Coins or Tokens.
