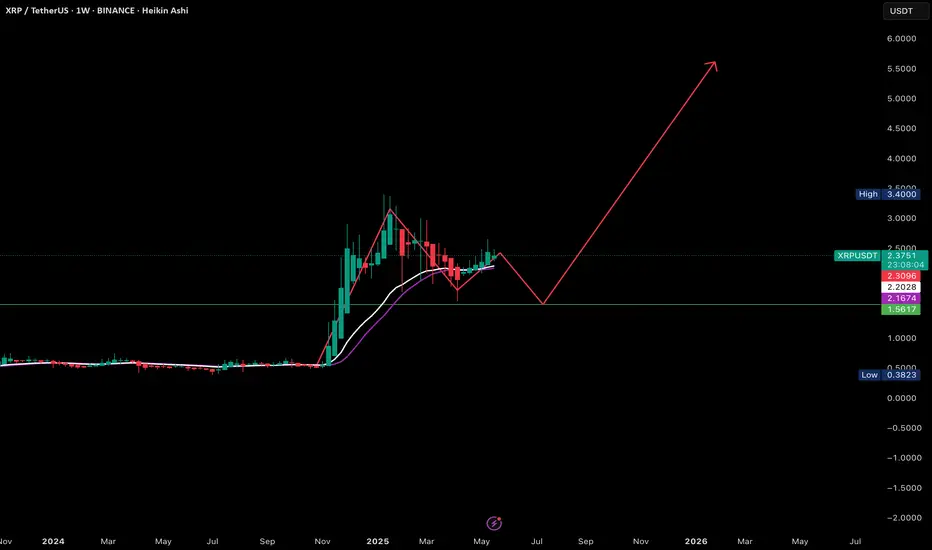
$XRP /USDT – Weekly Technical View (Short Analysis)#XRP has completed a strong impulsive move from long-term lows, topping near the 3.5–3.6 USDT resistance zone, which aligns with a major historical supply area. The rejection from this zone suggests a corrective phase is underway, forming a descending structure.
Price is currently hovering around 1.9–2.0 USDT, testing a key Support-1 demand zone. As long as this support holds, a consolidation or corrective bounce is possible. However, a decisive breakdown below this range could open the door for a deeper correction toward the lower support box (~0.6–0.8 USDT), marked as wave (C).
Overall bias: Long-term bullish structure intact, but medium-term correction ongoing. Watch how price reacts at the current support for the next directional clue.
~Disclaimer~
High Risk Investment
Trading or investing in assets like crypto, equity, or commodities carries high risk and may not suit all investors.
Analysis on this channel uses recent technical data and market sentiment from web sources for informational and educational purposes only, not financial advice. Trading involves high risks, and past performance does not guarantee future results. Always conduct your own research or consult a SEBI-registered advisor before investing or trading.
This channel, Render With Me, is not responsible for any financial loss arising directly or indirectly from using or relying on this information.
Xrpusdanalysis

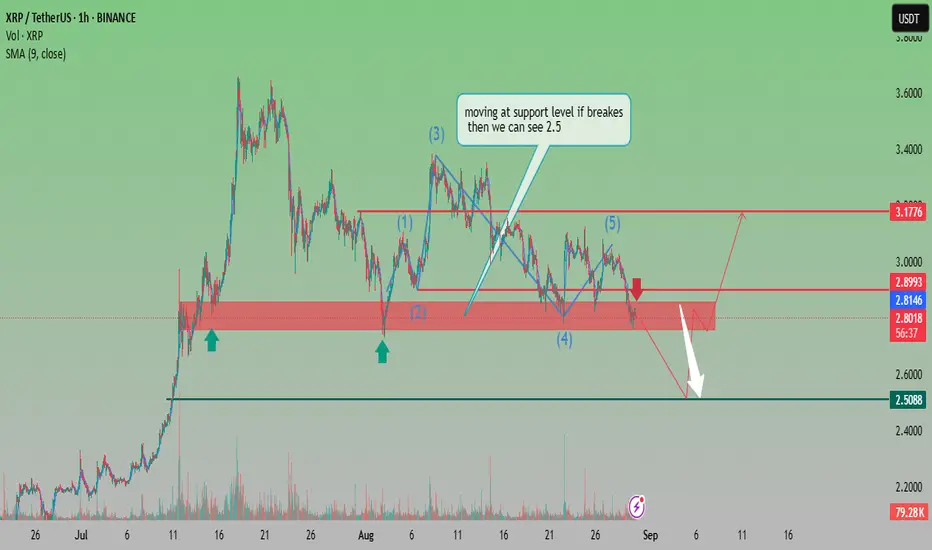
XRP Testing Key Support Zone – Potential Drop Toward $2.50 if ?Analysis:
XRP is currently trading around $2.80, right at a critical support level. The chart highlights a 5-wave Elliott structure, with the recent wave (5) completing near resistance. Price action is now consolidating in a key demand zone around $2.80 – $2.90.
If the support holds, we could see a bullish reversal with potential upside toward $3.18 resistance.
However, if the support breaks, a sharp decline toward $2.50 is likely, as indicated by the downside projection arrow.
The 9-period SMA ($2.81) is also being tested, which adds to the short-term pressure.
📌 Conclusion: XRP is at a decision point — holding above support could fuel a bounce, but a breakdown signals further bearish momentum toward $2.50.
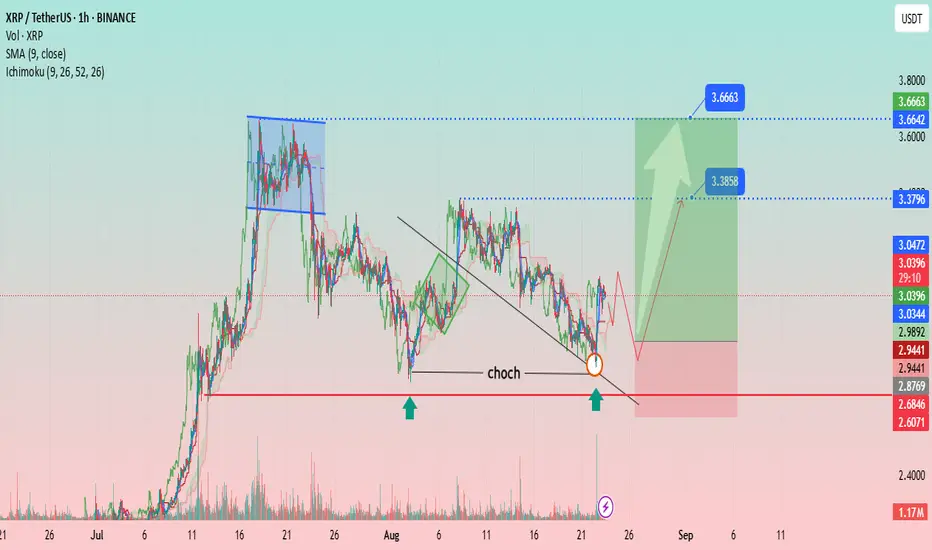
XRP/USDT – Bullish Reversal Setup After CHoCH BreakoutAnalysis:
The chart shows XRP/USDT (1H timeframe) developing a bullish structure after a Change of Character (CHoCH) confirmation near the $2.94 support zone. Price respected the key demand area (highlighted by green arrows) and broke above the descending trendline, signaling potential reversal momentum.
Support Zone: $2.94 – $2.87 (strong demand zone, price reacted twice).
Resistance Levels:
First target: $3.38
Second target: $3.66
Indicators:
SMA (9) at $3.04 – price hovering around it, suggesting early bullish strength.
Ichimoku showing potential cloud breakout aligning with bullish momentum.
Volume: Increasing at demand, indicating strong buyer interest.
Trade Plan:
Entry Zone: Around $3.00 – $3.05 (after retest confirmation).
Stop-Loss: Below $2.86 (invalidates setup if broken).
Targets:
TP1: $3.38
TP2: $3.66
Risk/Reward: Favorable, with potential 2:1 or higher depending on entry execution.
👉 This setup suggests that XRP may attempt a bullish continuation if support holds and volume sustains the breakout momentum.
XRPUSDT Consolidation Within Ascending Support – The chart shows higher lows forming along an ascending trendline, suggesting underlying bullish pressure despite previous lower highs.
Price is currently consolidating inside a rectangle pattern (green zone), sitting above the key support near $2.98.
The red resistance zone around $3.57 is a major breakout point — a successful breach could lead to a strong bullish move.
The PPO indicator is showing a slight recovery from negative territory, indicating momentum is attempting to shift upward.
If price fails to break out, a retest of the ascending trendline or the grey demand zone below $3.00 could occur before the next attempt upward.
Overall, XRP is coiling for a breakout, with $3.57 as the key resistance to watch and $2.98 as critical support.

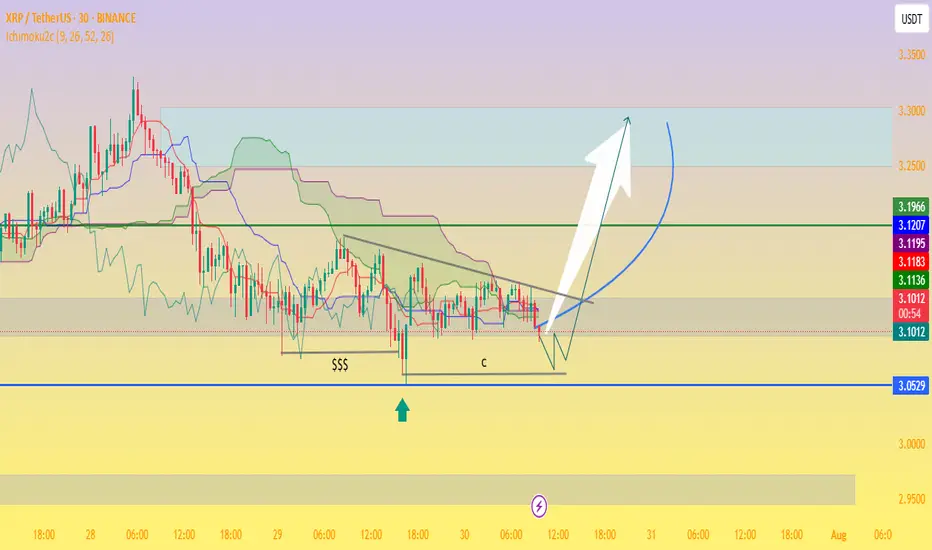
XRP/USDT Potential Reversal Zone — “Bottom Tested, Bullish!📉 Chart Analysis Summary
The divided chart indicates XRP trading between a critical support zone near $3.05–$3.09 and overhead resistance around $3.19–$3.23, forming what could be a bullish pennant or descending wedge setup on the 30-minute timeframe:
Support Zone (~$3.05–$3.09):
Price retested this level multiple times (labeled as “$$$” and “c”), clearly identifying a demand zone.
Ichimoku cloud support lies nearby, adding technical relevance to the floor.
Resistance Trendline & Green Line (~$3.19–$3.23):
A descending trendline is visible, showing lower highs and building compression.
A breakout above this resistance zone is necessary to signal bullish continuation.
Projected Path:
The schematic arrow suggests a bounce off support, followed by consolidation, and then a breakout above resistance, targeting the $3.25–$3.30+ zone and potentially higher.
🔍 Context from Recent Market Commentary
Support Holding Above $3.11–$3.15: Analysts highlight strong support around $3.11–$3.15, where institutional and retail interest appears concentrated
TradingView
+13
TradingView
+13
CoinCentral
+13
.
Resistance & Consolidation at $3.30: While XRP briefly surpassed $3.30, it encountered rejection and remains rangebound. A confirmed break beyond this level could validate the bullish carry-forward
CryptoPotato
CoinDesk
.
Wave-Elliott Bull Case: Various Elliott Wave scenarios forecast targets as high as $5.25, $6.85, or even $10–$15 should Wave 5 materialize, though this depends on market strength and momentum
CoinCentral
.
✅ Trading Outlook
Bullish Scenario:
Bounce off $3.05–$3.15 support.
Break above $3.23–$3.30 resistance.
Potential upside targets:
Near term: $3.30–$3.40.
Medium term: $4.64 or $5–$6, with strong case for $6.85 if momentum and on-chain demand strengthen
CryptoPotato
+15
TECHi
+15
CoinGape
+15
.
Bearish Scenario:
Failure to hold $3.05–$3.11 risk retest toward $2.95 or lower zones ($2.30–$2.70)
TECHi
.
🧭 What to Watch
Key Level Role
$3.05–$3.11 Critical support/demand zone
$3.19–$3.23 Short‑term resistance/framing compression
~$3.30+ Confirm bullish breakout — key trigger for Wave 5 and higher targets
🧠 Overall Take
This chart is painting a classic consolidation near strong support with a visible descending upper boundary. If XRP holds the ~$3.05 zone and breaks above $3.23–$3.30 with conviction, it could initiate a bull move toward $3.40–$4.00, and potentially even $5–$6+ depending on volume and momentum.
However, breaks below $3.11 may open deeper downside risk. For many traders, this is a simple risk-reward setup: entry near the lower channel with a stop under $3.05 and initial profit targets at $3.30–$3.40.
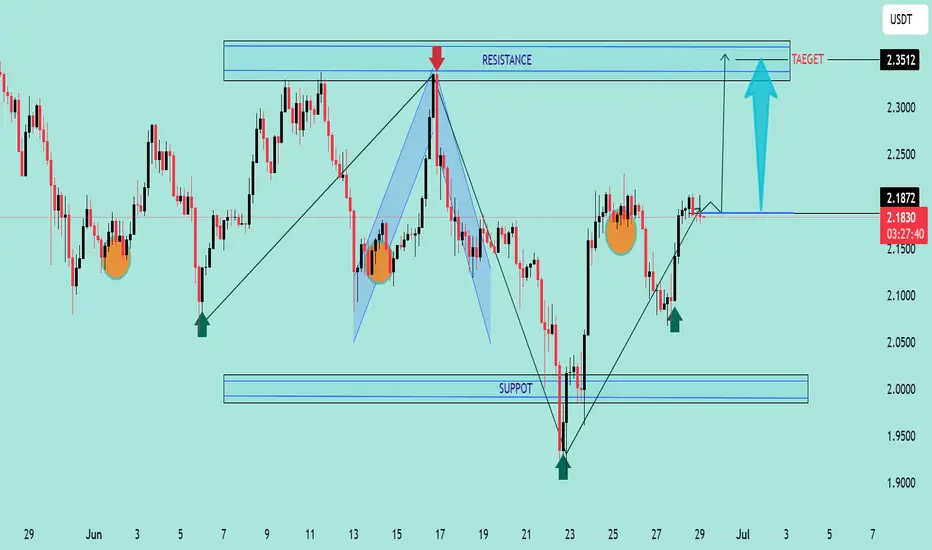
XRP/USDT Bullish Breakout Anticipatio XRP/USDT Bullish Breakout Anticipation 🚀
Technical Analysis:
The chart illustrates a potential bullish setup for XRP/USDT based on price structure, support/resistance levels, and harmonic movements.
🔍 Key Observations:
Rejection From Major Support Zone (1.95 - 2.00):
Price previously tested a strong demand zone (marked as “SUPPORT”) and showed significant rejection with bullish candlestick momentum.
Series of Higher Lows ✅:
The price structure shows consecutive higher lows (green arrows), indicating rising buying pressure and bullish intent.
Break of Intermediate Resistance (2.15 - 2.18):
A breakout from the neckline area confirms bullish continuation. Price is currently retesting this level, turning resistance into support.
Target Zone at 2.35 - 2.36 🟦:
A clean target area marked by historical resistance and previous high (red arrow).
Projection indicates a possible move toward 2.3512 USDT, aligning with the measured move from the breakout structure.
Bullish Harmonic Pattern Completion 🔼:
The chart also displays a harmonic pattern completion near the recent low, suggesting a reversal point aligning with market reaction.
🎯 Trading Plan:
Entry Zone: Current retest around 2.15 - 2.18 is favorable.
Target: 2.3512 (as per projection and prior resistance zone).
Invalidation: Break below 2.10 and especially under the key support (2.00) would invalidate the setup.
📌 XRP/USDT is showing bullish strength as long as it holds above the breakout level. A sustained move could trigger momentum towards the 2.35 target zone. 💪📊
XRP Still in Buy Zone – Eyes on $2.50+our chart clearly marks that XRP has bounced off a strong buy zone (around the $2.10–$2.15 range), aligning well with a classic setup: price hitting support, creating a small base, and starting an upward rotation. 👇
Support area respected – The highlighted circle shows XRP revisiting the demand zone and quickly rebounding, very bullish behavior.
Lower wicks & volume spike – Indicate absorption of selling pressure and possible institutional interest.
Green arrow projection – Suggests a break above the immediate resistance (~$2.17 EMA/Ichimoku levels) could trigger a rally toward the next resistances around $2.22, $2.47, and potentially $2.63.
“Still in buy zone” annotation – Absolutely valid: as long as XRP stays above that key base ($≈$2.10), the bullish case holds.
🔍 Market Context
Range consolidation between ~$2.10–$2.30 has been the dominant theme, awaiting a breakout catalyst (e.g., ETF approvals or legal clarity)
thecryptobasic.com
+14
fxempire.com
+14
crypto.news
+14
.
Analysts highlight a falling wedge and support zone between $2.00–$2.20—if price holds, a move toward $3–$4 is plausible .
A range-bound weekly outlook anticipates a push toward $2.50 resistance before exploring higher targets .
✔️ Summary
Buy zone holding: Bullish pattern confirmed with rebound from support.
Key resistance levels: Watch for a breakout above $2.17/EMA and then $2.22–$2.30/$2.50.
Ideal strategy: Maintain position above support; add on breakout, targeting $2.50–$3.00.
Risk points: A drop below $2.10 could test $2.00 or even $1.85 support.


Most saw weakness. I saw a fully-formed draw on liquidity.XRP just tapped the bottom of a 1D Fair Value Gap (FVG) — and with that, the stage is set.
The move down into 2.0758 wasn’t failure. It was function. That leg completed the imbalance left behind from May’s impulse, sweeping resting liquidity in the process. Classic Smart Money delivery — efficient and controlled.
Now price sits in discount.
The first bounce into 2.2027 was reactionary. But the next move through that level opens the door toward 2.3614 — the 1D OB and origin of the last major sell-side sequence. That's the draw. That’s where Smart Money is aiming.
Above it, we sit under a high-volume void, and a clean 0.382 retracement (2.4344). That’s where I'll be taking partials and re-evaluating.
If we reject from there? I’m ready for the rebalance. But I’m not assuming it — I’m following delivery.
Execution framework:
🔑 Entry: Reactive or confirmation entry from 2.0758–2.2027 zone
🎯 Target 1: 2.3614 (OB)
🎯 Target 2: 2.4344 (liquidity magnet)
❌ Invalidation: Full body closure below 1.9510 — invalidates structure and intent
I don’t trade the wick. I trade the imbalance behind it.
Precision isn’t about prediction. It’s about understanding the game.

XRPUSDT 2025 EDITION #5XRPUSDT 2025 EDITION #5
Among the top 5 altcoins to invest in for significant profits in 2025, XRP ranks #5 on my list.
Why does XRP make the top?
For spot trading, we focus on the reliability of larger timeframes. XRP achieves this on the monthly (M) and quarterly (3M) charts, giving us a clear BUY signal.
Larger timeframes: No peak has been formed yet, meaning M and 3M have not reached a PEAK.
Current situation: As shown on the radar chart, M is in an uptrend, while W1 (weekly) and D1 (daily) are undergoing corrections. This indicates we should wait for W1 and D1 to form a bottom. Once a BOTTOM is confirmed, you’ll have the lowest point of the W1 correction.
What to do now?
Wait for both D1 and W1 to form a bottom and then BUY.
Alternatively, wait to buy at the $1.5 range or higher. If the correction is weak, the price may only drop to around $2 before resuming its upward trend.
Target price range: $5.5–$6.
XRP MAJOR BULL COMING#XRP has been trading in a tight range between 2.00 and 2.70 for the last 90 days, setting the stage for a potential breakout. The price is coiling, hinting at a big move if it breaches these boundaries.
A break above 2.70 could propel CRYPTOCAP:XRP to 3.30 or even 3.90. Conversely, slipping below 2.00 might push it down to 1.50 or 1.20. Keep an eye on those key levels!

XRPUSDT Wave CountsI have posted a chart of XRP and VIX same like xrp is working, i have mention wave counts of this wave as per my analysis, It can go up to or beyond 1.45 as per my analysis.
You can post your questions or share your view in comments
Thanks

XRP : No confidence in the coin : Its about our powerful setup So such a shame with all those promises this coin remained being a bad investment for many.
XRP ARMY
Catch this one if you can
It might just cover up some time when you guys didn't make any profits
THIS ONE IS 3.69X trade as it looks like
Level Wise
Buy @ 0.51
TP @ 1.76/1.87
TP1 @ 1.369
SL @ 0.09

XRPUSDT 1.200 ?Hi Frnds,
First of all, Market is all about predictions and work on repetitions of similar patterns
So, I am posting this XRPUSDT chart with this kind of similar chart where market gives fake breakdown, you can ask me questions regarding this in comment section
Thanks

xrpusdt long xrpusdt Long /Short Entry with Exit Points ,Follow The Chart Support /Resistance For Swing Trades For Maximum Gain ,Scalp tp are (3-4 Days) Tp /Entry(support ) -exit (resistance) Are Mentioned In Chart
i m bullish on xrp ,bullrun target is ultra mega tps 5$ ,10$,22$
Important: Always Use Low Lev Never Gamble N Greed .

xrpusd i think its going to pump up from this key levelI am not an financial adviser soo trade at your own risk

XRPUSDT short on short term rallyXRPUSDT short on 4h chart and Entry at current market price and stop loss at .4150.
As per EW theory its the C wave in downtrend of overall bullish trend. i would be taking this short term benefit of small penny in my account.

XRPUSDT downside limited in short term XRPUSDT is limited downside having major support highiighted in double red lines.

XRPUSDTXrpusdt breached smaller resistance in 4hr tf with good volume and and bouncing from daila and weekly trendling support, so its bullish

#XRP/USDT 4HOUR UPDATE !!Hello dear traders, we here new so we ask you to support our ideas with your LIKE and COMMENT, also be free to ask any question in the comments, and we will try to answer for all, thank you, guys.
XRP/USDT UPDATE!
As we can see in the above-mentioned chart that XRP is trading inside a parallel channel pattern and is currently rejected from the middle band at a price range of $0.3480.
As here some correction is likely and again can fall down to lower trend line support just like before.
So we can see a bounce from the lower support level towards the upper trend resistance level.
Remember:-This is not a piece of financial advice. All investment made by me is at my own risk and I am held responsible for my own profit and losses. So, do your own research before investing in this trade.
Sorry for my English it is not my native language.
Do hit the like button if you like it and share your charts in the comments section.
Thank you.


XRP long idea XRP broke out and completed retest. ADX is also showing good signs. It looks very good Risk to Reward ratio right now.

xrp bullish after a crash of almost 60 %
the price took a support on monthly support zone and golden fib level and buyer have accumulated it well and we can see bullish engulfing
the coin XRP is small price wise & volatile to trade but with right entry and exit it give nice huge % swings
with entry at cmp and sl of 0.7345 and target can be spilt between 50-50% cut off the 0.5 and 0.e levels of fib resistance fan which is approximately around 0.8528 & 0.9482
