XRPUSDT - RETESTS RESISTANCE AFTER SELL-OFFSymbol - XRPUSDT
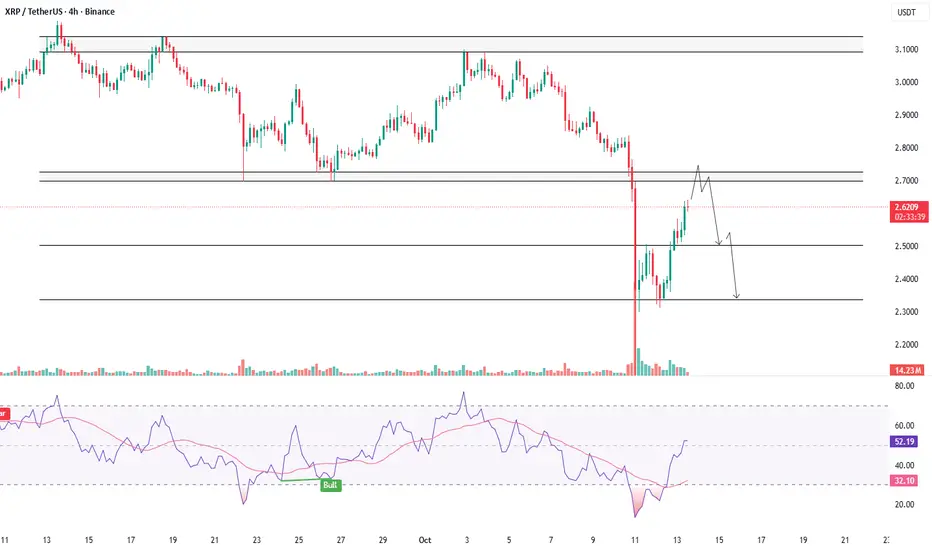
XRPUSDT is undergoing a corrective phase following a sharp sell-off. It remains premature to anticipate sustained growth without intermediate pullbacks, as the pair is approaching a major resistance zone.
The broader cryptocurrency market is showing signs of recovery after a period of heavy liquidations. Both BTCUSDT and XRPUSDT are nearing critical resistance levels, where a potential corrective movement could emerge.
From a technical perspective, after nearly two months of consolidation, the price broke below the established trading range, indicating a structural breakdown. As part of the current correction, XRPUSDT is retesting the liquidity zone between 2.7000 & 2.7266, which could serve as a trigger for renewed selling pressure.
Resistance levels: 2.7000 – 2.7266, 2.8286
Support level: 2.5050
A sharp advance without sufficient technical strength to surpass the 2.7000 resistance may lead to a false breakout, followed by a pullback toward the 2.5050 support zone.
Xrpusdtshort
XRPUSDT - FACES PRESSURE - WILL SUPPORT HOLD OR BREAK?Symbol - XRPUSDT
CMP - 2.1850
XRPUSDT remains under pressure despite the release of relatively positive news. The asset, currently in a downtrend, continues to test a critical support level, with the likelihood of a breakdown increasing.
XRP is consistently testing a robust support zone on the weekly timeframe. In the medium term, two potential scenarios could unfold, contingent on the overall market sentiment. Should the current market conditions persist, the probability of a downside breakdown and further decline becomes significantly higher.
At present, attention is centered on the key support level at 2.0637, where retests are occurring. However, the response to these retests is progressively weaker, which raises the likelihood of a continued decline towards the 1.90 - 1.63 range.
Resistance levels: 2.2650, 2.3650, 2.5090
Support levels: 2.0637, 1.9000
The broader cryptocurrency market is facing challenging conditions, including the ongoing tariff war, high inflation, declining stock markets, and a sense of disillusionment within the crypto community due to unmet expectations. Until these macroeconomic factors show signs of improvement, the technical outlook for XRP remains negative, and further declines may occur after a brief correction.

XRPUSDT - CORRECTION WITHIN BULLISH TREND?Symbol - XRPUSDT
Yesterday evening, XRPUSDT retraced the previous decline but encountered significant resistance, which defines the upper boundary of the descending channel. This may lead to a potential correction. Following a notable upward movement, XRP is now entering a corrective phase, which is occurring within a descending channel or flag pattern. The nature of this pattern suggests a continuation of the prevailing trend, with the broader market trend remaining bullish.
From a technical perspective, a false breakout of resistance and a subsequent correction are plausible, with a potential pullback to the 3000 level before the market begins to develop the momentum for a breakout of the channel’s resistance, thus facilitating further upward movement.
Key support levels: 3000, 2900
Key resistance levels: 3145, 3200
The liquidity zone between 3145 and 3200 may initially prevent the price from breaking higher. In the short term, I anticipate a false breakout followed by a correction to the targets outlined in the chart.

XRPUSDT Wave CountsHi, As per my analysis in upcoming days or in this month we can see a level breakout of xrp .7400 which is a sign of continuation of bullish trend if this level is taken out
Hope for the best
Thanks
Ishu Prajapati

XRPUSDT short on short term rallyXRPUSDT short on 4h chart and Entry at current market price and stop loss at .4150.
As per EW theory its the C wave in downtrend of overall bullish trend. i would be taking this short term benefit of small penny in my account.


XRPUSDT SHORT TRADEThanks for coming by to this update.
Before you start reading please hit that like button its free for you but precious for me. It motivates me to keep making such valuable contents for you all for free. It takes hours of research and attention.
Thanks
Let's get to the chart.
Guys firstly I need you to understand, TA is the perfect way to speculate the future price movements.
Taking trades on the basis of TA is mostly profitable.
So do not take any decision with emotions.
XRPUSDT GOOD TO SHORT 0.1800-0.1775
TRIANGLE BREAKDOWN IS POSSIBLE TO BREAK AND TARGET SHOULD 0.12800 (28.89%)
STOP LOSS : 0.2070 (15%)
Do hit that like button and share your views in the comment section.
