professional, price-action analysis of your XRP/USDT🔵 1. NO-TRADE ZONE
📍 2.018 – 2.088
(Your chart shows the dotted-line area + the nearest support & resistance)
Why this is a NO-TRADE Zone?
Price is in a sideways compression range.
Market is showing low momentum, lots of fake moves.
Best trades come after breakout + retest of this zone.
⚠️ Inside this area = avoid trading.
🟢 2. BUY SETUPS (LONG ENTRIES)
✅ BUY ENTRY 1 — Breakout Buy
Entry above: 2.088
Why buy here?
Breaks the consolidation range
Breaks previous lower-high structure
Strong bullish momentum triggers
SL: 2.018
TP1: 2.128
TP2: 2.166
TP3: 2.202
TP4: 2.248
TP5: 2.287
✅ BUY ENTRY 2 — Retest Buy (Safer)
Entry: Retest of 2.128 after breakout
Why?
Former resistance becomes support
Gives tight SL + clean trend continuation
SL: 2.088
TP1: 2.166
TP2: 2.202
TP3: 2.248
TP4: 2.287
🔴 3. SELL SETUPS (SHORT ENTRIES)
❗ SELL ENTRY 1 — Breakdown Sell
Entry below: 1.983
Why sell here?
Clear market structure break
Leaving the no-trade zone downward
Confirms lower-low continuation
SL: 2.018
TP1: 1.895
TP2: 1.860
TP3: 1.822
❗ SELL ENTRY 2 — Retest Sell
Entry: Retest of 1.983 from below
Why?
Broken support → new resistance
High-probability bearish continuation zone
SL: 2.018
TP1: 1.895
TP2: 1.860
TP3: 1.822
📌 4. WHY THESE LEVELS WORK
🟢 Buy Levels Because:
They break previous supply zones
They create higher highs
They align with price action continuation structure
🔴 Sell Levels Because:
They break demand zones
They confirm bearish trend continuation
Price will seek liquidity below recent lows
🛑 5. FINAL TRADING PLAN SUMMARY
NO TRADE
▪ 2.018 – 2.088
BUY ABOVE 2.088
SL → 2.018
TPs → 2.128 / 2.166 / 2.202 / 2.248 / 2.287
SELL BELOW 1.983
SL → 2.018
TPs → 1.895 / 1.860 / 1.822
Xrpusdttechnicalanalysis

XRPUSDT - EYEING A BREAKOUT ABOVE KEY RESISTANCESymbol - XRPUSDT
XRPUSDT is attempting to break through the upper boundary of its trading range amid a broader bullish recovery across the cryptocurrency market. A confirmed breakout may occur following a minor pullback.
The market continues to absorb the liquidation impact from last few days, with Bitcoin showing structural recovery, suggesting a potential resurgence of bullish sentiment. This development supports a more optimistic outlook for the overall crypto market.
XRPUSDT is currently testing resistance and entering a phase of consolidation. The key breakout trigger lies near 2.661 However, during consolidation, a retest of support levels remains possible as the market may seek liquidity before a potential upward continuation.
Resistance levels: 2.661, 2.739
Support levels: 2.587, 2.500
Since the start of the session, momentum has been notably strong, though a brief correction could materialize before the upward movement resumes. Within this corrective phase, XRPUSDT may retrace toward the 2.587 – 2.500 zone to gather liquidity before potential continuation.

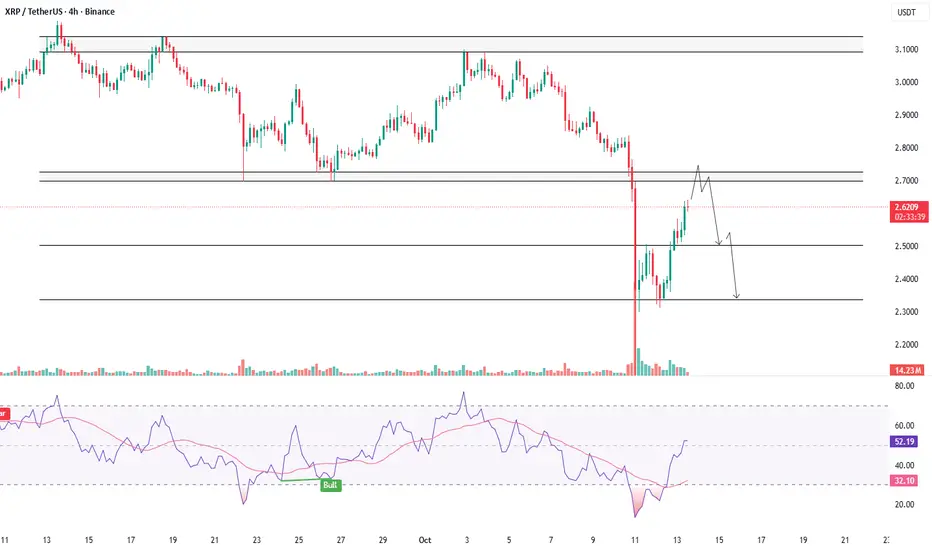
XRPUSDT - RETESTS RESISTANCE AFTER SELL-OFFSymbol - XRPUSDT
XRPUSDT is undergoing a corrective phase following a sharp sell-off. It remains premature to anticipate sustained growth without intermediate pullbacks, as the pair is approaching a major resistance zone.
The broader cryptocurrency market is showing signs of recovery after a period of heavy liquidations. Both BTCUSDT and XRPUSDT are nearing critical resistance levels, where a potential corrective movement could emerge.
From a technical perspective, after nearly two months of consolidation, the price broke below the established trading range, indicating a structural breakdown. As part of the current correction, XRPUSDT is retesting the liquidity zone between 2.7000 & 2.7266, which could serve as a trigger for renewed selling pressure.
Resistance levels: 2.7000 – 2.7266, 2.8286
Support level: 2.5050
A sharp advance without sufficient technical strength to surpass the 2.7000 resistance may lead to a false breakout, followed by a pullback toward the 2.5050 support zone.
XRPUSDT - FACES PRESSURE - WILL SUPPORT HOLD OR BREAK?Symbol - XRPUSDT
CMP - 2.1850
XRPUSDT remains under pressure despite the release of relatively positive news. The asset, currently in a downtrend, continues to test a critical support level, with the likelihood of a breakdown increasing.
XRP is consistently testing a robust support zone on the weekly timeframe. In the medium term, two potential scenarios could unfold, contingent on the overall market sentiment. Should the current market conditions persist, the probability of a downside breakdown and further decline becomes significantly higher.
At present, attention is centered on the key support level at 2.0637, where retests are occurring. However, the response to these retests is progressively weaker, which raises the likelihood of a continued decline towards the 1.90 - 1.63 range.
Resistance levels: 2.2650, 2.3650, 2.5090
Support levels: 2.0637, 1.9000
The broader cryptocurrency market is facing challenging conditions, including the ongoing tariff war, high inflation, declining stock markets, and a sense of disillusionment within the crypto community due to unmet expectations. Until these macroeconomic factors show signs of improvement, the technical outlook for XRP remains negative, and further declines may occur after a brief correction.

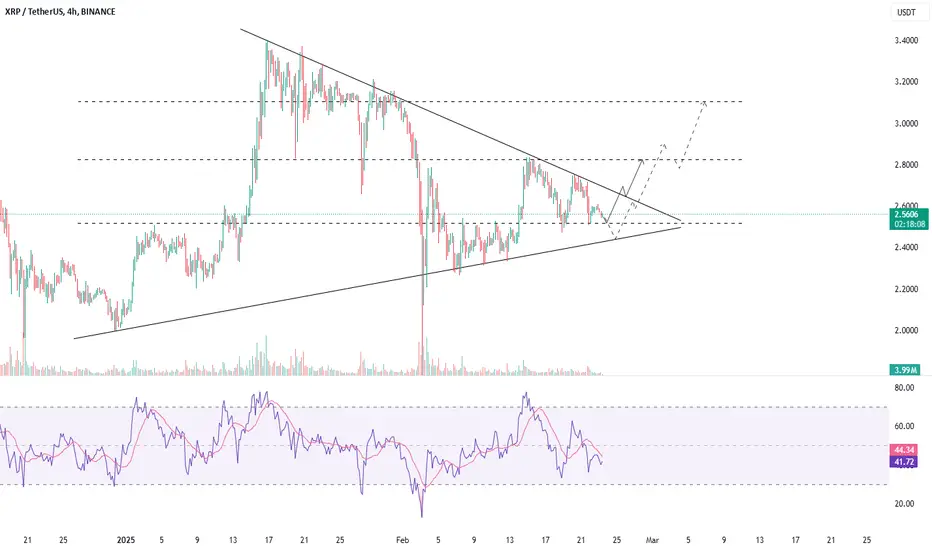
XRPUSDT - FORMING A BULLISH STRUCTURESymbol - XRPUSDT
CMP - 2.5500
XRPUSDT has been exhibiting a range-bound behavior recently, currently trading within a symmetrical triangle formation, indicating potential for a breakout in either direction. This pattern suggests that there is a convergence of support and resistance, and the price could move decisively once it breaks out of this range. Price is also forming a support area, suggesting a strong foundation for a potential upward move, especially if key levels are breached.
While the symmetrical triangle is a typical continuation pattern, the direction of the breakout is still uncertain due to the consolidation phase. Both upward and downward movements are possible depending on how the price interacts with key levels in the near term. I am closely monitoring the price action at these levels, as it could provide the clues necessary to gauge the next potential move.
From a fundamental perspective, the XRP market has seen some buzz surrounding the potential approval of an XRP-based ETF. This rumor has stirred investor sentiment, making the $2.83 level an important threshold. A break and consolidation above this level could trigger a continuation of the upside, especially if positive developments around the ETF rumor materialize. This could act as a major catalyst for a rally, especially if the broader market conditions remain favorable.
Key Support levels: $2.51, $2.00
Key Resistance levels: $2.83, $3.10
If XRP manages to break and hold above $2.83, it could initiate an upward push towards higher resistance levels, potentially igniting a stronger bullish momentum. However, caution should be exercised as the price could first face a retest of support before making any significant movement.
On the other hand, we should also keep an eye on the $2.51 - $2.48 level. A break of this support level could indicate a shift towards a downward trend, sending the price to test lower supports. However, if the price holds above this level, it could form a rebound, giving bulls another chance to push the price higher.
On both the daily and weekly timeframes, the consolidation following the recent rally remains a positive sign, suggesting that the upward momentum could resume once the price breaks out of the symmetrical triangle. As we navigate this phase, both long and short setups are still valid, depending on how the price behaves in relation to these key levels.
In summary, the market is in a phase of consolidation with a potential for upside movement if key resistance levels are cleared, especially with the underlying ETF rumors providing additional bullish sentiment. On the flip side, any breach of support levels could signal a corrective phase.
XRPUSDT - CORRECTION WITHIN BULLISH TREND?Symbol - XRPUSDT
Yesterday evening, XRPUSDT retraced the previous decline but encountered significant resistance, which defines the upper boundary of the descending channel. This may lead to a potential correction. Following a notable upward movement, XRP is now entering a corrective phase, which is occurring within a descending channel or flag pattern. The nature of this pattern suggests a continuation of the prevailing trend, with the broader market trend remaining bullish.
From a technical perspective, a false breakout of resistance and a subsequent correction are plausible, with a potential pullback to the 3000 level before the market begins to develop the momentum for a breakout of the channel’s resistance, thus facilitating further upward movement.
Key support levels: 3000, 2900
Key resistance levels: 3145, 3200
The liquidity zone between 3145 and 3200 may initially prevent the price from breaking higher. In the short term, I anticipate a false breakout followed by a correction to the targets outlined in the chart.

XRPUSDT Wave CountsHi, As per my analysis in upcoming days or in this month we can see a level breakout of xrp .7400 which is a sign of continuation of bullish trend if this level is taken out
Hope for the best
Thanks
Ishu Prajapati

xrpusdt long xrpusdt Long /Short Entry with Exit Points ,Follow The Chart Support /Resistance For Swing Trades For Maximum Gain ,Scalp tp are (3-4 Days) Tp /Entry(support ) -exit (resistance) Are Mentioned In Chart
i m bullish on xrp ,bullrun target is ultra mega tps 5$ ,10$,22$
Important: Always Use Low Lev Never Gamble N Greed .
