Yes Bank - Go LongYes Bank - Results are good. Creating ARC to transfer bad loans, DHFL case getting some kind of resoluion---- may take time.
Results are excellent considering the past three years of turmoil. Next year, the lock in period will get over. So, in my opinion, the price will move, once break out is done above 17, till next target of 32 and then 70 to 100.
Yesbank

YESBANK CAN MOVE ANOTHER 25%NSE:YESBANK
Once a darling stock of retail has broken out after a very long range can easily head to 18+ in coming days

YESBANK - TREND REVERSAL PATTERN FORMATION NSE:YESBANK
=Rectangle formation after a bear trend indicating short term trend reversal.
Yes bank has witnessed a very long bearish downtrend.
Yes bank has taken a support of lifetime low and its is consolidating heavily around that zone for more than a year
Have given a breakout from rectangle formation on daily timeframe with volume spike.
This might give follow up move in some time
Take small quantity above 15.25 for a swing trade and keep accumulating more on the breakout test zone.
# Have discussed how to trade rectangle pattern refer it for more detail.
Hope you found this helpful and I sincerely hope you find a ton of good rectangle formations to trade-in!
Happy Trading!

Only for study purpose ... Buy On CMP ...or whenever pattern breakout with strong green then take.
Why I'm telling you to buy here is because Risk management is better now because SL is so small.
5% SL and TGT is about 50% ... trail SL whenever price breaks the pattern.
.....
If the trendline breaks then also our SL is on the lower level.
Yes Bank - Inverse Head and ShoulderYes Bank looks bullish
Good volume keeps building. It is just a matter of trigger, when happens we can see it moving.
We can see inverse head and shoulder pattern formation which gives first target of 17.
But 100 and 200 EMA's are well above 33 levels which potrays future targets of Yes Bank.
Few good results and bang !!!
Disclaimer: This is not any kind of recommendation. Pls invest as per your understanding.

Yes Bank Ltd : Closing above 200EMA...Yes Bank is set to close above its 200 EMA. Also watch volume activity.
One can keep Yes Bank under watch for a target of 17 in the medium to long term.
Important is for Yes Bank to remain above 200 EMA for further action.

RBL: Target Rs 90Any reason why the drop should only be 20%. I feel absolutely not. It has hallmark of a very badly run bank. Greed is the word I guess. Moneycontrol should be taken to court for spreading lies last night about RJ/RKD stake in the bank. These morons just go scot free everytime becuase SEBI is staffed with nincompoops.
Let it go Yes Bank way and pay the fat bankers Private secttor salraies at Public sector Srrvice.

YES BANK - INTRADAY 15-12-2021YES BANK has bullish on daily timrframe as well as 15 minutes intraday chart so good pic on intraday
BUY YES BANK 14.05
TARGET 14.50 - 15
STOP LOSS 13.50
bullish technical indicators
1. 200 SMA at support
2. moving avg crossover
3. trendline & flag patter at breakout form
please make own studly and ANALYSIS take a call at own risk !
HAPPY TRADING !

YESBANK Breaking out?YESBANK was getting continuous resistance from 200DMA for a year since Nov'20 (as mentioned in our previous update on this stock in Oct'21, link below). The stock has finally gathered enough steam and has broken out of the 200DMA with volume. Is this a real breakout or will this be a fakeout and the stock will go back below the crucial 200DMA? We will watch out for the price action in this zone and update.

YESBANK Trading @ResistanceNSE:YESBANK
#YES bank trading bullish and reached Resistance level
BO confirmation will get positive momentum !!
Ping me directly for the levels....
No need to do anything !!

Yes BankMomentum is seen in daily TF chart.
by RSI & MACD.
It is very good sign as common indicators shown this momentum.
Surely big going to be happened and it is accumulation zone before explosion.
it is multibagger stock now.
fundamentally when private investors step in, it will going to be once in lifetime opportunity to accumulate in this stock.

YES Bank: Price Action Analysis & Trading TipsIs Yes Bank Making A New Low?
The YES Bank stock has started falling for a long period. If it breaks the consolidation area, it will keep collapsing, and we may see 10 - 9.60 levels soon. It's under that range from the last 17 days.
But according to price action analysis, it will try to jump up to make a new LH. It can be nearby the 12.15 - 13.5 range. Safe investors can start selling nearby dynamic LH with the stop loss above the hurdle line.
Further information I will update you soon.

Bank Nifty - Bullish !!!Buy on all dips !! long term weekly chart !! inverted head and shoulder with crazy targets of 60K ++

YES BANK A SPACE X ROCKET IN THE MAKINGnothing I will write here will make you buy this stock and that makes me so much more bullish on it
it will be a nifty 50 stock again don't know when but it will.
so lets see time will tell ..

YESBANK 200DMA RejectionYESBANK saw rejection at its 200 Day Moving Average (200DMA green line), yet again. Every time the price of the stock has hit its 200DMA from below, we have seen bullish rejection and the price has followed through on the bearish side. Today we saw another rejection at the 200DMA. Low risk short can be initiated here with stop loss above the 200DMA for price to get back toward the lower end of the range at 11.50.

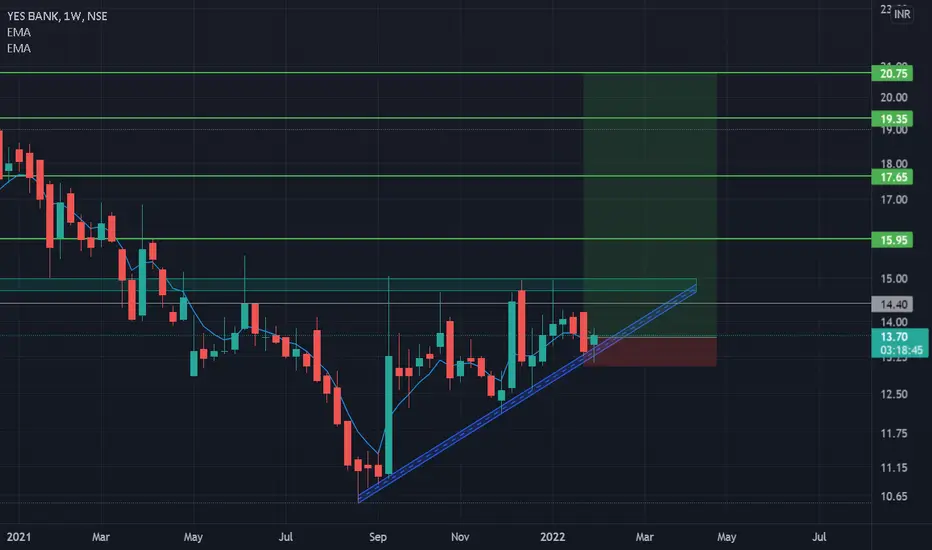
YES BANKshare name : yes bank
call type : positional
- 15.15 is acting as a huges resistance
- if share cross 15.15 then we can initatie
buying with the sl of 14, target = 20
time period - 1-2 months

YESBANKAs you can see, there is a good Bolinger Band formation in YESBANK with good volume and, at the same time, it has broken the downtrend. I believe YESBANK will now move in a Bolinger Band, so continue to average near 20MA (i.e. the middle band of the Bolinger Band is 20MA). After breaking the trend, the chart has also retested the support.
Please keep the lower band on a weekly timeframe as your stop-loss, and also keep trailing your SL.
Disclaimer: I personally hold YESBANK.
For education purposes only.
Not a SEBI registered broker.
Please ask your financial advisor before investing.


RISKY TRADE - BUY YES BANKBUY YES BANK AT CMP & ACCUMULATE UPTO 11
Presently in clear bearish trend. Trend Change expected only on decisive closing above 14 on Closing basis for Targets of 16, 18, 20++
SL 9 on Weekly Closing basis.
PS: Invest only that amount which you can afford to loose.
Disclaimer: All Charts are for educational purpose. Please consult your financial advisor before investing.

YES BANK ...weekly levelsYESBANK now exactly in double bottom at rate of 11.10 in weekly candle
Its possible to move up direction from this point

Yes bank buy at CMP for quick returnYes bank at the lower side on parallel channel. Buy at CMP for quick reversal. SL 10.80

YESBANK............ Should you say YES ???worth a buy only and only above 13.55 closing basis
shop at bottom levels marked...
levels valid for aug 21

YES BANKupside only above 13.4. below 11.1 it can touch 8.5 - 7.1 - 5.15.
new yearly high of 26.7 possible if it doesn't go below 11.9 as a decent breakout is on chart is visible.
