Yes Bank Era is coming!!NSE:IDEA
1M CHART
CMP 14 ruppes
DOUBLE BOTTOM
VOLUME LOOKING GOOD
13-16 MAJOR RESISTANCE ZONE
Above upside 23-30 to 44 shorter term can expect
LONG TERM TARGET can 62 to 114
TECHNICALLY BASE
CHART LOOKING VERY INTRESTING
Yesbankbuy

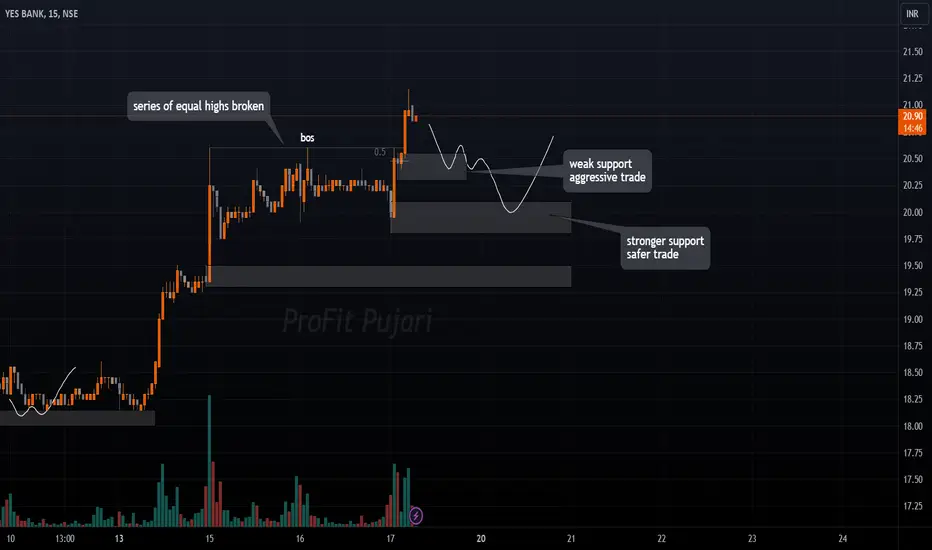
#YESBANK long trade idea setup 17/11/23Greetings Folks,
today I have prepared a setup of YESBANK on NSE
the analysis is as follows-
-the price recently broke out of a series of equal highs
- we are now waiting for a suitable retracement for the trade
- 2 possible support zones, first one is weak and unreliable but it can work out because the stock is accompanied with good volume
- the latter support zone is safer and new traders should use this zone
don't play with fire, always use a predefined stoploss
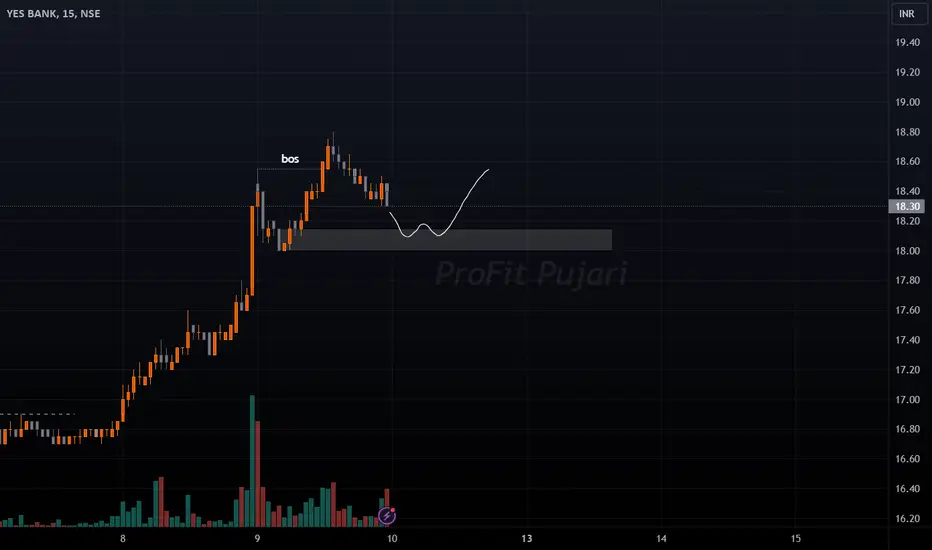
#YESBANK LONG TRADE IDEA SETUPGreetings Folks,
today I have prepared a setup of YESBANK on NSE
the analysis is as follows-
- the price is on a roll right now, making good structure along with new higher highs
- the market was slow today, hoping for a retracement for the price to gear up for the next bullish leg
- it CAN retrace deeper than the zone depicted in the chart if index opens negative tomorrow
don't play with fire, always use a predefined stoploss
Buy Yesbank @ 17.25 SL 16.6"Delivery Idea 11-08-23
YESBANK (CMP: 17.25)
Buy Price: 17.25
SL Below: 16.6
Target: 19"
For any Feedback and Suggestion, please free feel to message us.
Disclaimer: Content shared on or through our digital media channels are for information and education purposes only and should not be treated as investment or trading advice. Please do your own analysis or take independent professional financial advice before making any investments based on your own personal circumstances. Investment in securities are subject to market risks, please carry out your due diligence before investing. And last but not the least, past performance is not indicative of future returns.

32 # Yes BankCan NSE:YESBANK be a Multi Bagger Stock ?
Reason Being:
1. Stock Consolidating in the zone of Rs. 10 to 20 for almost 2.5 years
2. Resistance Breakout with Heavy Volume
3. Breakout with Rounded Bottom Formation indicating a reversal in the NSE:YESBANK
4. OBV showing a successful Breakout as OBV
5. EMA 20 Crosses Above EMA 50 in Weekly Time Frame
if you liked it please don't forget to follow me
#Disclaimer: I'm not a SEBI Registered Research Analyst, These are my views, please consult your Investment Advisor before buying and selling any position. This is just for Education purposes.

Yes Bank Ltd (YESBANK): Is it time to say "Yes" to the bank?Today, Yes Bank broke the 28 week consolidation high of 15.05 with good volume. But ended closing marginally below at 14.70
Important to note, it crossed the important levels of 50, 100 and 200 day Moving average and closed above it. This can be a positive sign for the stock. However, the next few days are important to see how the price behaves.
It might consolidate between 14.25 and 15, or else if the momentum continues, and the price action sees good volume above the level of 15, then we can see a level of 16 and 18.
The current 200day exponential moving average, at 13.85, can also also act as stop loss level.
However, strictly follow your stop loss at 5-8% or as per your risk management.

Yes Bank forming a Morning star.Yes Bank showing some positive signs for the stock investors.
The stock has given a return of 20% from the mid of JULY 22 and still looks good for a swing trade.
The positive signs for the swing trade.
1. Morning star pattern.
2. Trading above 20 ema and bullish MA crossover already there.
3. Volumes are high in daily candle.
4. Respected support levels.
The trade can be initiated once the stock cross and sustain above today's high.
Target :- 17.3, 19.5
Stop loss :- Close below 15.3 on daily time frame.
Wait and watch the stock levels and price action before entering the trade.


YESBANK Trading @ResistanceNSE:YESBANK
#YES bank trading bullish and reached Resistance level
BO confirmation will get positive momentum !!
Ping me directly for the levels....
No need to do anything !!

Yes BankMomentum is seen in daily TF chart.
by RSI & MACD.
It is very good sign as common indicators shown this momentum.
Surely big going to be happened and it is accumulation zone before explosion.
it is multibagger stock now.
fundamentally when private investors step in, it will going to be once in lifetime opportunity to accumulate in this stock.

YES BANKshare name : yes bank
call type : positional
- 15.15 is acting as a huges resistance
- if share cross 15.15 then we can initatie
buying with the sl of 14, target = 20
time period - 1-2 months

YESBANKAs you can see, there is a good Bolinger Band formation in YESBANK with good volume and, at the same time, it has broken the downtrend. I believe YESBANK will now move in a Bolinger Band, so continue to average near 20MA (i.e. the middle band of the Bolinger Band is 20MA). After breaking the trend, the chart has also retested the support.
Please keep the lower band on a weekly timeframe as your stop-loss, and also keep trailing your SL.
Disclaimer: I personally hold YESBANK.
For education purposes only.
Not a SEBI registered broker.
Please ask your financial advisor before investing.

Live Challenging Stock Market Analysis YESBANK Buy @ 15.05Market Analysis
Live Challenging Stock Market Analysis YESBANK Buy @ 15.05
Target @ 20.85
#sharemarket #yesbank #Nse #stockmarket
Our Unique Features:
—————————————————————
1. Follow our 15 signals ….10% equity will increase in your account for sure.
2. We are not Trailing stop! or average the trades.
3. 2% Risk Management Per trade.
4. Risk vs Reward up to 1:7.
Note:
Trade signals would usually have a risk to reward ratio of 1:2.
It means that even 2 out of 4 signals hits their SL marks, the other two would have closed with profit.
This allows you to be good in overall pips profit.
Signals are usually inter-day (Based on the daily candle) therefore, trades would usually have a holding time of an average minimum of 24 hours.
Note: Everything works with Best money management.
Note: Please leave comments for any query.
Disclaimer: This is my trading experience, it is not an invite or recommendation to trade.
Best Wishes
Tradingwithtamil

YESBANK SWING TRADE 1D TFYESBANK is currently trading in channel and recently made a higher low, so we will try to trade for the higher high by initiating a long trade above @ 14.15 with StopLoss below @ 12.85.

yes bankYes bank turns a buy for MACD Indicator as Care has upgraded the various bonds , can place assurance upto certain time on Yes bank Right time to buy target 25.30 for long term

Yes Bank Quarter 2 PredictionAs per RSI, technically yes bank is showing an oversold sign, and hence there are high chances of an uptrend.
My target remains the same for the bank.

YesBank intraday YesBank is gonna go up with Niftybank.
With the news of JC Flowers and the volume of buyers with respect to sellers, it atleast gonna go up with 1.5-1.8.
I'am a new trader, hungrily learner. Hoping to raise my Rs. 500 capital i just made Rs 4 on YesBank today. and also lost Rs. 5 at the end of the day.
I have made some amatuer technical analysis using my knowledge from some watching some people on youtube.
I have used flags/ wedges / two tops, bottoms on monthly, weekly, daily charts of YesBank


YES BANK BUY FOR LONG TERM INVESTORSNSE:YESBANK The stock is trading in a range which is near a decade's low. Once the bank manages to get a support of good financier, it is not going to stop. Being one of the largest private sector lander, the bank is not going to ashes. So, need to worry is little. It is BUY and ACCUMULATE candidate between 30-35 range for outlook of long term investing.

Yes to yesbank for bullish Bullish breakout in Yesbank. Short term target 48 Rs and long term target is above 62 Rs


"YES BANK" - Possible 30% Move If H&S Plays Out.1. Looking over Line Chart to find out the patterns.
2. Inverse H&S Pattern Spotted.
3. Break of neckline and it will go 20-30%.
4. Trade the plan long on breakout... Stop Loss Below the Neck Line.
Join out telegram to get regular updates :
t.me

YES BANK ANALYSIS STRICTLY FOR INVESTORSAS I HAVE MENTIONED WITH CALL OUT THERE IS A GAP AND IT HAS TO BE FILLED TARGET FOR INVESTORS IS MARKED WITH ARROW BUT HOW LONG WILL IT TAKE TO FILL THE GAP NOBODY KNOWS GOOD ENTRY POINT IS 40 RUPEES APPROX BUT REMEMBER IF BAD NEWS COMES NOTHING WILL WORK
GOOD LUCK
NOTE: TRADE AT YOUR OWN RISK PROFIT IS YOURS LOSS IS ALSO YOURS
