Yesbanksupport
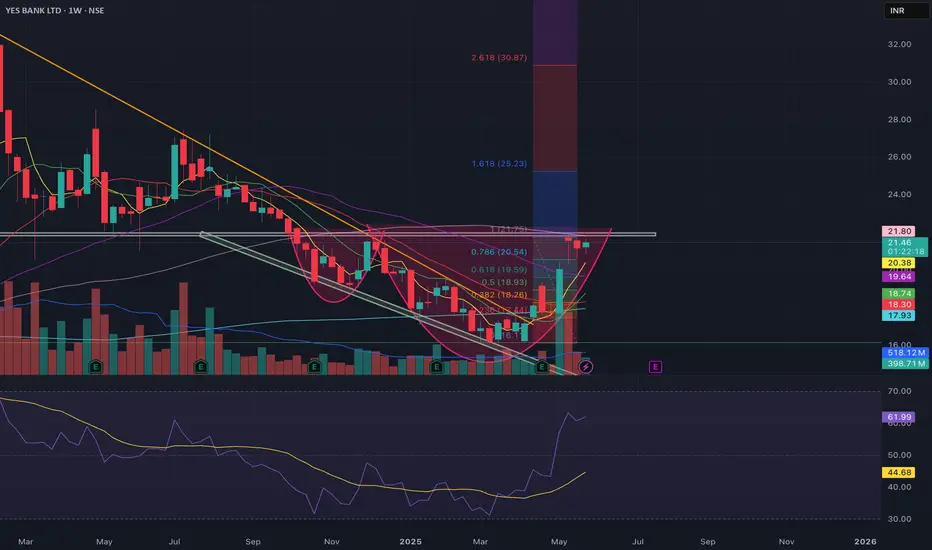
Yes Bank cmp 23 by Weekly Chart viewYes Bank cmp 23 by Weekly Chart view
- Support Zone at 21 to 22.50 Price Band
- Old Daily Chart Gap Down Opening of January 2023 has been filled
- Weekly basis Support at 20 > 16 > 11 with Resistance at 27 > 32 > 37
- *Recent Daily Chart Gap Down Opening of July 2024 will need to be filled, sooner or later*
- *Stock Price is sustaining above Support Zone but Volumes suggestive of probable breakdown if the Support Zone is crossed*
Yes Bank forming a Morning star.Yes Bank showing some positive signs for the stock investors.
The stock has given a return of 20% from the mid of JULY 22 and still looks good for a swing trade.
The positive signs for the swing trade.
1. Morning star pattern.
2. Trading above 20 ema and bullish MA crossover already there.
3. Volumes are high in daily candle.
4. Respected support levels.
The trade can be initiated once the stock cross and sustain above today's high.
Target :- 17.3, 19.5
Stop loss :- Close below 15.3 on dai
YES BANK "DOWN TO DUST"...IS THIS THE RIGHT TIME TO ACCUMULATE!!
Yes Bank being a stock which created wealth for its investors which went straight up from as low as Rs 8.10 to Rs 404 in mere 9 yrs and 4 months went for a toss in Sep 18
This stock HOLDING the title of a "Biggest wealth destroyer of the decade" in Nifty 50 list
Lets see was there anything which could have saved investors who got trapped and even averaged Yes Bank at lower levels
WARNING signs were well in advance visible on chart ie 03 Sep 18 about its internal issues
Distribu