Eternal (Zomato) price action analysis for Feb-Mar 2026Analysis data: 26-Jan-26
Zomato had a good runup from 240 levels to 360 levels from May 2025 to Oct 2025.
Stock is currently at 258. It is likely to take support as buyers are expected in the 240-250 region again. However this time the targets would be 280, 290 & 300 levels.
Keep SL at 230
Happy Trading!
Zomato

Eternal Zomato shows strong weakness NSE:ETERNAL
Zomato Near to end his up trend
major support is break near 300 and retested that level and gave another strong down move in daliy time frame. that retest also brakes another support with volume and big move.
chart picture explain all things.
next major support is gap is 230 and that whole zone till 200.
this is not any types of advice.
this is just chart analysis.
do your own research

Eternal Ltd at a Critical Make-or-Break Zone – Long OpportunityEternal Ltd is currently trading near a well-defined demand and trendline support zone after a sharp corrective phase from its recent highs. The price action suggests that selling pressure is gradually losing strength, and the stock is attempting to stabilize around the 285–290 range. This area is technically important, as it aligns with a rising long-term trendline and acts as a base where buyers have previously stepped in.
From a moving average perspective, price is still trading below the short-term EMA, indicating that the trend reversal is not yet fully confirmed. However, the stock is holding above the major support zone and showing signs of recovery from intraday lows. A sustained move above the near-term resistance around 300–305 would be the first indication of strength and could shift the short-term bias toward bullish.
The RSI structure adds an important clue to this setup. After remaining in the lower zone for some time, RSI is attempting a bullish reversal from oversold territory. This positive divergence-like behavior indicates improving momentum and increases the probability of a relief rally. If RSI continues to move upward and sustains above the 50 zone, it would further validate the bullish case.
In the bullish scenario, once price holds above 300 on a closing basis, the stock can gradually move toward the first upside objective near 313. A breakout and hold above this level could open the path toward the next resistance around 335, followed by the extended target zone near 360 in the medium term. These targets are expected to be achieved in phases, with intermittent consolidations.
On the downside, the risk remains clearly defined. A decisive breakdown below the 280 support zone would invalidate the bullish setup and may lead to further downside pressure. Hence, this is not a confirmed breakout trade yet, but rather an early-stage opportunity near strong support where risk-to-reward remains favorable if managed properly.
Overall, Eternal Ltd is presenting a potential long opportunity near its base, supported by structure and improving momentum. Traders should wait for confirmation above resistance levels for higher conviction, while positional participants may track this zone closely with strict risk management in place.

Eternal (D) - Hits New High But Stalls at Channel ResistanceZomato has been trading in a predictable, well-defined pattern, but recent price action, including a new all-time high today, is showing significant signs of exhaustion that could signal a short-term reversal.
The Ascending Channel
Since July 2025, the stock has been trading within a clear ascending channel , consistently respecting the upper boundary as resistance and the lower boundary as support. This pattern has provided a reliable roadmap for the stock's trajectory.
Today (Tuesday, October 14, 2025), while the stock did register a new All-Time High (ATH), it importantly failed to break out of the channel's resistance and was rejected from this upper boundary. This price action suggests that selling pressure is emerging at this predictable level.
Warning Signs of Waning Momentum
Several indicators support the view that the current up-move is losing steam, despite the new high:
- Bearish Divergence: The Relative Strength Index (RSI) is in a "lowering state" while the price is making new highs. This is a classic bearish divergence , a strong indicator that the underlying momentum of the trend is weakening.
- Declining Volume: The recent rally towards the top of the channel has been accompanied by decreasing volume, which suggests a lack of strong conviction from buyers at these higher levels.
While the short-term EMAs remain in a bullish state, the rejection at resistance combined with these warning signs presents a compelling case for a potential pullback.
Outlook
Based on the consistent channel pattern and the clear signs of weakening momentum, the most probable scenario is that Zomato will reverse from this resistance level and trend down towards the channel's support line.
The key action to watch for in the coming days is a confirmation of this reversal, such as a close below today's low or the formation of a strong bearish candle. A decisive, high-volume breakout above the channel's resistance would be needed to invalidate this bearish outlook.

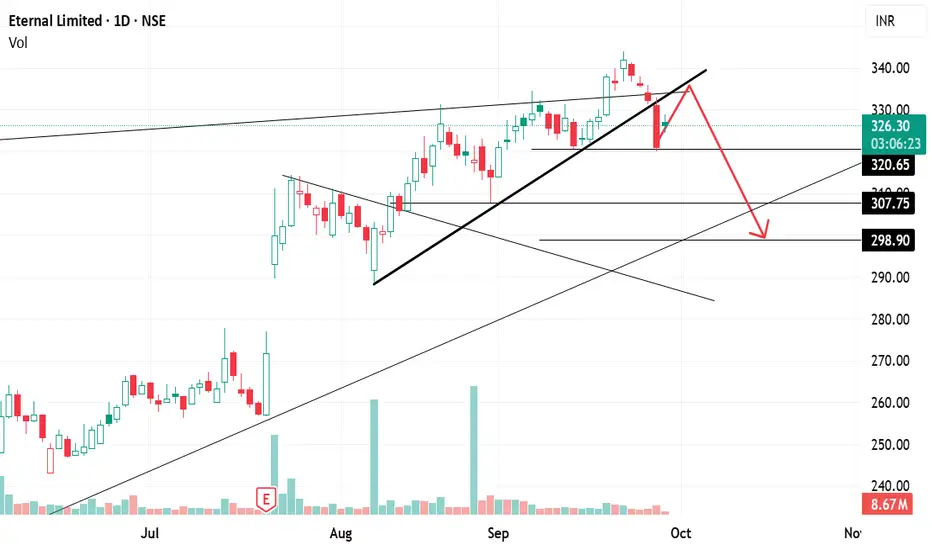
ETERNAL (Zomato): Breakdown Below Trendline ETERNAL (Zomato) had been on a strong bull run since April 2025, rallying from ₹195 to ₹344 🚀. Throughout this journey, the stock consistently respected an upward trendline, bouncing every time it touched the line.
But things changed on 26th September 2025:
❌ The stock broke down below the trendline support for the first time.
After the breakdown, it reached a low of ₹320, signaling that the structure had become weak
✨ 1. Trendline Signals (Daily Chart)
If we connect all the key highs of September 2024, December 2024, August 2025, and September 2025, we obtain a resistance trendline.
Recently, the stock gave a breakout above this trendline, but it failed to sustain and quickly slipped back below it.
This false breakout followed by weakness is often a bearish signal ⚠️.
📅 2. Short-Term View
Right now, the stock is hovering near ₹320, a critical support level.
If ₹320 breaks decisively, the weakness will get confirmed, and the stock may head toward:
🎯 ₹310
🎯 ₹300 (short-term target zone).
Until then, some retracement or sideways movement may happen, but the overall bias is weak.
🕰️ 3. Weekly Chart View (Bigger Picture)
Last week, the stock formed a bearish engulfing candle, where the body of the red candle completely covers the body of the previous green candle.
This pattern is a reversal signal, showing sellers overpowering buyers.
If this week’s close is below ₹320, it will confirm the bearish engulfing pattern ✅, adding further weight to the downside scenario.
📌 Summary:
🔻 Weakness Detected: Breakdown of trendline + false breakout on resistance.
⚠️ Confirmation Needed: Closing below ₹320 will confirm bearish engulfing and continuation of weakness.
🎯 Targets: If ₹320 breaks, next levels are ₹310 and ₹300.
🛡️ If ₹320 holds: Stock may bounce, but the overall structure remains fragile.
ETERNAL (ZOMATO) By KRS Charts17th April 2025 / 1:24 PM
Why Eternal ??
1. All Over Bullish Stock. Yet Not Profitable but Business model has potential in near Future.
2. Wave Count is suggesting 4th wave is likely finish and 5th last leg is started which can last till 340 Rs.
3 RSI & MACD is showing bullish continues Divg. bears gave there all but failed to make new lower low.
4. Lower TF is showing W pattern Breakout as well with good volume.
Targets and SL 1W Closing Basis are mentioned in chart.

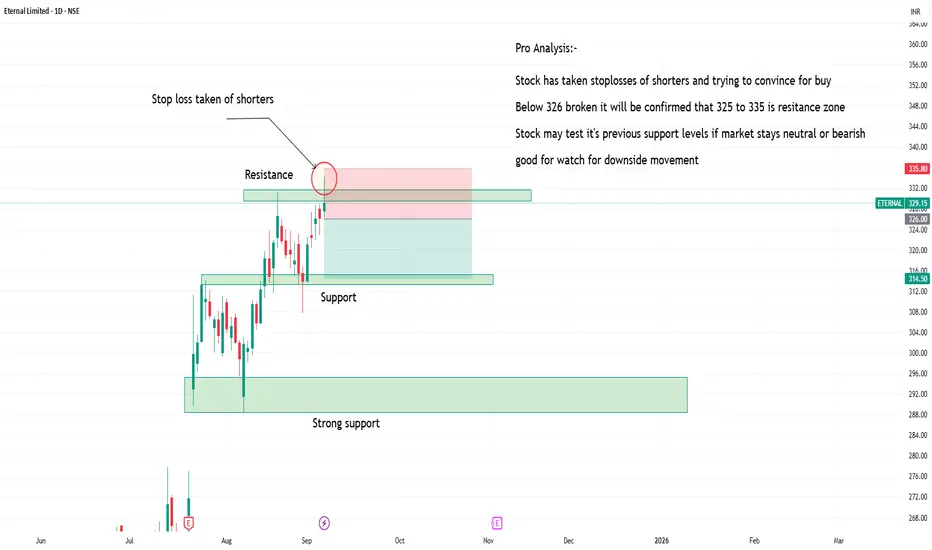
Zomato creating it's resistance zoneZomato is testing it's resistance zone.
one can watch for downside movement with stop losses above recent swing with targets of 215 levels.
it's pure price action.
stock may go in consolidate in zone for long time.
INFY 1D Time frame📉 Current Market Snapshot
Current Price: ₹1,525.60
Previous Close: ₹1,509.70
Day's Range: ₹1,521.10 – ₹1,542.90
52-Week High: ₹2,006.45
52-Week Low: ₹1,307.00
Market Cap: ₹6,33,794 crore
P/E Ratio: 23.0
Dividend Yield: 2.82%
ROE: 28.72%
Debt-to-Equity Ratio: 0.09
Beta: 1.11
EPS (TTM): ₹65.63
Face Value: ₹5.00
VWAP: ₹1,529.86
Volume: 12,856,963 shares
ATR (14): ₹5.72
MFI: 71.75
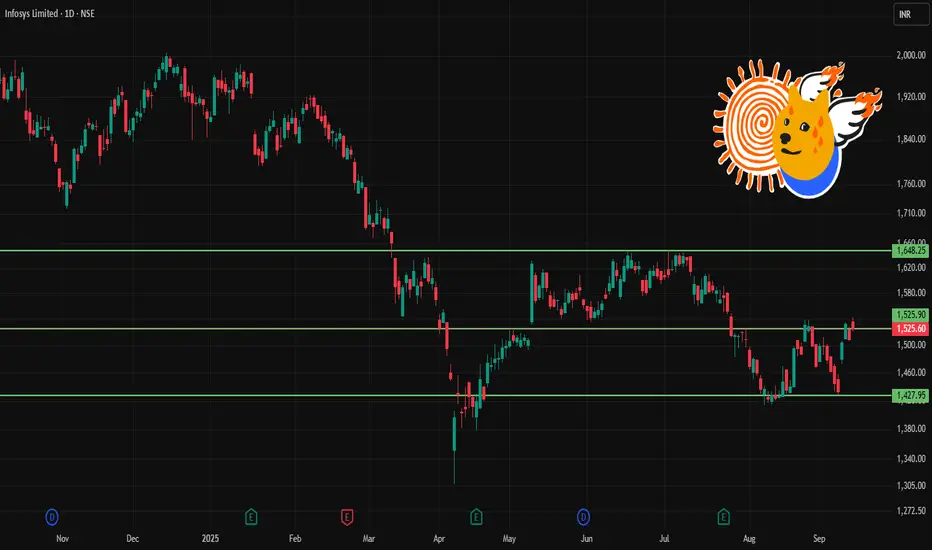
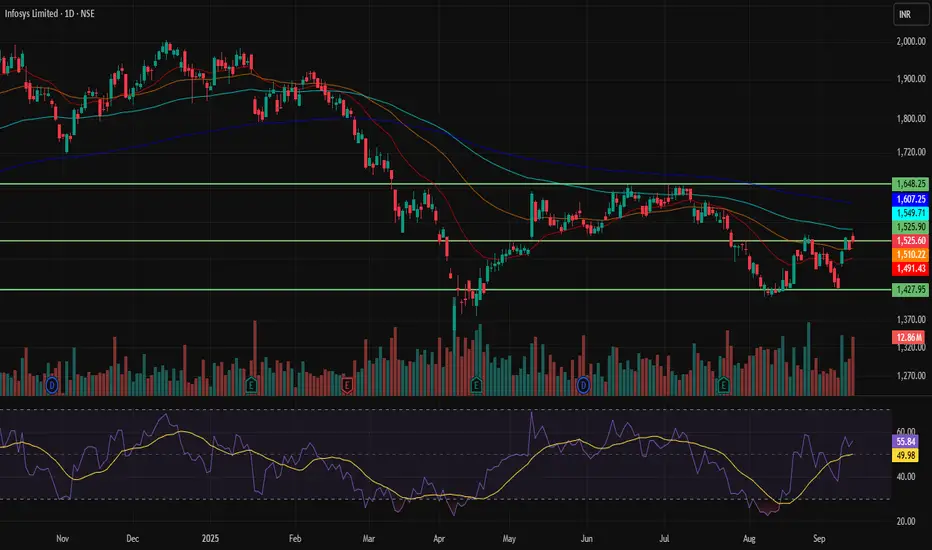
INFY 1D Time frame🔢 Current Level
Trading near ₹1,525.60
🔑 Key Resistance & Support Levels
Resistance Zones:
~ ₹1,539 – ₹1,552 (near-term resistance)
~ ₹1,560 – ₹1,570 (stronger resistance if price moves higher)
Support Zones:
~ ₹1,510 – ₹1,500 (immediate support)
~ ₹1,470 – ₹1,450 (secondary support)
~ ₹1,380 – ₹1,400 (deeper support if selling pressure builds)
📉 Outlook
Bullish Scenario: A close above ₹1,540 could fuel momentum toward ₹1,560+.
Bearish Scenario: If it slips below ₹1,510, risk opens toward ₹1,470 or even ₹1,400.
Neutral / Range: Likely sideways between ₹1,510 – ₹1,552 until a breakout.
Part 7 Trading Master Class Why Traders Use Options
Hedging – Protect portfolio against price swings.
Speculation – Bet on future price movements with smaller capital.
Income Generation – Sell options and earn premiums.
Arbitrage – Exploit mispricing between spot and derivatives.
Options Pricing Models
Two main models:
Black-Scholes Model: Uses volatility, strike, expiry, and interest rates to price options.
Binomial Model: Breaks time into steps, considering probability of price moves.
Factors affecting option prices:
Spot price of underlying
Strike price
Time to expiry
Volatility
Interest rates
Dividends
Strategies in Option Trading
Options allow creation of custom payoff structures. Strategies are classified as:
A. Protective Strategies
Protective Put – Holding stock + buying put (like insurance).
Covered Call – Holding stock + selling call.
B. Income Strategies
Iron Condor – Selling OTM call & put, buying further OTM options.
Strangle/Straddle Selling – Profit from time decay when market is range-bound.
C. Speculative Strategies
Long Straddle – Buy ATM call + put, profit from big moves.
Bull Call Spread – Buy lower strike call, sell higher strike call.
Bear Put Spread – Buy higher strike put, sell lower strike put.
📊 Each strategy has its risk/reward profile. Professional traders combine them depending on market conditions.

Part 4 Learn Institutional Trading Introduction to Options
Financial markets provide several instruments to trade and invest. Among equities, futures, commodities, and currencies, options trading has gained significant popularity worldwide, including India. Options are not just speculative tools; they are also powerful instruments for hedging, income generation, and risk management.
An option is essentially a derivative contract—its value is derived from an underlying asset like a stock, index, commodity, or currency. Unlike direct stock ownership, an option gives the buyer rights but not obligations. This unique feature makes them versatile but also complex for beginners.
To truly master options, one must understand not only the basic definitions but also pricing, market psychology, and strategies.
Basic Terminology
Before diving deeper, let’s go through the essential terms:
Option Contract: Agreement between buyer and seller based on an underlying asset.
Underlying Asset: Stock, index, commodity, or currency.
Strike Price: Pre-decided price at which the option can be exercised.
Expiry Date: The last date on which the option can be exercised.
Premium: Price paid by the buyer to acquire the option.
Lot Size: Minimum quantity for which an option can be traded.
European vs. American Options: European can be exercised only on expiry; American anytime before expiry.
How Options Work in Practice
Option buyers have limited risk (premium paid) but unlimited profit potential (in calls if stock rises, in puts if stock falls).
Option sellers have limited profit (premium received) but potentially unlimited risk.
This asymmetric payoff structure creates a market where traders, hedgers, and institutions interact.

Derivatives in India: Secret Strategies for Massive ReturnsChapter 1: Understanding the Derivative Landscape in India
Before diving into strategies, it’s essential to understand the structure of derivatives in India.
1.1 What Are Derivatives?
A derivative is a financial contract whose value is derived from an underlying asset—such as stocks, indices, commodities, or currencies. In India, the most popular derivatives are:
Futures: Obligatory contracts to buy/sell at a predetermined price and date.
Options: Rights (but not obligations) to buy (call) or sell (put) at a specified price.
1.2 Key Milestones in India’s Derivatives Market
2000: NSE introduced index futures (Nifty 50).
2001: Index options and stock options launched.
2002: Stock futures introduced.
2020s: Surge in retail participation, especially in weekly options like Bank Nifty and Nifty.
1.3 Why Derivatives Matter in India
High Liquidity: Nifty and Bank Nifty options are among the most traded contracts globally.
Leverage: Small capital can control large positions.
Risk Management: Hedging against market volatility.
Speculation: Rapid gains (or losses) from price swings.
Chapter 2: The Psychology of Massive Returns
Before we look at the “secret strategies,” it’s important to highlight the psychological aspect.
2.1 Retail vs. Institutional Mindset
Retail traders often chase short-term profits, influenced by tips and news.
Institutions focus on risk-adjusted returns and hedging.
2.2 The Power of Discipline
The secret to massive returns isn’t chasing every trade but mastering risk control. Successful derivative players:
Limit losses using stop-loss orders.
Diversify positions.
Understand implied volatility and time decay.
2.3 The Illusion of Quick Money
Many traders blow up accounts because derivatives magnify both profits and losses. True success comes when strategies align with market structure.
Chapter 3: Secret Derivative Strategies for Massive Returns
Now let’s uncover the advanced and lesser-known strategies that experienced traders in India deploy.
3.1 The “Covered Call” Strategy
How it works: Buy a stock and sell a call option on the same stock.
Why it works in India: Many Indian stocks (like Infosys, HDFC Bank, Reliance) have stable long-term growth. Covered calls allow investors to earn extra income through premiums.
Secret Edge: Institutions frequently roll over covered calls, effectively compounding returns.
3.2 The “Straddle & Strangle” Trick Before Events
Straddle: Buy both a call and a put at the same strike price.
Strangle: Buy a call and a put at different strike prices.
When to use: Before high-volatility events (Union Budget, RBI monetary policy, earnings).
Secret Edge: In India, implied volatility (IV) tends to spike before events, allowing traders to profit even without large price moves.
3.3 The “Iron Condor” Strategy for Sideways Markets
Setup: Sell an out-of-the-money call and put, and buy further out-of-the-money call and put.
Why it works: Indian indices often consolidate after big moves, making non-directional strategies highly profitable.
Secret Edge: Works exceptionally well during weeks when no major events are scheduled.
3.4 The “Calendar Spread” Advantage
How it works: Sell near-term options and buy long-term options.
Why it works in India: Weekly options expire every Thursday, while monthly options provide longer exposure. Traders exploit the faster time decay in short-term contracts.
3.5 The “Delta Neutral” Hedge Fund Style Strategy
Concept: Create positions where overall delta (price sensitivity) is near zero, focusing on volatility instead of direction.
Example: Combine futures and options to balance exposure.
Secret Edge: Many prop desks in India use delta-neutral positions with high leverage to scalp volatility.
3.6 Bank Nifty Weekly Options: The Retail Goldmine
Why Bank Nifty? It has the highest liquidity and volatility.
Secret Trick: Institutions often sell far out-of-the-money (OTM) options to collect premiums, while retail traders chase cheap options.
How to win: Instead of buying OTM lottery tickets, adopt option-selling strategies with strict risk management.
3.7 “Event-Based Futures Arbitrage”
Concept: Price discrepancies often exist between cash and futures markets during dividend announcements, stock splits, or mergers.
Secret Edge: Advanced traders arbitrage these mispricings for near risk-free profits.
3.8 “Sectoral Rotational Strategies”
How it works: Track which sector index (Nifty IT, Nifty Pharma, Nifty Bank) is gaining momentum.
Secret Edge: Derivatives allow leveraged plays on sectors, amplifying returns during sectoral bull runs.
Chapter 4: Institutional Secrets That Retail Misses
Institutions and proprietary trading desks in India use strategies hidden from retail eyes.
4.1 Options Writing Dominance
Data shows institutions and HNIs are net option sellers, while retail is usually on the buying side. Sellers win most of the time due to time decay (theta).
4.2 Smart Order Flow Analysis
Institutions use algorithms to analyze open interest (OI) buildup. For example:
Rising OI with price rise → Long buildup.
Rising OI with price fall → Short buildup.
Retail often ignores these signs.
4.3 Implied Volatility Arbitrage
Big players monitor volatility skews between Nifty and Bank Nifty, or between weekly and monthly contracts. They profit from mispriced options that retail never notices.
Chapter 5: Risk Management – The True Secret to Longevity
No matter how powerful your strategy, risk management is the real differentiator.
5.1 The 2% Rule
Never risk more than 2% of capital on a single trade.
5.2 Stop-Loss Discipline
Options can go to zero, but a stop-loss saves you from portfolio collapse.
5.3 Position Sizing
Institutions diversify across indices, stocks, and expiries to avoid overexposure. Retail traders should do the same.
Conclusion
Derivatives in India present unparalleled opportunities for those who know how to use them wisely. The secret strategies for massive returns aren’t really about exotic formulas—they’re about understanding volatility, market psychology, institutional behavior, and risk management.
While retail traders often chase lottery-style option buying, the real winners are those who:
Sell options with discipline.
Use spreads and hedges to limit risks.
Exploit volatility and time decay.
Align trades with institutional flows.
If you want to succeed in the derivative markets of India, stop searching for shortcuts. Instead, master these strategies, respect risk, and trade with a professional mindset. The potential for massive returns is real—but only for the disciplined few.

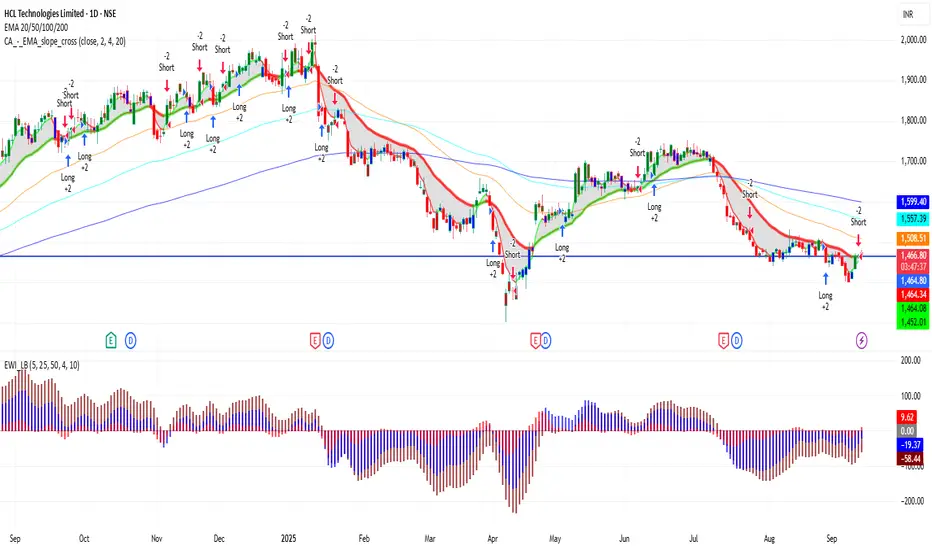
HCLTECH 1D Time frame🔢 Current Level
Trading around ₹1,465 – ₹1,470
🔑 Key Resistance & Support Levels
Resistance Zones:
₹1,476 – ₹1,480 (near-term resistance; breakout above this may lead to further upside)
₹1,494 – ₹1,520 (stronger resistance above)
Support Zones:
₹1,460 – ₹1,463 (immediate support; failure to hold above this may lead to a decline)
₹1,450 – ₹1,460 (short-term support; a break below this could indicate weakness)
₹1,431 – ₹1,440 (deeper support zone if price dips further)
📉 Outlook
Bullish Scenario: If HCL Technologies holds above ₹1,463, upward momentum may continue. Break above ₹1,480 can open the way toward ₹1,494 – ₹1,520.
Bearish Scenario: If it falls below ₹1,450, risk increases toward ₹1,431 – ₹1,440.
Neutral / Range: Between ₹1,463 – ₹1,480, HCL Technologies may consolidate before a directional move.
NIFTY 1D Time frame📊 Current Snapshot
Current Price: ₹25,022.20
Day’s Range: ₹24,973.00 – ₹25,035.00
Previous Close: ₹24,976.10
Opening Price: ₹24,991.00
Volume: Moderate
📈 Trend & Indicators
Trend: Neutral to mildly bullish; trading near short-term resistance.
RSI (14): Neutral zone.
MACD: Positive → indicating mild bullish momentum.
Moving Averages: Short-term averages indicate neutral to slightly bullish outlook.
🔮 Outlook
Bullish Scenario: Break above ₹25,050 with strong volume could target ₹25,100.
Bearish Scenario: Drop below ₹24,950 may lead to further decline toward ₹24,900.
Neutral Scenario: Consolidation between ₹24,950 – ₹25,050; breakout needed for directional move.
📌 Key Factors to Watch
Economic Indicators: Interest rates, inflation, and RBI policy updates.
Sector Performance: Trends in the IT and financial sectors.
Global Cues: Global market trends, US indices, crude oil, and currency movements.

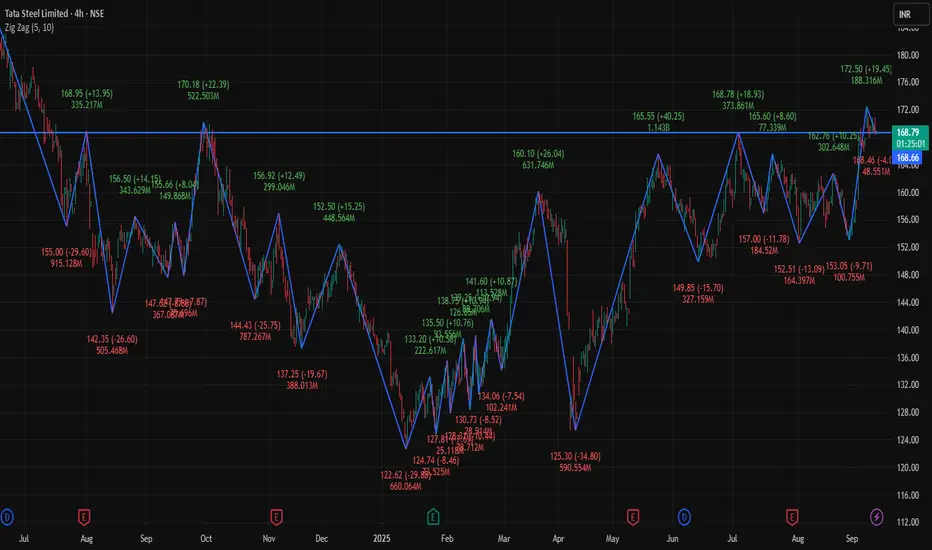
TATASTEEL 4H 📊 Current Snapshot
Current Price: ₹169.43
Day’s Range: ₹168.46 – ₹170.90
Previous Close: ₹169.43
Opening Price (4H): ₹169.35
📈 Trend & Indicators
Trend: Neutral to mildly bullish; trading near 50-hour and 200-hour moving averages.
RSI (14): Neutral zone.
MACD: Positive → indicating mild bullish momentum.
Moving Averages: Short-term averages indicate neutral to slightly bullish outlook.
🔮 Outlook
Bullish Scenario: Break above ₹170.90 with strong volume could target ₹172.50.
Bearish Scenario: Drop below ₹168.50 may lead to further decline toward ₹167.99.
Neutral Scenario: Consolidation between ₹168.50 – ₹170.90; breakout needed for directional move.
📌 Key Factors to Watch
Economic Indicators: Interest rates, inflation, and RBI policy updates.
Sector Performance: Trends in the metals and mining sectors.
Global Cues: Global market trends, US indices, crude oil, and currency movements.
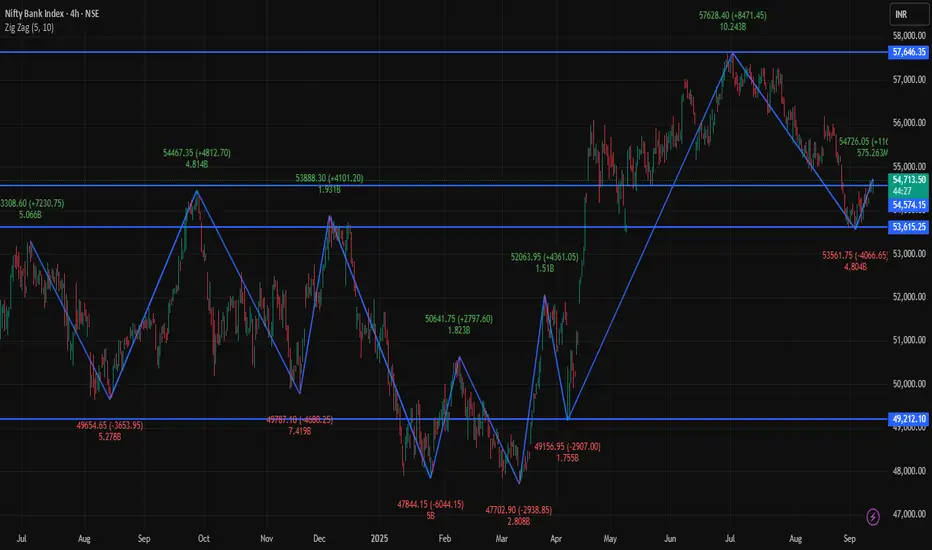
BANKNIFTY 4H Time frameCurrent Snapshot
Current Price around: ₹54,713 - ₹54,600
Day’s Range (4H): ₹54,400 – ₹54,705
Previous Close: ₹54,216
Opening Price (4H): ₹54,554
Volume: Moderate
🔑 Key Support & Resistance Levels
Immediate Support: ₹54,550
Next Support: ₹54,400
Immediate Resistance: ₹54,705
Next Resistance: ₹55,000
📈 Trend & Indicators
Trend: Mildly bullish; trading around 50-hour moving average.
RSI (14): 62 – Neutral to slightly bullish.
MACD: Positive → indicating mild bullish momentum.
Moving Averages: Short-term averages indicate neutral to slightly bullish bias.
🔮 Outlook
Bullish Scenario: Sustained move above ₹54,705 may push toward ₹55,000.
Bearish Scenario: Drop below ₹54,550 could bring a retracement to ₹54,400.
Neutral Scenario: Consolidation between ₹54,550 – ₹54,705; breakout needed for directional move.
📌 Key Factors to Watch
Performance of major banking stocks in BANKNIFTY.
Economic indicators such as interest rates and RBI policy updates.
Global market cues including US indices, crude oil, and currency movements.
SBIN 1H Time framePrice Snapshot
Current price around : ~ ₹818
52-week high/low: ~ ₹875 / ₹680
Recent price action: modest upside from support, but resistance overhead
📈 Indicators & Momentum (Hourly Approx)
Moving Averages (short-period) are just below current price → giving support
Medium/longer hourly MAs (20-50 hr) are above → resistance zones
RSI (1-hour): neutral to slightly bullish, not overbought yet
Momentum indicators show mild strength but not a breakout — watching for volume to confirm
🧭 Short-Term Outlook
Bullish scenario: If SBI holds above ~₹820 and breaks past ~₹825-830, upward target could be ~₹840+
Bearish scenario: If it loses support around ~₹805-810, risk of pullback toward ~₹800 or below
Bias: Slightly bullish in the short term, provided support holds and resistance tests are successful

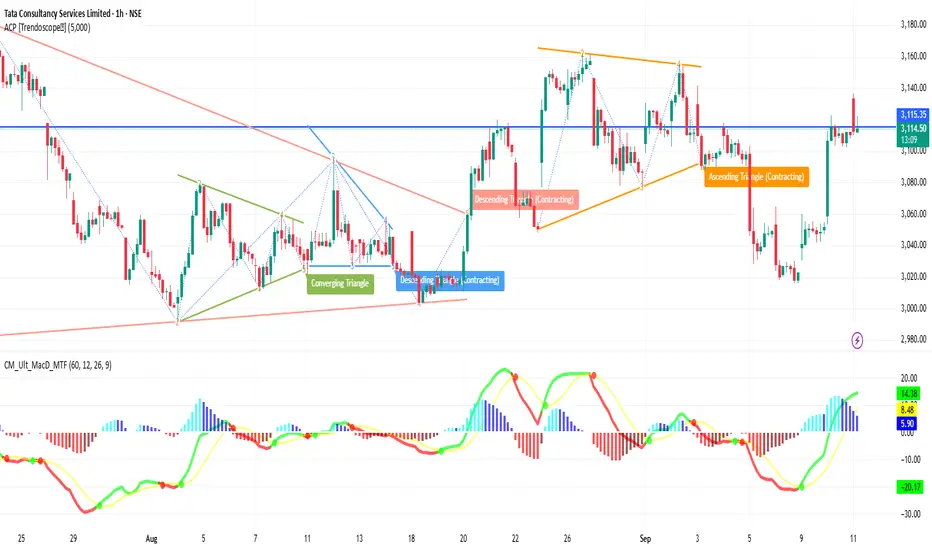
TCS 1H Time frameTCS 1-Hour Snapshot
Price is around ₹3,110
Showing small gains in recent sessions
Has been under pressure from broader IT sector weakness, but holding above some short-term support
🔎 Technical Indicators & Trend
Moving Averages (short-term hourly) are slightly below current price → providing support
Medium-term MAs (50-hour etc.) are above → resistance overhead
RSI (hourly) is moderately neutral—neither strongly overbought nor oversold
Trend strength appears modest; no sharp momentum bars or volume spikes indicating breakout
🔧 Support & Resistance Levels (1H)
Support: ~₹3,080–₹3,090 first support zone
Resistance: ~₹3,130–₹3,140 nearby resistance
🧭 Short-Term Outlook
Bullish Case: A break above ~₹3,130-3,140 with volume could push toward ~₹3,160
Bearish Case: If it fails to break resistance and drops below ~₹3,090, possible move toward ~₹3,060
Overall Bias: Slightly bullish to neutral; waiting for confirmation from resistance breakout
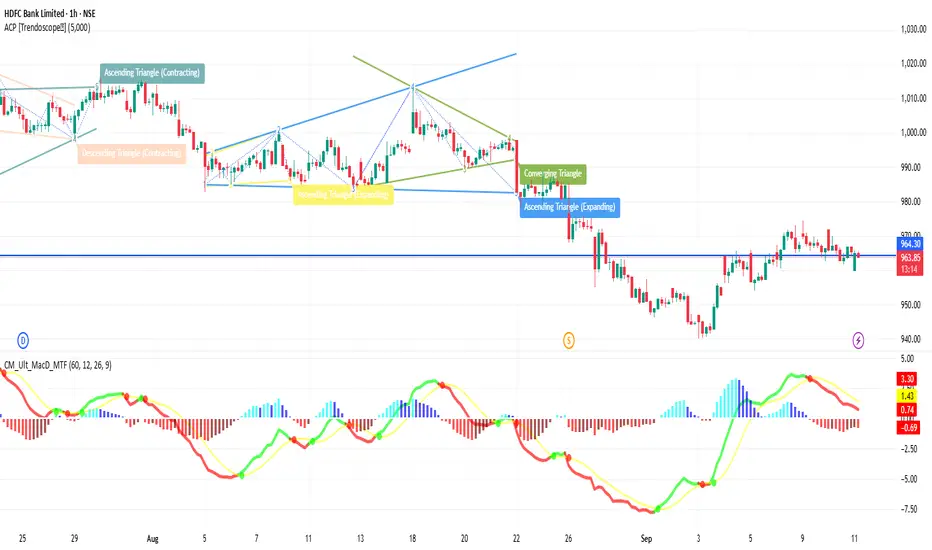
HDFCBANK 1H Time frameKey Price & Market Info
Current Price: ~ ₹960-965
52-Week Range: ~ ₹806 – ₹1,018
Daily Range (recent): roughly between ₹959 – ₹966
🔎 Technical Indicators & Momentum
RSI (14-hour): ~ 42-45 → Neutral to mildly weak
MACD (hourly estimates): Slightly negative → some bearish pressure
ADX (trend strength): Moderate (~20-25) → trend is present but not very strong
Moving Averages:
Short-term (5-10 hour) MAs seem to be acting as minor resistance/support zones near current price
Mid-term MAs (50-hour) are above the price → resistance upward
Long-term support (200-hour MA) is well below current price → that gives some downside cushion
🔧 Support & Resistance (1-Hour)
Immediate Resistance: ~ ₹970-975
Near Resistance Zone: ~ ₹985-₹990
Support Levels: ~ ₹950-₹955 first, then ~₹940 if weakness increases
🧭 Short-Term Outlook
Bullish Case: If price breaks above ~₹970-975 with volume, upward move toward ~₹985+ might be possible.
Bearish Case: Failing resistance and dropping below ~₹950 might test lower support ~₹940.
Overall Bias: Slightly bearish to neutral—more inclined to expect consolidation or minor pullback unless strong upward catalyst appears.
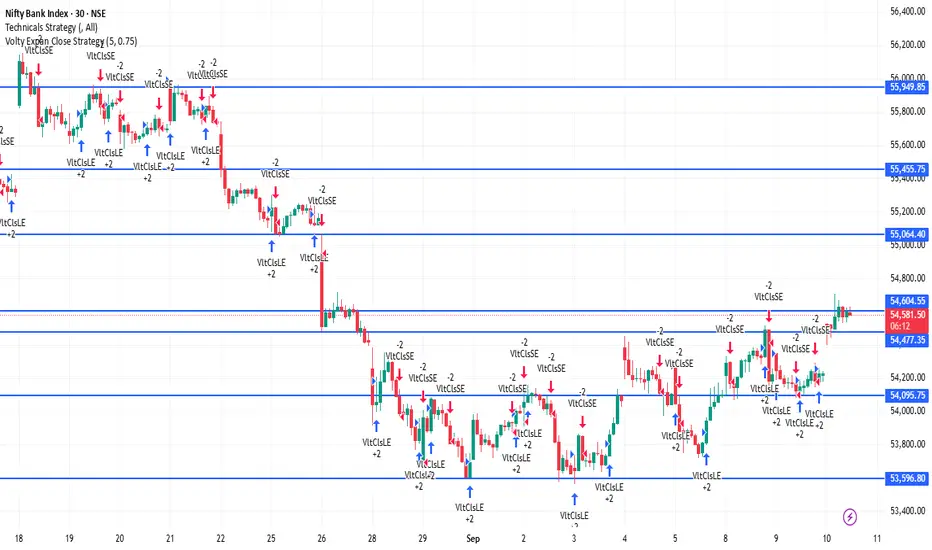
BANKNIFTY 30 Minutes Time frame Bank Nifty (30-Minute Timeframe Snapshot, 10 Sept 2025 ~12:30 PM IST)
Current Level: Around 54,615 – 54,620
Change: Up roughly +400 points (+0.7% approx.) compared to yesterday’s close
Key Pivot Levels (30-min basis)
Pivot: 54,215
Resistance Levels:
R1: 54,351
R2: 54,487
R3: 54,623
Support Levels:
S1: 54,080
S2: 53,944
S3: 53,809
✅ In short: Bank Nifty is trading strongly above its pivot (54,215) and is hovering close to R3 (54,623) on the 30-minute chart, showing bullish momentum.
Emerging Sectors in India1. Information Technology & Digital Economy
India’s IT sector has been the backbone of its global image for decades. But the story is evolving. It’s no longer just about outsourcing or call centers; today, India is building entire digital ecosystems. Cloud computing, SaaS (Software as a Service), big data analytics, and cybersecurity are driving a new phase of IT growth.
The adoption of 5G, Artificial Intelligence (AI), and Internet of Things (IoT) is expanding opportunities for IT firms. With global businesses increasingly looking for digital transformation partners, Indian IT companies like Infosys, TCS, Wipro, and HCL are evolving from service providers into strategic partners.
Moreover, India’s digital economy is expected to reach $1 trillion by 2030, with growth driven by digital payments, e-commerce, and digital infrastructure.
2. Fintech & Digital Payments
India has become a global leader in digital payments. The success of UPI (Unified Payments Interface) is a case study for the world, processing billions of transactions every month. Startups like PhonePe, Paytm, BharatPe, and Razorpay are revolutionizing how money moves across the economy.
Beyond payments, fintech innovation includes:
Digital lending platforms
Insurtech solutions
WealthTech & robo-advisory
Blockchain-based financial services
Government initiatives like Jan Dhan Yojana, Digital India, and financial inclusion policies have enabled fintech adoption even in rural India. By 2030, India’s fintech industry could surpass $200 billion in revenues.
3. E-commerce & Online Marketplaces
E-commerce is one of the fastest-growing consumer-facing sectors. With the world’s largest youth population and rising internet penetration, platforms like Amazon, Flipkart, Meesho, and Nykaa are driving a retail revolution.
Key drivers:
Growing middle-class consumption
Rapid adoption of online grocery & fashion retail
Expansion of logistics and supply chain tech
Rise of social commerce & direct-to-consumer (D2C) brands
By 2030, India’s e-commerce market is projected to reach $350–400 billion, making it the third-largest in the world after China and the US.
4. Electric Vehicles (EVs) & Green Mobility
India’s transportation sector is undergoing a green transformation. With rising pollution levels and energy dependence on oil imports, electric mobility has become a national priority.
Key developments:
Government subsidies under FAME (Faster Adoption and Manufacturing of Hybrid and Electric Vehicles)
PLI scheme for EV batteries
Entry of global players like Tesla (expected)
Domestic innovation by Ola Electric, Ather Energy, and Tata Motors
EV adoption in two-wheelers, buses, and delivery fleets is picking up faster than passenger cars, given India’s cost-sensitive market. By 2030, EVs could form 30% of all vehicle sales in India.
5. Renewable Energy & Clean Tech
India is one of the world’s largest consumers of energy. To reduce fossil fuel dependency, the government has set ambitious renewable energy targets: 500 GW of renewable capacity by 2030.
Solar and wind power dominate, but new areas like green hydrogen, battery storage, and waste-to-energy are gaining attention. Companies like Adani Green, ReNew Power, and NTPC are spearheading massive renewable projects.
With global ESG (Environmental, Social, Governance) investments rising, India’s renewable energy sector could attract trillions in foreign investment over the next two decades.
6. Biotechnology & Healthcare Innovation
India’s pharmaceutical industry is already known as the “pharmacy of the world”, but biotechnology and healthcare innovation are expanding the sector further.
Emerging areas:
Gene therapy and personalized medicine
Biotechnology in agriculture and food security
Telemedicine and digital health platforms
Medical devices and diagnostics
Startups in health-tech (Practo, 1mg, PharmEasy) are bridging gaps in healthcare access. With rising health awareness and global demand, India’s biotech industry could reach $150 billion by 2025.
7. EdTech (Education Technology)
India has one of the largest student populations in the world, creating huge demand for quality education. EdTech platforms like Byju’s, Unacademy, Vedantu, and PhysicsWallah are transforming how students learn.
Key innovations:
Live online classes
AI-based personalized learning
Skill development & upskilling platforms
AR/VR-based immersive education
Though growth slowed after the pandemic boom, long-term demand for hybrid and skill-focused education will keep EdTech a strong emerging sector.
8. Agritech & Food Processing
Agriculture still employs 40% of India’s workforce, but productivity is low. Agritech startups are using AI, IoT, blockchain, and drones to modernize farming.
Examples:
DeHaat, Ninjacart (farm-to-market supply chains)
Stellapps (dairy tech)
AgroStar (input advisory & marketplace)
Meanwhile, food processing is gaining momentum, with India moving from raw produce to value-added exports. This sector could generate millions of jobs and boost farmers’ income significantly.
9. Space Technology & Satellite Services
India’s space sector, led by ISRO, is opening up to private players. With the success of Chandrayaan-3 and Aditya-L1, global attention is on India’s space tech.
Private startups like Skyroot, Agnikul Cosmos, and Pixxel are innovating in satellite launch services, earth observation, and space-based applications.
The government’s IN-SPACe policy and privatization efforts could turn India into a global hub for affordable space technology.
10. Artificial Intelligence, Robotics & Automation
AI and automation are transforming multiple industries, from finance to healthcare to manufacturing. India’s AI market is expected to reach $17 billion by 2027.
Applications include:
AI in customer service (chatbots, voice assistants)
Robotics in manufacturing and logistics
AI-driven medical imaging
Smart cities and predictive governance
Indian IT and startups are actively adopting AI tools, with government initiatives supporting skill development in this field.
Conclusion
India stands at a historic crossroads. The emerging sectors described above are not just industries – they represent the aspirations of a young, ambitious nation aiming for global leadership. With strong policy support, rapid digital adoption, and entrepreneurial energy, India is building the foundations of a $5–10 trillion economy.
While challenges remain, the direction is clear: India’s growth story will be powered by emerging sectors that combine innovation, sustainability, and inclusivity.

TVSMOTOR 1D Time frame📍 TVSMOTOR – 1D Important Levels (Current)
🔹 Support Zones
2,050 – 2,070 → Immediate daily support
1,980 – 2,000 → Strong support zone; buyers expected here
1,900 – 1,920 → Major support; breakdown here may shift trend bearish
🔹 Resistance Zones
2,120 – 2,140 → Immediate daily resistance
2,180 – 2,200 → Strong resistance; breakout can extend momentum
2,250 – 2,280 → Major resistance; if crossed, bullish trend strengthens
⚖️ Daily Trend Outlook
TVSMOTOR is in a sideways-to-bullish structure on the daily chart.
As long as price holds above 2,050, momentum remains positive.
A breakout above 2,140 – 2,200 could push price towards 2,250 – 2,280.
A breakdown below 2,050 may drag it down to 2,000 – 1,920.

TATAMOTOR 1H Tata Motors – 1 Hour Chart Analysis
🔹 Trend Overview
On the 1-hour chart, Tata Motors is currently showing bullish momentum with higher highs and higher lows.
However, price is also facing some resistance near the upper range, so intraday swings are possible.
🔹 Key Levels to Watch
Immediate Support Zone: around ₹706 – ₹709
Stronger Support: near ₹700
Immediate Resistance Zone: around ₹717 – ₹721
Major Resistance: around ₹734 – ₹735
🔹 Intraday Trading View
If price holds above ₹709, bulls may push towards ₹721 – ₹734.
If price slips below ₹706, a retest of ₹700 – ₹695 is possible.
Consolidation is likely in the ₹709 – ₹721 range before any major breakout.
🔹 Indicators (1-Hour Chart)
Moving Averages → Price trading above 20 EMA and 50 EMA, showing short-term strength.
RSI → Near the 60–65 zone, still bullish but close to overbought.
Volume → Slightly increasing on up-moves, showing buyers are active.
🔹 Summary
Bias: Bullish to range-bound
Support Levels: ₹706 / ₹700
Resistance Levels: ₹721 / ₹734
Intraday traders should watch the ₹709 – ₹721 band for breakout or breakdown trades.
