Part 2 Candlestick PatternBasics of Options Contracts
To truly understand options, let’s break down the core components.
What is an Option?
An option is a contract that gives the buyer the right, but not the obligation, to buy or sell an underlying asset at a predetermined price (strike price) on or before a specified date (expiry date).
The buyer of the option pays a price called the premium.
The seller (or writer) of the option receives this premium and takes on the obligation.
Types of Options
Call Option – Gives the buyer the right to buy the underlying asset at the strike price.
Example: You buy a call on Reliance at ₹2500 strike price. If Reliance moves to ₹2700 before expiry, you can buy at ₹2500 and profit.
Put Option – Gives the buyer the right to sell the underlying asset at the strike price.
Example: You buy a put on Infosys at ₹1500. If Infosys falls to ₹1400, you can sell at ₹1500 and profit.
Key Terms in Options
Strike Price: The price at which the option can be exercised.
Premium: The cost of the option (paid by buyer, received by seller).
Expiry Date: The date when the option contract ends.
Lot Size: Options are traded in lots, not single units. For example, one NIFTY option lot = 50 units.
Moneyness:
In the Money (ITM): Option has intrinsic value.
At the Money (ATM): Strike price = current price.
Out of the Money (OTM): Option has no intrinsic value.
American vs European Options
American Options: Can be exercised any time before expiry.
European Options: Can be exercised only on expiry.
(India primarily uses European-style options.)
Zomato

Technical Analysis Foundations1. Historical Background of Technical Analysis
Early Origins
Japanese Rice Trading (1700s): Candlestick charting was developed by Munehisa Homma, a rice trader, who discovered that market psychology and patterns could predict future prices.
Charles Dow (Late 1800s): Considered the father of modern technical analysis, Dow developed the Dow Theory, which laid the groundwork for trend analysis.
Evolution in the 20th Century
With the rise of stock exchanges in the U.S. and Europe, charting methods gained popularity.
The creation of indicators like Moving Averages, RSI, MACD, and Bollinger Bands in the mid-20th century expanded the technical toolkit.
Modern Era
Today, technical analysis is powered by computers, algorithms, and AI-based models.
Despite these advances, the core principle remains the same: history tends to repeat itself in markets.
2. Core Principles of Technical Analysis
Technical analysis is built on three central assumptions:
Price Discounts Everything
Every factor—economic, political, psychological—is already reflected in price.
Traders don’t need to analyze external events; studying price is enough.
Prices Move in Trends
Markets don’t move randomly. Instead, they form trends—uptrend, downtrend, or sideways.
Identifying and following the trend is the foundation of profitable trading.
History Repeats Itself
Human behavior in markets tends to repeat due to psychology (fear, greed, hope).
Chart patterns like Head & Shoulders or Double Tops repeat because investor reactions are consistent over time.
3. Types of Charts
Charts are the backbone of technical analysis. The three most commonly used chart types are:
1. Line Chart
Simplest chart, connecting closing prices with a line.
Best for long-term trend analysis.
2. Bar Chart
Displays open, high, low, and close (OHLC) in each bar.
Provides more detail than line charts.
3. Candlestick Chart
Invented in Japan, now the most popular.
Each candlestick shows open, high, low, and close with a body and wicks.
Offers visual insight into market psychology (bullish vs. bearish sentiment).
4. Understanding Market Structure
1. Trends
Uptrend: Higher highs and higher lows.
Downtrend: Lower highs and lower lows.
Sideways: Price consolidates within a range.
2. Support and Resistance
Support: Price level where buying pressure overcomes selling.
Resistance: Price level where selling pressure overcomes buying.
Key to identifying entry and exit points.
3. Breakouts and Pullbacks
Breakout: Price moves beyond support or resistance with strong volume.
Pullback: Temporary retracement before the trend resumes.
5. Technical Indicators
Indicators are mathematical calculations applied to price or volume data. They are divided into two main types:
1. Trend Indicators
Moving Averages (SMA, EMA): Smooth price data to identify trend direction.
MACD (Moving Average Convergence Divergence): Measures momentum and trend strength.
2. Momentum Indicators
RSI (Relative Strength Index): Identifies overbought (>70) or oversold (<30) conditions.
Stochastic Oscillator: Compares closing price to recent highs/lows.
3. Volatility Indicators
Bollinger Bands: Show price volatility around a moving average.
ATR (Average True Range): Measures market volatility.
4. Volume Indicators
OBV (On Balance Volume): Tracks cumulative buying/selling pressure.
Volume Profile: Highlights price levels where significant trading occurred.
6. Chart Patterns
Patterns represent the psychology of market participants. They are broadly classified into continuation and reversal patterns.
1. Reversal Patterns
Head and Shoulders: Signals a trend reversal from bullish to bearish.
Double Top/Bottom: Indicates a change in trend after testing a key level twice.
2. Continuation Patterns
Flags and Pennants: Short-term consolidations within a strong trend.
Triangles (Symmetrical, Ascending, Descending): Signal breakout in the direction of trend.
3. Candlestick Patterns
Doji: Market indecision.
Hammer / Shooting Star: Potential reversal signals.
Engulfing Patterns: Strong reversal signals based on candlestick body size.
7. Volume and Market Confirmation
Volume is a critical element in technical analysis:
Rising volume confirms the strength of a trend.
Low volume during a breakout may signal a false move.
Divergence between price and volume often hints at a reversal.
8. Timeframes in Technical Analysis
Intraday (1-min, 5-min, 15-min): For day traders and scalpers.
Swing (Hourly, 4H, Daily): For medium-term traders.
Position (Weekly, Monthly): For long-term investors.
The principle of Multiple Time Frame Analysis is key: Traders often analyze higher timeframes for trend direction and lower timeframes for precise entries.
9. Market Psychology and Sentiment
Technical analysis is rooted in psychology:
Fear and Greed: Drive most market movements.
Herd Behavior: Traders follow crowds, amplifying trends.
Overconfidence: Leads to bubbles and crashes.
Sentiment indicators like VIX (Volatility Index) or Put/Call ratios are often used to gauge market mood.
10. Risk Management in Technical Analysis
No strategy works without risk control. Key principles:
Position Sizing: Risk only 1–2% of capital per trade.
Stop Loss: Predetermine exit levels to minimize loss.
Risk-Reward Ratio: Aim for trades with at least 1:2 risk-reward.
Conclusion
Technical analysis is both an art and a science. It blends mathematical tools with human psychology to understand market behavior. While it has limitations, its principles of trend, support/resistance, and pattern recognition remain timeless.
For beginners, mastering chart basics, support/resistance, and risk management is the starting point. For advanced traders, integrating multiple indicators, refining strategies, and incorporating psychology make the difference.
Ultimately, technical analysis is not about predicting the future with certainty—it’s about increasing probabilities and managing risk. With discipline and practice, it becomes a powerful tool for navigating financial markets.

Psychology of Trading1. Introduction: Why Psychology Matters in Trading
Trading is not just about buying low and selling high. It is about making decisions under uncertainty, managing risk, and dealing with constant emotional swings. Unlike traditional jobs where performance is based on effort and skills, trading has an unpredictable outcome in the short term.
You can make a perfect trade setup and still lose money.
You can make a terrible decision and accidentally profit.
This uncertainty creates emotional pressure, leading traders to make irrational decisions. For example:
Selling too early out of fear.
Holding on to losing trades hoping for a reversal.
Over-trading after a big win or loss.
Without strong psychological control, traders often repeat these mistakes. That is why understanding and mastering trading psychology is the real secret to consistent success.
2. Core Emotions in Trading
Emotions are natural, but when unmanaged, they distort judgment. Let’s break down the four main emotions every trader faces:
(a) Fear
Fear is the most common emotion in trading. It shows up in two forms:
Fear of Losing Money – leading to hesitation, missed opportunities, or premature exits.
Fear of Missing Out (FOMO) – jumping into trades too late because others are making money.
Example: A trader sees a stock rallying rapidly and buys at the top out of FOMO. When the price corrects, fear of loss makes them sell at the bottom – a classic cycle.
(b) Greed
Greed pushes traders to take excessive risks, over-leverage, or hold winning positions too long. Instead of following a plan, they chase “unlimited” profits.
Example: A trader who plans for 5% profit refuses to book at target, hoping for 10%. The market reverses, and the profit turns into a loss.
(c) Hope
Hope is dangerous in trading. While hope is positive in life, in markets it blinds traders from reality. Hope makes people hold on to losing trades, ignoring stop-losses, and believing “it will come back.”
Example: A trader buys a stock at ₹500, it falls to ₹450, then ₹400. Instead of cutting losses, the trader “hopes” for recovery and keeps averaging down, often leading to bigger losses.
(d) Regret
Regret comes after missed opportunities or wrong trades. Regret often leads to revenge trading, where traders try to quickly recover losses, usually resulting in even bigger losses.
3. Cognitive Biases in Trading
Apart from emotions, psychology is also influenced by cognitive biases – mental shortcuts that distort rational thinking.
Overconfidence Bias – Believing your strategy is always right after a few wins, leading to careless trading.
Confirmation Bias – Only looking for information that supports your view, ignoring opposite signals.
Loss Aversion – The pain of losing ₹1000 is stronger than the joy of gaining ₹1000. This makes traders hold losers and sell winners too soon.
Anchoring Bias – Relying too heavily on the first price seen, e.g., thinking “I bought at ₹600, so it must go back to ₹600.”
Herd Mentality – Following the crowd without analysis, especially during hype rallies or crashes.
These biases prevent traders from making objective decisions.
4. Mindset of a Successful Trader
Successful traders think differently from beginners. Their mindset is built on discipline, patience, and acceptance of uncertainty. Key elements include:
Process Over Outcome: Focusing on following rules, not immediate profit.
Acceptance of Losses: Treating losses as part of the business, not as personal failure.
Probabilistic Thinking: Understanding that no trade is 100% certain; trading is about probabilities.
Long-Term Focus: Avoiding the need for daily wins, instead building consistent performance over months/years.
Emotional Detachment: Viewing money as “trading capital,” not personal wealth.
5. The Role of Discipline
Discipline is the backbone of trading psychology. Without discipline, even the best strategies fail. Discipline involves:
Following a Trading Plan – entry, exit, stop-loss, risk-reward.
Position Sizing – never risking more than 1-2% of capital on a single trade.
Consistency – sticking to strategy instead of changing methods after every loss.
Patience – waiting for the right setup instead of forcing trades.
Most traders fail not because of bad strategies but because they lack the discipline to follow their strategies.
6. Psychological Challenges in Different Trading Styles
(a) Day Trading
Constant pressure, quick decisions.
High temptation to over-trade.
Emotional exhaustion.
(b) Swing Trading
Requires patience to hold trades for days/weeks.
Fear of overnight risks (gaps, news).
Temptation to check charts every hour.
(c) Long-Term Investing
Emotional difficulty in holding through corrections.
Pressure from news and market noise.
Fear of missing short-term opportunities.
Each style demands a different level of emotional control.
7. Developing Emotional Intelligence for Trading
Emotional Intelligence (EQ) is the ability to understand and manage your emotions. Traders with high EQ can:
Recognize when fear/greed is influencing them.
Pause before reacting emotionally.
Maintain objectivity under stress.
Ways to improve EQ in trading:
Journaling – Writing down emotions and mistakes after each trade.
Mindfulness & Meditation – Helps calm the mind and reduce impulsive decisions.
Detachment from Money – Viewing trades as probabilities, not personal wins/losses.
Visualization – Mentally preparing for both winning and losing scenarios.
8. Risk Management & Psychology
Risk management is not just technical – it is psychological. A trader who risks too much per trade is more likely to panic.
Risk per trade: Max 1–2% of capital.
Use stop-loss orders to remove emotional decision-making.
Diversify to avoid stress from a single bad trade.
When risk is controlled, emotions naturally reduce.
9. Common Psychological Mistakes Traders Make
Overtrading – Trading too often due to excitement or frustration.
Ignoring Stop-Losses – Driven by hope and denial.
Chasing the Market – Entering late due to FOMO.
Revenge Trading – Trying to recover losses aggressively.
Lack of Patience – Jumping in before confirmation.
Ego Trading – Refusing to accept mistakes, trying to “prove the market wrong.”
10. Building Psychological Strength
Practical steps to master trading psychology:
Create a Trading Plan – Define entry, exit, stop-loss, risk-reward.
Keep a Trading Journal – Record reasons, outcomes, and emotions of each trade.
Use Small Position Sizes – Reduce stress by lowering risk.
Practice Visualization – Prepare for losses before they happen.
Regular Breaks – Step away from screens to avoid emotional burnout.
Focus on Process, Not Profit – Judge yourself by discipline, not daily P&L.
Accept Imperfection – No trader wins all trades; consistency matters more than perfection.
Final Thoughts
The psychology of trading is the bridge between knowledge and execution. Thousands of traders know strategies, but only a few succeed because they master their emotions.
To succeed in trading:
Build discipline like a soldier.
Accept uncertainty like a scientist.
Control emotions like a monk.
In short: Trading is less about predicting markets and more about controlling yourself.
Derivatives & Options TradingPart 1: What Are Derivatives?
Definition
A derivative is a financial contract whose value depends (or is derived) from the value of an underlying asset, index, or interest rate. For example:
A wheat futures contract derives its value from wheat prices.
A stock option derives its value from the stock price of a company.
A currency forward derives its value from the exchange rate of two currencies.
Thus, derivatives do not have standalone intrinsic value—they only exist because of their relationship with something else.
History of Derivatives
Derivatives are not new. In fact, they date back thousands of years:
Ancient Greece (600 BCE): The philosopher Thales used an early version of an option contract to secure the right to use olive presses.
17th Century Japan: The Dojima Rice Exchange in Osaka was the world’s first organized futures market.
19th Century USA: The Chicago Board of Trade (CBOT) formalized futures contracts in commodities like wheat and corn.
20th Century: Derivatives expanded beyond agriculture into financial assets like stocks, bonds, and interest rates.
Today, derivatives markets are global, electronic, and worth trillions of dollars daily.
Part 2: Types of Derivatives
Derivatives can be classified into four major categories:
1. Forwards
Private agreements between two parties to buy/sell an asset at a future date at a predetermined price.
Customized and traded over-the-counter (OTC).
Example: A coffee exporter enters into a forward contract with a U.S. buyer to sell coffee at $2 per pound in six months.
2. Futures
Standardized contracts traded on exchanges.
Legally binding to buy/sell an asset at a set price and date.
Highly liquid, with margin requirements for risk management.
Example: Nifty 50 futures in India or S&P 500 futures in the U.S.
3. Options
Contracts giving the buyer the right (but not obligation) to buy or sell the underlying asset at a set price before/at expiration.
Two types:
Call Option → Right to buy.
Put Option → Right to sell.
Traded globally on exchanges like NSE (India), CME (USA), etc.
4. Swaps
Agreements to exchange cash flows, often involving interest rates or currencies.
Example: A company with floating-rate debt may enter into an interest rate swap to convert it into fixed-rate payments.
Part 3: Understanding Options in Detail
Among all derivatives, options stand out because of their flexibility, leverage, and strategic use.
1. Basic Terms
Underlying Asset: The stock, commodity, or index on which the option is based.
Strike Price: The pre-agreed price at which the option can be exercised.
Premium: The price paid by the option buyer to the seller (writer).
Expiry Date: The date on which the option contract ends.
Call Option: Right to buy the asset at the strike price.
Put Option: Right to sell the asset at the strike price.
2. Call Options Example
Suppose Reliance stock trades at ₹2,500. You buy a Call Option with a strike price of ₹2,600 expiring in 1 month.
If Reliance rises to ₹2,800, you exercise the call and buy at ₹2,600 (profit = ₹200 per share minus premium).
If Reliance falls to ₹2,400, you simply let the option expire (loss limited to premium).
3. Put Options Example
Suppose Infosys trades at ₹1,600. You buy a Put Option with strike price ₹1,550.
If Infosys drops to ₹1,400, you sell at ₹1,550 (profit = ₹150 minus premium).
If Infosys rises above ₹1,550, you let it expire.
4. Option Writers (Sellers)
Unlike buyers, sellers have obligations.
Call Writer: Must sell at strike price if buyer exercises.
Put Writer: Must buy at strike price if buyer exercises.
Writers earn the premium but face unlimited risk if the market moves against them.
Part 4: Option Pricing
Options pricing is complex because it depends on several factors. The most widely used model is the Black-Scholes Model, but conceptually:
Factors Affecting Option Premium:
Spot Price of Underlying – Higher stock price increases call premium, decreases put premium.
Strike Price – Closer strike to market price = higher premium.
Time to Expiry – More time = more premium.
Volatility – Higher volatility increases both call & put premiums.
Interest Rates & Dividends – Minor impact but factored in.
This combination of variables explains why options are dynamic instruments requiring constant analysis.
Part 5: Options Trading Strategies
Options are not only used for speculation but also for hedging and generating income.
1. Hedging
Example: An investor holding Infosys stock can buy a put option to protect against downside.
2. Speculation
Traders can bet on price direction with limited risk.
Example: Buying a call option before earnings announcement.
3. Income Generation
Option writers earn premiums by selling covered calls or puts.
Popular Option Strategies:
Covered Call – Holding stock + selling call option to earn premium.
Protective Put – Buying stock + buying put for downside protection.
Straddle – Buying both call & put at same strike → betting on volatility.
Strangle – Buying out-of-the-money call & put → cheaper volatility play.
Butterfly Spread – A limited-risk, limited-reward strategy based on three strikes.
Iron Condor – Popular income strategy using four legs (two calls + two puts).
These strategies allow traders to profit not only from direction but also from volatility and time decay.
Part 6: Risks in Derivatives & Options
While derivatives are powerful, they come with risks.
1. Market Risk
Prices can move unpredictably, leading to heavy losses.
2. Leverage Risk
Small moves in underlying can cause big gains/losses due to leverage.
3. Liquidity Risk
Some derivatives may be illiquid, making exit difficult.
4. Counterparty Risk
In OTC contracts, one party may default. (Exchanges reduce this via clearing houses).
5. Complexity Risk
Beginners may misunderstand how pricing works, especially with options.
This is why regulators like SEBI (India) and CFTC (USA) impose margin requirements and position limits.
Part 7: Global Derivatives Markets
Major Hubs
CME Group (USA): Largest derivatives exchange, trades in futures & options.
Eurex (Europe): Known for interest rate and equity derivatives.
NSE (India): World leader in options trading volume, especially index options.
SGX (Singapore): Popular for Asian index derivatives.
Indian Derivatives Market
Launched in 2000 with Nifty futures.
Now among the top in the world by volume.
Products include index futures, stock futures, index options, stock options, and currency derivatives.
Part 8: Real-World Applications
Hedging:
Farmers hedge crop prices with futures.
Importers hedge currency risk with forwards.
Investors hedge stock portfolios with index options.
Speculation:
Traders use leverage to profit from short-term moves.
Options allow betting on volatility.
Arbitrage:
Taking advantage of mispricing between spot and derivatives markets.
Example: Cash-futures arbitrage.
Portfolio Management:
Funds use derivatives to reduce volatility and enhance returns.
Part 9: Benefits of Derivatives & Options
Risk Management: Hedge against uncertainty.
Leverage: Control large positions with small capital.
Flexibility: Profit from direction, volatility, or even time decay.
Liquidity: Highly traded instruments (especially index options).
Price Discovery: Futures help determine fair value of assets.
Part 10: Risks & Criticism
Despite benefits, derivatives have faced criticism:
They were central in the 2008 Global Financial Crisis (credit default swaps).
Excessive speculation can destabilize markets.
High leverage magnifies losses.
Warren Buffett famously called derivatives “financial weapons of mass destruction” if misused.
Conclusion
Derivatives and options trading represent one of the most fascinating and powerful segments of financial markets. From their ancient roots in agricultural trade to their modern dominance in global finance, derivatives play a crucial role in hedging, speculation, and arbitrage.
Options, in particular, offer unmatched flexibility by allowing traders to design strategies suited to bullish, bearish, or neutral market conditions. However, with this power comes complexity and risk.
For investors and traders, the key lies in education, discipline, and risk management. Derivatives can either safeguard portfolios and create wealth—or, if misused, lead to catastrophic losses.
Thus, mastering derivatives and options trading is less about chasing quick profits and more about understanding risk, probability, and strategy in a dynamic market environment.
Basics of Financial Markets1. What are Financial Markets?
A financial market is a marketplace where financial instruments are created, bought, and sold. Unlike physical markets where goods are exchanged, financial markets deal with monetary assets, securities, and derivatives.
Key Characteristics:
Medium of Exchange – Instead of physical goods, money, credit, or securities are exchanged.
Standardized Instruments – Financial contracts such as stocks or bonds are standardized and legally binding.
Liquidity – Markets allow participants to buy or sell instruments quickly without drastically affecting prices.
Transparency – Prices and information are accessible, which reduces uncertainty.
Regulation – Most markets are regulated to ensure fairness, prevent fraud, and protect investors.
2. Why Do Financial Markets Exist?
The need for financial markets arises because of the following:
Capital Allocation – They help direct savings to businesses and governments that need funds.
Price Discovery – Markets determine the fair value of financial instruments through supply and demand.
Liquidity Provision – Investors can easily enter or exit positions.
Risk Management – Derivative markets allow participants to hedge against risks like currency fluctuations, interest rates, or commodity prices.
Efficient Resource Use – They reduce transaction costs and make capital flow more efficient across the economy.
3. Types of Financial Markets
Financial markets are broadly classified into several categories:
(a) Capital Market
Capital markets deal with long-term securities such as stocks and bonds. They are subdivided into:
Primary Market – Where new securities are issued (e.g., IPOs).
Secondary Market – Where existing securities are traded among investors (e.g., stock exchanges).
(b) Money Market
This is the market for short-term funds, usually less than one year. Instruments include:
Treasury bills
Commercial paper
Certificates of deposit
Repurchase agreements
Money markets are crucial for liquidity management by banks, companies, and governments.
(c) Foreign Exchange Market (Forex)
The largest and most liquid market in the world, where currencies are traded. Daily turnover exceeds $7 trillion globally. Forex enables:
International trade settlement
Speculation
Hedging currency risks
(d) Derivatives Market
These markets trade instruments that derive their value from underlying assets like stocks, bonds, commodities, or indices. Key instruments include:
Futures
Options
Swaps
Forwards
(e) Commodity Market
These markets allow the trade of raw materials such as oil, gold, silver, coffee, wheat, and natural gas. They play a vital role in price discovery and hedging for producers and consumers.
(f) Insurance and Pension Markets
Though sometimes overlooked, insurance and pension funds form part of financial markets as they pool resources and invest in capital markets to provide long-term returns.
4. Major Participants in Financial Markets
(a) Individual Investors
Ordinary people investing in stocks, bonds, mutual funds, or retirement accounts.
(b) Institutional Investors
Pension funds
Hedge funds
Insurance companies
Mutual funds
They often have large capital and dominate trading volumes.
(c) Corporations
Issue stocks and bonds to raise capital for growth and expansion.
(d) Governments
Issue treasury securities to finance deficits and manage national debt.
(e) Central Banks
Influence interest rates, liquidity, and currency stability. For example, the Federal Reserve (US) or RBI (India).
(f) Brokers and Dealers
Middlemen who facilitate transactions.
(g) Regulators
Organizations like SEBI (India), SEC (US), or FCA (UK) ensure fair practices, transparency, and investor protection.
5. Financial Instruments
Financial instruments are contracts that represent monetary value. Broadly divided into:
(a) Equity Instruments
Shares or stocks represent ownership in a company.
Provide dividends and capital appreciation.
(b) Debt Instruments
Bonds, debentures, or loans represent borrowing.
Fixed income with lower risk compared to equities.
(c) Hybrid Instruments
Convertible bonds
Preference shares (mix of equity and debt features)
(d) Derivatives
Contracts like futures and options used for speculation or hedging.
(e) Foreign Exchange Instruments
Spot transactions, forwards, swaps.
6. Functions of Financial Markets
Mobilization of Savings – Channels savings into investments.
Efficient Allocation of Resources – Ensures capital flows where it is most productive.
Liquidity Creation – Enables quick conversion of assets to cash.
Price Discovery – Determines fair asset prices.
Risk Management – Through diversification and hedging.
Economic Growth Support – Facilitates industrial expansion and infrastructure building.
7. Primary vs. Secondary Market
Primary Market
New securities are issued.
Example: An IPO of a company.
Investors buy directly from the issuer.
Secondary Market
Existing securities are traded among investors.
Example: Buying shares of TCS on NSE.
Prices are driven by demand and supply.
Both markets are essential – the primary market raises fresh funds, while the secondary market ensures liquidity.
8. Global Financial Markets
Financial markets today are interconnected. Events in one region impact others through global capital flows.
US markets (NYSE, NASDAQ) dominate equity trading.
London is a hub for forex trading.
Asia (Tokyo, Shanghai, Hong Kong, Singapore, Mumbai) is rising as a global financial powerhouse.
Globalization and technology have made markets operate 24/7, with information spreading instantly.
9. Role of Technology in Financial Markets
Technology has revolutionized finance:
Online trading platforms allow individuals to trade from anywhere.
Algo & High-Frequency Trading execute orders in microseconds.
Blockchain & Cryptocurrencies (Bitcoin, Ethereum) are creating new asset classes.
Fintech Innovations like robo-advisors, digital wallets, and payment banks are reshaping finance.
10. Risks in Financial Markets
Despite benefits, markets involve risks:
Market Risk – Loss due to price movements.
Credit Risk – Default by borrowers.
Liquidity Risk – Inability to sell assets quickly.
Operational Risk – Failures in processes, systems, or fraud.
Systemic Risk – Collapse of one institution affecting the entire system (e.g., 2008 crisis).
Conclusion
Financial markets are complex yet fascinating ecosystems that drive global economic growth. They connect savers with borrowers, facilitate price discovery, provide liquidity, and enable risk management. For individuals, they offer opportunities to grow wealth, while for nations, they are vital for development and stability.
Understanding the basics of financial markets is not just about investing—it’s about grasping how economies function in a globalized, interconnected world. With technological advancements and evolving regulations, financial markets will continue to transform, creating both opportunities and challenges for future generations.

Part 8 Trading Masterclass With ExpertsReal-Life Example – Hedging a Portfolio
Suppose you hold ₹5,00,000 worth of Indian equities. You worry about a market correction. Instead of selling your holdings, you buy Nifty Put Options as insurance.
Nifty at 20,000
You buy Put Option at Strike 19,800, Premium = 200 × 50 lot = ₹10,000.
If Nifty falls to 19,000:
Put gains = (19,800 – 19,000) × 50 = ₹40,000
Your portfolio loss is partially offset by option profit.
This is how professionals use options for protection.
Psychological Aspects of Options Trading
Options trading is as much about mindset as knowledge:
Stay disciplined. Don’t chase every trade.
Accept losses—they’re part of the game.
Avoid greed—taking profits early is better than losing them later.
Learn patience—sometimes the best trade is no trade.
Options trading is a powerful tool in the world of financial markets. For beginners, it may look overwhelming, but once broken down into clear concepts, options are simply another way to express your view on the market. Whether you want to speculate, hedge, or generate income, options offer flexibility that stocks alone cannot match.
The key for beginners is education + risk management + practice. Start small, learn continuously, and slowly expand your strategies. Over time, you’ll realize that options aren’t scary—they’re opportunities waiting to be unlocked.
With the right approach, options trading can transform your trading journey, making you not just a participant in the markets, but a smart strategist who uses every tool available.

Part 7 Trading Masterclass With ExpertsMistakes Beginners Make
Ignoring Time Decay: Many beginners buy out-of-the-money options and lose money as they expire worthless.
Over-Leverage: Betting too much on one trade.
Lack of Exit Plan: Holding options till expiry without managing risk.
Not Understanding Greeks: Greeks (Delta, Theta, Vega, Gamma) explain option movements.
Following Tips Blindly: Always research, don’t rely on random market tips.
The Greeks – A Beginner’s View
Delta: Measures sensitivity of option price to stock price changes.
Theta: Measures time decay.
Vega: Measures sensitivity to volatility.
Gamma: Measures change in delta.
While beginners don’t need to master Greeks immediately, having a basic awareness helps in making smarter trades.
Roadmap to Becoming a Skilled Options Trader
Start with Education: Learn basics before trading.
Paper Trade: Practice without real money.
Begin Small: Trade with limited capital.
Focus on Risk Management: Never risk more than 1–2% of your capital per trade.
Keep a Trading Journal: Record every trade, analyze mistakes.
Gradually Explore Strategies: Start with buying calls/puts, then move to spreads, covered calls, and advanced strategies.
Stay Updated: Market news, volatility, and earnings impact options heavily.

Part 6 Learn Institutional Trading Factors Affecting Option Prices
Option premiums are influenced by multiple factors:
Underlying Price: Moves directly impact intrinsic value.
Time to Expiry: Longer duration = higher premium (more time value).
Volatility: Higher volatility = higher premium (more uncertainty).
Interest Rates & Dividends: Minor factors but can influence pricing.
The famous Black-Scholes Model is often used to calculate theoretical option prices.
Basic Option Strategies for Beginners
Here are some simple strategies you can start with:
1. Buying Calls
Use when you expect the stock/index to rise.
Risk: Premium loss.
Reward: Unlimited upside.
2. Buying Puts
Use when you expect the stock/index to fall.
Risk: Premium loss.
Reward: Significant downside profits.
3. Covered Call
Own a stock + Sell a call option on it.
Generates income but caps upside.
4. Protective Put
Buy stock + Buy a put option.
Acts like insurance for your stock portfolio.
5. Straddle (Advanced Beginner)
Buy a call and put with the same strike and expiry.
Profits from big moves in either direction.
Risk: Both premiums lost if market stays flat.

ETH–USD 2 Hour ViewEthereum vs USD — 2-Hour Timeframe Levels
You asked for key price levels on a 2-hour chart. While I can't generate live 2-hour chart data here, I can share recent technical insights with support and resistance levels, plus your current price context.
⏺ Key Technical Levels (as of early September 2025):
Support Zones:
$4,360 — initial support area
$4,315 — next downside level
Below that: $4,260 and $4,220 are cited as further downside supports
Resistance Zones:
$4,500 — key resistance, blockage for current rally
If surpassed: $4,520 and $4,555 are possible next targets
Extended resistance: up to $4,620, then $4,660 or even $4,720 if momentum builds
Mid-range / Technical Sentiment:
Recent consolidation between $4,350–$4,450, holding above the 100-hour SMA with rebound potential
Daily chart structure remains bullish as long as ETH stays above $4,000; a breakdown below that could weaken structure
Next Steps for You:
Use a charting platform (e.g., TradingView) with a 2-hour timeframe and apply horizontal lines at these zones.
Watch for price action: Does ETH bounce at support? Does it stall or break through resistance? Candlestick patterns and volume around these levels help refine entries/exits.
Play momentum: Watch aggressiveness above $4,500 with targets at $4

Algo & Quant Trading in IndiaIntroduction
Financial markets worldwide have witnessed a paradigm shift in the last two decades. Traditional trading, which once relied heavily on manual execution, intuition, and gut feeling, has now given way to sophisticated, technology-driven strategies. In India, this transformation has been especially visible with the rise of Algorithmic (Algo) Trading and Quantitative (Quant) Trading.
Algo trading refers to the use of computer programs that follow a defined set of instructions (algorithms) to place trades automatically. Quant trading, on the other hand, is rooted in mathematical, statistical, and computational models to identify trading opportunities. While the two often overlap, quant strategies form the brain of the model, and algos are the execution engine.
In India, the growth of algo and quant trading is not just a reflection of global trends, but also a product of domestic factors like regulatory changes, increased market participation, rapid digitization, and the rise of fintech. From institutional investors to retail traders, the Indian market is undergoing a revolution that is reshaping how trading is executed.
Evolution of Algo & Quant Trading Globally and in India
Global Origins
Algorithmic trading traces its roots back to the 1970s and 1980s in the US and Europe when exchanges began offering electronic trading systems. By the late 1990s and early 2000s, hedge funds and investment banks began adopting quant-driven models for arbitrage, high-frequency trading (HFT), and risk management. Today, in developed markets, more than 70–80% of trades on exchanges are executed through algos.
Indian Journey
India’s journey began much later but has picked up speed rapidly:
2000 – NSE and BSE adopted electronic trading, paving the way for automation.
2008 – SEBI formally allowed algorithmic trading in India, mainly targeted at institutional traders.
2010–2015 – Introduction of co-location services by exchanges allowed brokers and institutions to place their servers closer to exchange data centers, reducing latency.
2016–2020 – With fintech growth and APIs provided by brokers like Zerodha, Upstox, and Angel One, algo trading reached the retail segment.
2020 onwards – Post-pandemic, massive digitization, cheaper data, and increased retail participation fueled the adoption of quant-based strategies among traders.
Today, algo and quant trading in India account for over 50% of daily turnover on NSE and BSE in derivatives and equities combined.
Understanding Algo Trading
Definition
Algo trading uses predefined rules based on time, price, volume, or mathematical models to execute trades automatically without human intervention.
Key Features
Speed: Orders are executed in milliseconds.
Accuracy: Eliminates human error in order placement.
Discipline: Removes emotional bias.
Backtesting: Strategies can be tested on historical data before going live.
Common Algo Strategies in India
Arbitrage Trading – Exploiting price differences across cash and derivatives or across different exchanges.
Market Making – Providing liquidity by quoting both buy and sell prices.
Trend Following – Using indicators like moving averages, MACD, and momentum.
Mean Reversion – Betting that prices will revert to their historical average.
Scalping / High-Frequency Trading – Very short-term strategies capturing micro-movements.
Execution Algorithms – VWAP (Volume Weighted Average Price), TWAP (Time Weighted Average Price) used by institutions to minimize market impact.
Understanding Quant Trading
Definition
Quant trading involves developing strategies based on quantitative analysis – mathematical models, statistical techniques, and computational algorithms.
Building Blocks of Quant Trading
Data – Price data, fundamental data, alternative data (news sentiment, social media, macro indicators).
Models – Predictive models like regression, machine learning algorithms, time-series analysis.
Risk Management – Position sizing, stop-loss rules, drawdown control.
Execution – Often implemented via algorithms to ensure efficiency.
Popular Quant Strategies in India
Statistical Arbitrage (pairs trading, cointegration).
Factor Investing (momentum, value, quality factors).
Machine Learning Models (neural networks, random forests for pattern detection).
Event-Driven Strategies (earnings announcements, macro data, corporate actions).
Regulatory Framework in India
Algo and quant trading in India operate under the supervision of SEBI (Securities and Exchange Board of India). Key guidelines include:
Direct Market Access (DMA): Institutional traders can place orders directly into exchange systems.
Co-location Facilities: Exchanges provide space near their servers to reduce latency for HFTs.
Risk Controls: SEBI mandates pre-trade risk checks (price band, order value, quantity limits).
Approval for Brokers: Brokers offering algos must get SEBI approval and ensure audits.
Retail Algo Trading (2022 draft): SEBI expressed concerns about unregulated retail algos offered via APIs. Regulations are evolving to protect small investors.
While SEBI encourages innovation, it is equally cautious about market stability and fairness.
Technology Infrastructure Behind Algo & Quant Trading
Essential Components
APIs (Application Programming Interfaces): Provided by brokers to allow programmatic order execution.
Low-Latency Networks: High-speed internet and co-location access for institutional players.
Programming Languages: Python, R, C++, and MATLAB dominate strategy development.
Databases & Cloud Computing: MongoDB, SQL, AWS, and Azure for storing and analyzing data.
Backtesting Platforms: Tools like Amibroker, MetaTrader, and broker-provided backtesters.
Rise of Retail Platforms in India
Zerodha’s Kite Connect API
Upstox API
Angel One SmartAPI
Algo platforms like Tradetron, Streak, AlgoTest
These platforms democratized algo and quant trading, allowing retail traders to build, test, and deploy strategies without deep coding knowledge.
Advantages of Algo & Quant Trading
Speed & Efficiency – Execution in microseconds.
No Human Emotions – Reduces fear, greed, or panic.
Scalability – Strategies can run across multiple stocks simultaneously.
Backtesting Capability – Historical simulations improve reliability.
Liquidity & Market Depth – Enhances overall efficiency of markets.
Challenges and Risks
Technology Costs: Infrastructure for serious HFT/quant models is expensive.
Regulatory Uncertainty: Retail algo rules are still evolving.
Market Risks: Backtested strategies may fail in live conditions.
Overfitting Models: Quant strategies may look perfect on paper but collapse in reality.
Operational Risks: Server downtime, internet issues, or software bugs can lead to losses.
The Rise of Retail Algo Traders in India
Traditionally, algo and quant trading were limited to large institutions, hedge funds, and prop trading firms. However, in India, retail adoption is rapidly increasing:
Young traders with coding skills are building custom strategies.
Platforms like Streak allow no-code algo building.
Social trading and strategy marketplaces let retail traders copy tested models.
This democratization is changing market dynamics, as retail algos now contribute significantly to volumes.
Role of Prop Trading Firms and Hedge Funds
Several proprietary trading firms and domestic hedge funds are aggressively building quant and algo strategies in India. These firms:
Employ mathematicians, statisticians, and programmers.
Focus on arbitrage, high-frequency, and statistical models.
Benefit from co-location and institutional-grade infrastructure.
Examples include Tower Research, Quadeye, iRage, and Dolat Capital.
Impact on Indian Markets
Higher Liquidity: Algo trading has improved depth and bid-ask spreads.
Reduced Costs: Institutional investors save on execution costs.
Efficient Price Discovery: Arbitrage strategies ensure fewer mispricings.
Volatility Concerns: Sudden algorithmic errors can lead to flash crashes.
Retail Empowerment: Access to professional-grade tools has leveled the playing field.
Future of Algo & Quant Trading in India
Artificial Intelligence & Machine Learning: AI-driven algos will dominate pattern recognition.
Alternative Data Usage: News analytics, social sentiment, and satellite data will gain importance.
Expansion to Commodities & Crypto: Once regulatory clarity improves, algo adoption will rise in these markets.
Wider Retail Participation: With APIs and fintech growth, retail algo adoption will skyrocket.
Regulatory Clarity: SEBI will formalize frameworks for retail algo safety.
Case Studies
Case Study 1: Arbitrage in Indian Equities
A quant firm builds a model exploiting price differences between NSE and BSE for highly liquid stocks like Reliance and HDFC Bank. The algo executes hundreds of trades daily, making small but consistent profits with low risk.
Case Study 2: Retail Trader Using Streak
A retail trader builds a moving average crossover strategy on Streak for Nifty options. Backtests show consistent profits, and the algo runs live with automated execution. While returns are smaller than HFT firms, it brings consistency and discipline to retail trading.
Conclusion
Algo and Quant trading in India are no longer niche activities reserved for a few elite institutions. They have become an integral part of the Indian financial ecosystem, transforming how markets function. The synergy of technology, regulation, and retail participation is reshaping trading culture.
While risks remain in terms of technology dependence and regulatory gaps, the benefits – efficiency, transparency, and democratization – far outweigh the challenges. The next decade will likely see India emerge as one of the fastest-growing hubs for algo and quant trading in Asia, supported by its large pool of engineers, coders, and financial talent.
Algo & Quant trading are not just the future of Indian markets – they are the present reality shaping every tick on the screen.
Momentum Trading1. What is Momentum Trading?
Momentum trading is a short- to medium-term trading strategy that seeks to capitalize on existing price trends. Instead of trying to predict reversals, momentum traders look to “go with the flow.”
If a stock is rising on strong demand, momentum traders buy it expecting further upside.
If a stock is falling with heavy selling pressure, momentum traders short it anticipating deeper declines.
The core principle is captured in the phrase: “The trend is your friend—until it ends.”
Key Features of Momentum Trading:
Trend Following Nature: It follows short- or medium-term price trends.
Time Horizon: Typically days, weeks, or months (shorter than investing, longer than scalping).
High Turnover: Traders frequently enter and exit positions.
Reliance on Technicals: Heavy use of charts, indicators, and price action rather than fundamentals.
Psychological Driver: Momentum feeds on crowd behavior—fear of missing out (FOMO) and herd mentality.
2. The Theoretical Foundation
Momentum trading is not just a market fad. It is supported by both behavioral finance and empirical evidence.
a) Behavioral Explanation
Investor Herding: Investors often chase rising assets, amplifying the trend.
Anchoring & Confirmation Bias: Traders justify existing moves instead of challenging them.
Overreaction: News or earnings surprises create outsized reactions that persist.
b) Empirical Evidence
Academic studies (notably Jegadeesh & Titman, 1993) have shown that stocks with high past returns tend to outperform in the near future. Momentum is a recognized market anomaly that challenges the Efficient Market Hypothesis (EMH).
c) Physics Analogy
Borrowed from physics, “momentum” suggests that a moving object (in this case, price) continues in its trajectory unless acted upon by external forces (news, earnings, or macro shocks).
3. Tools of Momentum Trading
Momentum traders rely heavily on technical analysis. Here are the most widely used tools:
a) Moving Averages
Simple Moving Average (SMA) and Exponential Moving Average (EMA) smooth price action and help spot trends.
Crossovers (e.g., 50-day EMA crossing above 200-day EMA) indicate bullish momentum.
b) Relative Strength Index (RSI)
Measures speed and magnitude of price changes.
RSI above 70 → Overbought (possible reversal).
RSI below 30 → Oversold (possible bounce).
c) Moving Average Convergence Divergence (MACD)
Shows momentum shifts via difference between two EMAs.
A bullish signal arises when MACD line crosses above the signal line.
d) Volume Analysis
Momentum without volume is weak.
Rising prices with high volume = strong momentum.
Divergence between price and volume warns of exhaustion.
e) Breakouts
Prices breaking above resistance or below support often spark momentum moves.
Traders enter on breakout confirmation.
f) Relative Strength (vs Market or Sector)
Stocks outperforming their index peers often display sustainable momentum.
4. Types of Momentum Trading
Momentum trading is not monolithic. Strategies vary depending on timeframes and style.
a) Intraday Momentum Trading
Captures short bursts of momentum within a trading session.
Driven by news, earnings, or opening range breakouts.
Requires fast execution and strict stop-loss discipline.
b) Swing Momentum Trading
Holds positions for several days to weeks.
Relies on technical setups like flags, pennants, and breakouts.
Less stressful than intraday but requires patience.
c) Position Momentum Trading
Longer-term trend riding (weeks to months).
Relies on moving averages and macro catalysts.
Used by professional traders and hedge funds.
d) Sector or Thematic Momentum
Traders focus on hot sectors (e.g., AI stocks, renewable energy, defense).
Strong sector momentum amplifies individual stock trends.
5. Steps in Momentum Trading
Step 1: Idea Generation
Screeners identify stocks with high relative strength, unusual volume, or new highs/lows.
Step 2: Entry Strategy
Buy during a confirmed breakout.
Enter after consolidation within an uptrend.
Use RSI/MACD confirmation.
Step 3: Risk Management
Place stop-loss below support or recent swing low.
Position size carefully (2–3% of portfolio risk per trade).
Step 4: Exit Strategy
Exit when trend weakens (moving average crossover, bearish divergence).
Book partial profits as price extends far from moving averages.
Step 5: Review & Adapt
Analyze past trades to refine strategy.
6. Psychology of Momentum
Momentum is deeply linked with market psychology.
Fear of Missing Out (FOMO): Traders chase rising assets.
Confirmation Bias: Investors justify price moves with narratives.
Greed and Overconfidence: Leads to over-leveraging in trending markets.
Panic Selling: Accelerates downward momentum.
Understanding these forces helps traders anticipate crowd behavior.
7. Advantages of Momentum Trading
High Profit Potential: Strong trends can deliver outsized returns in short periods.
Flexibility: Works across asset classes—stocks, forex, commodities, crypto.
Clear Rules: Entry and exit are based on technical signals.
Exploits Market Inefficiencies: Captures persistent trends ignored by fundamentals.
8. Risks and Challenges
Trend Reversals: Sudden reversals can cause sharp losses.
False Breakouts: Price may fail to sustain moves, trapping traders.
High Transaction Costs: Frequent trading leads to commissions and slippage.
Emotional Stress: Fast decisions can lead to mistakes.
Overcrowding: When too many traders chase momentum, reversals become violent.
9. Risk Management in Momentum Trading
Momentum trading is risky without strict controls:
Stop-loss Orders: Essential to protect capital.
Trailing Stops: Lock in profits while letting trends run.
Position Sizing: Never risk more than 1–2% of portfolio per trade.
Diversification: Spread momentum bets across assets.
Avoid Overtrading: Quality over quantity.
10. Momentum in Different Markets
a) Equity Markets
Most popular application.
Works best in growth stocks and small/mid-cap names.
b) Forex
Momentum driven by economic releases, central bank decisions, geopolitical risks.
c) Commodities
Momentum thrives on supply-demand imbalances (oil, gold).
d) Cryptocurrencies
Momentum is extreme due to speculative nature and retail participation.
Conclusion
Momentum trading is a blend of science and art—mathematics, psychology, and market intuition. Its power lies in its ability to capture sustained moves fueled by collective human behavior.
Yet, it is not without risks. Momentum reversals can be brutal, requiring traders to maintain discipline, use stop-losses, and avoid emotional decisions.
For those who can balance courage with caution, momentum trading offers one of the most exciting paths in financial markets. It rewards quick thinking, technical mastery, and psychological resilience.
In the end, momentum is the pulse of markets—it reflects fear, greed, and human emotion in motion. By learning to read and ride that pulse, traders position themselves not just as participants, but as masters of the market’s rhythm.

Part 2 Support and ResistanceOption Trading in India
India has seen a boom in retail options trading.
1. Exchanges
NSE (National Stock Exchange): Leader in index & stock options.
BSE (Bombay Stock Exchange): Smaller but growing.
2. Popular Underlyings
Nifty 50 Options (most liquid).
Bank Nifty Options (very volatile).
Stock Options (Infosys, Reliance, HDFC Bank, etc.).
3. SEBI Regulations
Compulsory margin requirements.
Weekly index expiries (Thursday).
Physical settlement of stock options at expiry.
Put Options (Right to Sell)
A Put Option gives the holder the right to sell at a strike price. Used when expecting prices to fall.
Example: Buying Infosys ₹1,500 Put at ₹50 premium pays off if Infosys drops below ₹1,450.
Option Market Participants
Hedgers: Reduce risk by using options as insurance. (e.g., farmer hedging crop price, or investor protecting stock portfolio).
Speculators: Bet on price movements to earn profits.
Arbitrageurs: Exploit price differences across markets.
Writers (Sellers): Earn premium by selling options but take on higher risks.

Option Trading The Mechanics of Option Pricing
1. Intrinsic Value vs. Time Value
Intrinsic Value: The profit if the option were exercised now.
Time Value: The extra value due to remaining time until expiry.
Option Premium = Intrinsic Value + Time Value.
2. Moneyness of Options
In the Money (ITM): Immediate profit if exercised.
At the Money (ATM): Strike ≈ Current price.
Out of the Money (OTM): No immediate profit, only time value.
3. Option Greeks (The DNA of Options)
Delta: Sensitivity of option price to underlying movement.
Gamma: Sensitivity of Delta to underlying movement.
Theta: Time decay – options lose value as expiry nears.
Vega: Sensitivity to volatility.
Rho: Sensitivity to interest rates.
Understanding Greeks is critical for advanced traders.
Risks in Option Trading
Options are not risk-free.
Premium Decay (Theta Risk): Options lose value daily.
Volatility Risk: Implied volatility crush can hurt positions.
Liquidity Risk: Wide bid-ask spreads increase costs.
Assignment Risk: Writers can be forced to fulfill contracts.
Unlimited Losses: Naked option selling is dangerous.

Part 2 Master Candlestick PatternTypes of Options and Market Participants
1. Call Options (Right to Buy)
A Call Option gives the holder the right to buy an asset at a strike price. Investors use calls when they expect prices to rise.
Example: Buying a TCS ₹3,000 Call at ₹100 premium means you profit if TCS rises above ₹3,100 before expiry.
2. Put Options (Right to Sell)
A Put Option gives the holder the right to sell at a strike price. Used when expecting prices to fall.
Example: Buying Infosys ₹1,500 Put at ₹50 premium pays off if Infosys drops below ₹1,450.
3. Option Market Participants
Hedgers: Reduce risk by using options as insurance. (e.g., farmer hedging crop price, or investor protecting stock portfolio).
Speculators: Bet on price movements to earn profits.
Arbitrageurs: Exploit price differences across markets.
Writers (Sellers): Earn premium by selling options but take on higher risks.
Psychology & Discipline in Option Trading
Trading is not just math. It’s mindset.
Fear of Missing Out (FOMO): Leads to impulsive trades.
Over-Leverage: Options tempt traders with small premiums, causing overtrading.
Discipline: Setting stop-loss, position sizing, and risk management is crucial.
Patience: Most successful option traders focus on probability, not prediction.

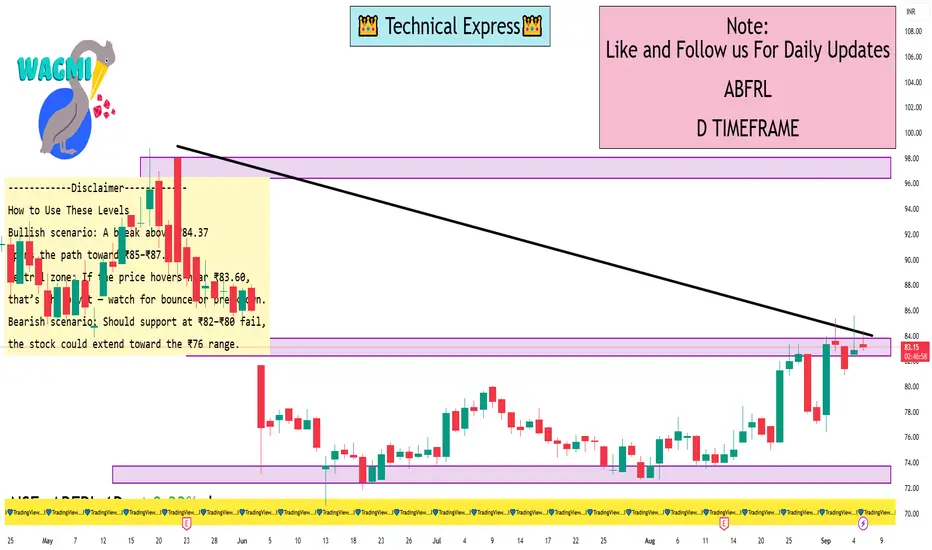
ABFRL 1 Day ViewKey Intraday Support & Resistance Levels (1-Day Timeframe)
Here’s a breakdown of the technical levels for ABFRL on a daily (1-day) timeframe:
Pivot Points & Fibonacci Levels (TopStockResearch as of Sept 5, 2025)
Standard daily pivots:
Support: S1 = ₹83.59, S2 = ₹81.59, S3 = ₹80.29, S4 = ₹78.29
Pivot: ₹84.89
Resistance: R1 = ₹86.89, R2 = ₹88.19
Camarilla pivots confirming nearby support/resistance zone
MunafaSutra Intraday Levels
One source reports:
Resistance: ₹78.09
Short-term support/resistance: ₹80.24 / ₹76.48
Another indicates:
Resistance: ₹77.42
Support/resistance: ₹78.26 / ₹75.82
These shorter-term numbers appear based on earlier data and may have shifted slightly. The pivot-based levels from TopStockResearch are likely more up-to-date and relevant for today’s intraday outlook.
Fibonacci Retracement Levels (from recent uptrends)
Retracement (support) zones from trend beginnings (e.g., June 13–Sept 4):
Near support areas: ₹79.85, ₹78.07, ₹76.30, ₹74.10
Projection (resistance) levels: ₹86.43, ₹88.63, ₹90.40, ₹92.18, ₹94.38
Gap Resistance & Candlestick Patterns
A gap resistance zone exists around ₹84, which may act as a near-term target if bullish momentum continues. Recent candlestick activity (inverted hammer, bullish pin bar) hints at potential short-term reversal strength
Crypto Trading StrategiesChapter 1: Basics of Crypto Trading
1.1 What is Crypto Trading?
Crypto trading is the buying and selling of digital currencies like Bitcoin, Ethereum, or Solana with the goal of making profits. Trades can be short-term (minutes, hours, or days) or long-term (months or years).
1.2 Why Do People Trade Crypto?
High volatility = high profit potential
24/7 market availability
Variety of assets (over 25,000 coins/tokens)
No central authority (decentralization)
1.3 Types of Crypto Trading
Spot Trading: Buying and selling crypto for immediate delivery.
Futures & Derivatives: Speculating on price without holding the asset.
Margin Trading: Borrowing funds to trade larger positions.
Automated Trading (Bots/AI): Using algorithms to execute trades.
Chapter 2: Foundations of a Good Trading Strategy
2.1 Key Elements
Market Analysis (technical + fundamental)
Risk Management (stop-loss, position sizing)
Trading Psychology (discipline, patience)
Adaptability (adjusting strategies to market conditions)
2.2 Technical Tools
Candlestick patterns
Moving averages (MA, EMA)
RSI, MACD, Bollinger Bands
Volume profile and market structure
2.3 Risk Control
Never risk more than 1–2% of capital per trade.
Always set stop-loss orders.
Diversify across assets.
Chapter 3: Popular Crypto Trading Strategies
3.1 HODLing (Long-Term Holding)
Concept: Buy and hold crypto for years regardless of short-term fluctuations.
Best for: Investors who believe in long-term blockchain growth.
Pros: Easy, stress-free, low trading fees.
Cons: Vulnerable to market crashes.
3.2 Day Trading
Concept: Opening and closing positions within a day.
Tools Used: Technical analysis, chart patterns, high liquidity coins.
Pros: Daily income potential.
Cons: Stressful, requires screen time, risky.
3.3 Swing Trading
Concept: Capturing medium-term price swings (days to weeks).
Example: Buying Bitcoin after a pullback and selling after a breakout.
Pros: Less stressful than day trading.
Cons: Requires patience, overnight risks.
3.4 Scalping
Concept: Making dozens or hundreds of trades daily for small profits.
Tools: Bots, high liquidity exchanges, technical indicators.
Pros: Can accumulate profits quickly.
Cons: High fees, mentally exhausting.
3.5 Trend Following
Concept: "The trend is your friend." Trade in the direction of momentum.
Indicators: Moving averages, MACD, Ichimoku Cloud.
Pros: Effective in trending markets.
Cons: Doesn’t work well in sideways (range-bound) markets.
3.6 Breakout Trading
Concept: Entering trades when price breaks a key support/resistance level.
Example: Buying Bitcoin when it breaks $30,000 resistance.
Pros: Can catch big moves early.
Cons: False breakouts are common.
3.7 Arbitrage
Concept: Exploiting price differences between exchanges.
Types:
Exchange Arbitrage (Binance vs Coinbase)
Triangular Arbitrage (using three pairs)
Pros: Low risk if executed fast.
Cons: Requires speed, high capital.
3.8 Copy Trading / Social Trading
Concept: Following trades of professional traders via platforms.
Pros: Easy for beginners.
Cons: Risk if trader performs badly.
3.9 Algorithmic & Bot Trading
Concept: Automated execution using pre-set rules.
Pros: No emotions, works 24/7.
Cons: Needs technical knowledge, market risk.
3.10 News-Based Trading
Concept: Trading based on major announcements (ETF approvals, regulations, partnerships).
Pros: Can profit from volatility.
Cons: Markets react unpredictably.
Chapter 4: Advanced Crypto Trading Strategies
4.1 Using Leverage
Borrowed funds to trade bigger positions.
Example: 10x leverage means 1% move = 10% profit/loss.
Warning: Extremely risky, beginners should avoid.
4.2 Hedging
Using futures/options to protect long-term holdings.
Example: Holding Bitcoin but shorting futures to protect downside.
4.3 Dollar-Cost Averaging (DCA)
Investing small amounts regularly over time.
Pros: Reduces impact of volatility.
Cons: Slower gains in bull markets.
4.4 Yield Farming & Staking
Earning passive income by locking tokens.
Pros: Steady income.
Cons: Smart contract risks, token devaluation.
Chapter 5: Trading Psychology & Risk Management
5.1 Emotions in Trading
Fear & greed drive most mistakes.
Overtrading, revenge trading, panic selling = account killers.
5.2 Building Discipline
Have a written trading plan.
Stick to stop-loss and take-profit levels.
Avoid FOMO (fear of missing out).
5.3 Risk-Reward Ratio
Aim for at least 1:2 risk-reward ratio (risk $100 to make $200).
Chapter 6: Practical Tips for Crypto Traders
Trade only with money you can afford to lose.
Keep records of trades (trading journal).
Use reliable exchanges with strong security.
Learn continuously—crypto evolves fast.
Diversify between Bitcoin, altcoins, and stablecoins.
Conclusion
Crypto trading offers incredible opportunities—but also extreme risks. Without a strategy, traders often fall prey to volatility, scams, or emotions. By learning and applying structured crypto trading strategies like HODLing, day trading, swing trading, scalping, and advanced techniques like arbitrage or hedging, traders can approach the market with confidence.
Success in crypto doesn’t come overnight. It’s built through education, discipline, and consistent execution. The right strategy—combined with risk management and emotional control—can turn crypto from a gamble into a rewarding investment journey.

Managing Risk in Trading1. Understanding Risk in Trading
Before managing risk, it’s crucial to define what “risk” means in trading.
Risk is the possibility of losing money when market moves go against your position.
Every trade has two outcomes: profit or loss. Risk is essentially the probability and magnitude of that loss.
Types of Risks in Trading
Market Risk – Prices moving unfavorably due to volatility, economic events, or news.
Liquidity Risk – Not being able to exit a trade quickly at a fair price.
Leverage Risk – Excessive use of borrowed funds magnifying both gains and losses.
Emotional Risk – Poor decision-making under stress, fear, or greed.
Systematic Risk – Broader economic or geopolitical factors affecting all markets.
Idiosyncratic Risk – Specific risks tied to one stock, sector, or currency pair.
The goal of risk management is not to eliminate risk but to control exposure, minimize downside, and maximize the probability of long-term profitability.
2. The Core Principles of Risk Management
Principle 1: Capital Preservation Comes First
The golden rule: Protect your trading capital before chasing profits.
If you lose too much capital, recovering becomes mathematically harder. For example:
A 10% loss requires 11% gain to break even.
A 50% loss requires 100% gain to break even.
Principle 2: Never Risk More Than You Can Afford to Lose
Traders must only invest money that won’t impact essential life expenses. This ensures psychological balance and prevents desperate decisions.
Principle 3: Position Sizing Matters
The size of your trade must reflect the amount of risk you are comfortable taking. Over-leveraging is one of the fastest ways traders blow up accounts.
Principle 4: Accept That Losses Are Part of the Game
No strategy wins 100% of the time. Even top hedge funds experience losing streaks. Successful traders don’t avoid losses—they limit them.
Principle 5: Consistency Over Jackpot
Risk management is about steady, compounding growth rather than chasing one big win.
3. Practical Risk Management Tools
3.1 Stop-Loss Orders
A stop-loss order automatically exits your position once the price hits a pre-defined level.
Example: If you buy a stock at ₹100, you might place a stop-loss at ₹95, limiting potential loss to 5%.
Benefits:
Removes emotional decision-making.
Limits catastrophic losses.
Provides a clear risk-to-reward framework.
3.2 Take-Profit Levels
Just like limiting losses, pre-deciding where to book profits is essential. Greed often prevents traders from closing positions, only to see profits vanish.
3.3 Risk-Reward Ratio
The ratio compares potential profit versus potential loss.
Example: Risking ₹100 to make ₹300 means a 1:3 risk-reward ratio.
Professional traders often only take trades with at least 1:2 or higher ratios.
3.4 Diversification
Avoid putting all money in one trade, sector, or asset class.
Example: If you’re trading equities, also balance with forex, commodities, or bonds.
3.5 Hedging
Using instruments like options or futures to reduce risk.
Example: If you own a stock, buying a put option can protect against downside risk.
3.6 Leverage Control
Leverage magnifies returns but also magnifies losses.
Conservative traders limit leverage to manageable levels (like 2x or 5x), while reckless use (50x or 100x leverage in forex/crypto) can wipe out accounts quickly.
3.7 Volatility Adjustment
Adjusting position size based on market volatility.
Higher volatility → smaller position sizes to avoid large swings.
4. Position Sizing Strategies
Position sizing determines how much of your capital you allocate per trade.
4.1 Fixed Percentage Rule
Risk only a small percentage of capital per trade (commonly 1–2%).
Example: With ₹1,00,000 account, risking 1% = ₹1,000 per trade.
4.2 Kelly Criterion
A formula-based approach to maximize long-term growth while avoiding overexposure.
Balances win probability and risk-reward ratio.
4.3 Volatility-Based Position Sizing
Larger positions in stable markets, smaller ones in volatile conditions.
5. Psychological Risk Management
Emotions are often a bigger risk than the market itself.
5.1 Fear and Greed
Fear prevents traders from entering good trades or causes early exits.
Greed leads to overtrading or holding on too long.
5.2 Discipline
Following a trading plan strictly, regardless of emotions, is crucial.
Consistency beats emotional improvisation.
5.3 Avoid Revenge Trading
After losses, many traders try to “win it back” quickly. This often leads to bigger losses.
5.4 Patience
Waiting for high-probability setups rather than forcing trades is key.
5.5 Mindset
Think like a risk manager first, trader second.
Your job is not to predict markets perfectly but to manage outcomes effectively.
6. Building a Risk Management Plan
A written plan brings discipline and removes impulsive decisions.
Components of a Risk Plan:
Capital at Risk – Decide max loss per trade and per day/week.
Stop-Loss Strategy – Where and how you’ll place stops.
Position Sizing – Percentage risk rules.
Diversification Rules – How to spread trades.
Risk-Reward Criteria – Minimum acceptable ratios.
Review & Journal – Record every trade and analyze mistakes.
7. Real-World Examples
Example 1: Stock Trading
Trader has ₹5,00,000 capital.
Risks 1% per trade = ₹5,000.
Buys shares worth ₹1,00,000 with stop-loss at 5%.
Max loss = ₹5,000 (within plan).
Example 2: Forex Trading
Account size = $10,000.
Risk per trade = 2% ($200).
Chooses 50-pip stop-loss.
Lot size adjusted so each pip equals $4 → max loss $200.
Example 3: Options Trading
Owns stock worth ₹2,00,000.
Buys protective put for ₹5,000 premium.
If stock crashes, loss is capped at strike price.
8. Common Mistakes in Risk Management
Overleveraging – Betting too big.
Moving Stop-Loss – Hoping market turns back.
Ignoring Correlation – Owning multiple assets that move together.
Risking Too Much Too Soon – Overconfidence after small wins.
No Trading Journal – Failing to learn from mistakes.
9. Advanced Risk Management Techniques
Value-at-Risk (VaR) – Statistical measure of max loss at a given confidence level.
Monte Carlo Simulations – Stress testing strategies under random conditions.
Drawdown Analysis – Limiting maximum decline from peak capital.
Trailing Stops – Locking in profits while allowing trades to run.
Options Strategies – Spreads, straddles, collars for advanced hedging.
10. Long-Term Survival Mindset
Trading is not a sprint, it’s a marathon. The objective is to stay in the game long enough to let skill and discipline compound profits.
Think like a casino: Casinos don’t know individual outcomes, but they manage probabilities and always win in the long run.
Compounding works slowly: Preserving capital and growing steadily beats chasing overnight riches.
Final Thoughts
In trading, you cannot control the market, but you can control your exposure, your decisions, and your discipline. Risk management transforms trading from a gamble into a professional endeavor. Without it, even the best strategies fail. With it, even modest strategies can compound wealth over time.
Part 10 Trading Master Class With ExpertsOptions in Hedging
Options are not only for speculation. Big institutions use them for hedging.
Portfolio Hedge: A fund holding ₹100 crore worth of Nifty stocks may buy Nifty puts. If the market crashes, puts rise in value, cushioning losses.
Corporate Hedge: A company expecting payment in USD may buy currency options to protect against rupee appreciation.
Commodity Hedge: A farmer may use options to lock in selling prices for crops.
Hedging reduces uncertainty and stabilizes income.
Options in Speculation
Speculators love options because:
Small premium = big exposure.
High leverage = high potential returns.
Flexibility to bet on direction, volatility, or time.
But speculation is risky. Most retail traders lose because they treat options as lottery tickets.
Options for Income Generation
Option sellers (writers) earn premium by providing liquidity to buyers.
Covered Call Writing: Regularly selling calls on owned stock generates income.
Cash-Secured Puts: Selling puts on stocks you’re willing to buy at lower prices.
Range-Bound Strategies (Iron Condors, Butterflies): Earn premium if stock stays within range.
Many professionals and institutions rely on option selling for consistent income.

Part 8 Trading Master Class With ExpertsNeutral Market Strategies
Sometimes traders expect the market to move sideways with low volatility. Options shine here:
Straddle: Buy a call & put at the same strike.
Profits if stock makes big move (up or down).
Expensive because of double premium.
Strangle: Buy OTM call & OTM put.
Cheaper than straddle.
Needs a strong move in any direction.
Iron Condor: Sell OTM call + sell OTM put + buy far OTM call + buy far OTM put.
Profits if stock stays within a range.
Popular income strategy.
Butterfly Spread: Combine calls or puts at 3 strike prices.
Best when expecting very little movement.
Advanced Strategies
Calendar Spread: Sell near-term option & buy long-term option at same strike.
Benefits from time decay differences.
Ratio Spread: Sell more options than you buy.
High-risk, high-reward.
Diagonal Spread: Mix of calendar & vertical spread.
Box Spread: Combination that locks in risk-free profit (used by arbitrageurs).
📌 Takeaway: Strategies allow traders to play in bullish, bearish, or neutral markets while controlling risk. Mastery of strategies separates professional traders from gamblers.

Part 7 Trading Master Class With ExpertsOptions vs. Futures vs. Stocks
Stocks: Simple ownership.
Futures: Obligation to buy/sell at a future date.
Options: Rights without obligation.
Options are less risky than futures (for buyers) but more complex.
Real-World Examples
Example 1: You buy Nifty 20,000 Call at ₹100 premium. Lot size = 50.
Cost = ₹5,000.
If Nifty rises to 20,200, your profit = ₹10,000 - ₹5,000 = ₹5,000.
If Nifty stays below 20,000, you lose only premium = ₹5,000.
Psychology & Risk Management
Options are not just math, they need psychology:
Don’t over-leverage.
Accept losses early.
Use stop-loss.
Stick to defined strategies.
Manage emotions of greed and fear.

Part 3 Learn Institutional Trading Option Pricing & Premiums
The premium (price of option) is determined by many factors:
Intrinsic Value – Difference between current stock price and strike price. Example: If stock = ₹200, strike = ₹180 (call), intrinsic value = ₹20.
Time Value – Extra premium because of time left until expiry. More time = higher premium.
Volatility – Higher volatility increases premium (uncertainty = higher value).
Interest rates & dividends – Also affect option pricing slightly.
The most famous model for pricing options is the Black-Scholes Model, used worldwide.
Moneyness (ITM, ATM, OTM)
Options are classified as:
In The Money (ITM): Option already has intrinsic value. (Example: Stock = ₹250, Call strike = ₹240).
At The Money (ATM): Stock price = strike price.
Out of The Money (OTM): Option has no intrinsic value yet. (Example: Stock = ₹250, Call strike = ₹280).
OTM options are cheaper, but riskier. ITM options are costlier, but safer.

ATULAUTO 1 Day ViewIntraday Support & Resistance (1-Day Level)
MunafaSutra reports:
Short-term Resistance: ₹434.01 and ₹438.97
These levels are cited as valid for intra-day trading scenarios
ICICI Direct shows:
First Support: ₹422.5
Second Support: ₹418.7
Third Support: ₹413.2
Second Resistance: ₹437.2
Third Resistance: ₹441.0
Summary of intraday levels:
Support zone: ~₹422–₹419
Resistance zone: ~₹437–₹441
Current Price Context
ICICIdirect shows a day high of ₹499.05 and day low of ₹449.00, with a last traded price around ₹490.20 as of September 4, 2025
Investing.com also confirms this high volatility range: day’s range ~₹454.95 to ₹497.60
This suggests the stock has already experienced a significant intraday rally, trading well above the traditional short-term resistance levels noted by analysts.
Technical Ratings (Daily Basis)
TradingView categorizes the 1-day timeframe technical summary for Atul Auto as "Neutral" across both Oscillators and Moving Averages
Final Thoughts
For aggressive traders: A breakout above the ₹495–₹503 zone could spark further upside.
For cautious traders: Watch for potential consolidation and hold above ₹475–₹484 as signs of strength. A dip to ₹434–₹444 still maintains bullish structure for now.
Stop-loss planning: Consider trailing protection below key support levels, e.g., around the pivot zone (₹475) or lower support (₹434).
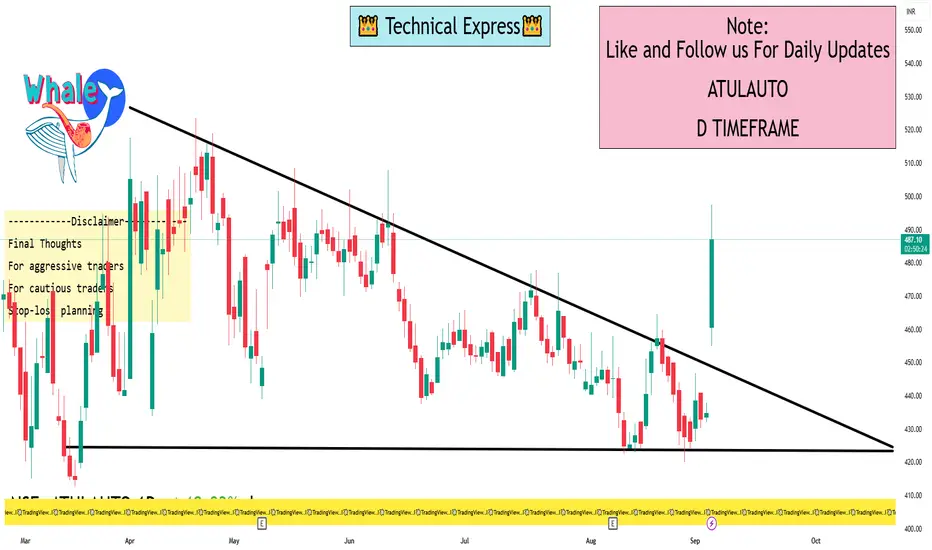
Retail vs Institutional Trading1. Defining Retail and Institutional Trading
1.1 Retail Trading
Retail traders are individual investors who buy and sell financial instruments with their personal money. They typically trade via online brokerage accounts or traditional brokers, using platforms like Zerodha, Robinhood, Charles Schwab, Fidelity, or Interactive Brokers.
Characteristics of retail traders:
Small capital size (from a few hundred dollars to a few lakh/ thousands).
Shorter time horizons, often focusing on short-term gains or personal investment goals.
Use of simplified platforms and basic tools.
Limited access to insider research or advanced market data.
Highly influenced by news, social media, or trends.
1.2 Institutional Trading
Institutional traders are large organizations that trade on behalf of clients, funds, or corporations. Examples include mutual funds, hedge funds, pension funds, insurance companies, sovereign wealth funds, and investment banks.
Characteristics of institutional traders:
Massive capital base, often billions of dollars.
Longer time horizons, though hedge funds may also engage in short-term or high-frequency trading.
Access to advanced research, analytics, and algorithmic trading systems.
Ability to negotiate better fees, spreads, and execution rates.
Often influence market prices due to the sheer size of their trades.
2. Scale of Operations
The most obvious difference between retail and institutional trading is scale.
A retail trader may buy 50 shares of Apple or a few lots of Nifty futures.
An institutional trader might purchase millions of shares or manage portfolios worth tens of billions.
This scale difference creates unique dynamics:
Institutions cannot move in and out of positions easily without affecting prices.
Retail traders, due to their small size, enjoy agility and can enter/exit positions quickly.
3. Tools and Technology
3.1 Retail Traders
Retail traders typically rely on:
Trading apps (e.g., Zerodha Kite, Robinhood, TD Ameritrade).
Technical indicators like moving averages, RSI, MACD.
Basic charting platforms (TradingView, MetaTrader).
Limited access to real-time institutional data.
3.2 Institutional Traders
Institutional traders operate on another level with:
Algorithmic and High-Frequency Trading (HFT) systems.
Proprietary trading models, AI, and machine learning.
Direct market access (DMA) with ultra-low latency.
Bloomberg terminals and advanced risk management dashboards.
Teams of analysts and quants for research.
Thus, while retail trading is often manual and discretionary, institutional trading is increasingly automated and systematic.
4. Market Impact
4.1 Institutional Impact
When an institution places a trade worth hundreds of millions, it can move the market price significantly. For example, if BlackRock decides to buy a large stake in a company, the stock may rise due to sudden demand.
4.2 Retail Impact
Retail traders usually have minimal market-moving power individually. However, when retail traders act collectively—such as the GameStop short squeeze of 2021—they can move markets in dramatic ways.
5. Trading Strategies
5.1 Retail Trading Strategies
Swing trading: Holding for days/weeks.
Day trading: Multiple intraday trades.
Options trading: Buying calls/puts with limited risk.
Trend following: Using technical indicators.
News-based trading: Reacting to announcements.
Retail traders often focus on simplicity and quick gains.
5.2 Institutional Trading Strategies
Quantitative trading: Using complex mathematical models.
High-frequency trading (HFT): Thousands of trades in milliseconds.
Arbitrage: Exploiting price differences across markets.
Long-term value investing: Buying undervalued assets for decades.
Hedging: Managing risk for clients.
Institutions play a more diverse and sophisticated game, balancing risk with return.
6. Advantages and Disadvantages
6.1 Retail Traders – Advantages
Agility: Small size means quick exits.
Independence: Can take risks institutions cannot.
Accessibility: Online trading platforms allow low entry barriers.
Potential for outsized gains: A single bet can multiply wealth.
6.2 Retail Traders – Disadvantages
Lack of information edge.
Higher fees/spreads compared to institutions.
Emotional decision-making (fear & greed).
Susceptible to scams, herd mentality, or misinformation.
6.3 Institutional Traders – Advantages
Access to best research, tools, and liquidity.
Negotiated low transaction costs.
Economies of scale.
Ability to influence companies (activist investing).
6.4 Institutional Traders – Disadvantages
Too large to be nimble—cannot exit quickly.
Market scrutiny from regulators.
Pressure to perform consistently for clients.
Vulnerable to systemic risks (2008 crisis showed big funds collapsing).
7. Psychology of Trading
Retail traders often suffer from emotional biases: fear of missing out (FOMO), panic selling, or chasing hype stocks.
Institutional traders follow more disciplined, rule-based systems with committees and checks to reduce emotional influence.
However, even institutions are not immune to herding behavior—when many funds chase the same trend (dot-com bubble, crypto mania).
8. Regulatory Environment
Retail trading is regulated to protect small investors from fraud and unfair practices.
Institutional trading is regulated to prevent market manipulation, insider trading, and systemic risks.
Regulators such as SEBI (India), SEC (U.S.), FCA (UK) ensure fair play across both sides.
9. Retail vs Institutional in Emerging Markets
In markets like India, Brazil, and Southeast Asia, retail participation has exploded due to:
Mobile apps and digital brokers.
Increased financial literacy.
Rising disposable incomes.
At the same time, institutions (domestic mutual funds, FIIs) dominate long-term flows. The push-pull between retail excitement and institutional discipline often drives volatility.
10. Case Studies
10.1 GameStop Mania (2021)
Retail traders on Reddit’s WallStreetBets drove a short squeeze against hedge funds, showing retail’s collective power.
10.2 2008 Global Financial Crisis
Institutional excesses in mortgage-backed securities triggered a meltdown, proving that large-scale institutional risks can destabilize the entire global economy.
10.3 Indian Markets (2020–2022)
Post-COVID, Indian retail investors surged through platforms like Zerodha and Groww, increasing direct retail ownership of equities. However, FIIs (Foreign Institutional Investors) still dominate net flows.
Conclusion
Retail and institutional traders may seem to be playing the same game, but they operate with very different tools, capital, psychology, and strategies.
Retail trading is marked by agility, independence, and passion, but limited by scale and access.
Institutional trading is marked by power, research, and influence, but limited by bureaucracy and systemic exposure.
Both are crucial pillars of the financial markets. Retail provides liquidity, diversity, and vibrancy, while institutions provide stability, scale, and depth.
Ultimately, the relationship between retail and institutional traders is not adversarial but symbiotic—together, they make markets more efficient, liquid, and reflective of global economic realities.