Divergence SecretsIntroduction to Options Trading (Educational Foundation)
Options are one of the most important financial instruments available in modern markets. For a beginner, understanding them may feel overwhelming at first, but with the right approach, they can become a powerful tool for investment, speculation, and risk management.
An option is a financial contract that gives its holder the right (but not the obligation) to buy or sell an asset, such as a stock, at a predetermined price, within a fixed time frame.
There are two major types of options:
Call Option – Provides the right to buy the underlying asset at a fixed price (called the strike price).
Put Option – Provides the right to sell the underlying asset at a fixed price.
For example:
Imagine you believe Infosys stock, currently at ₹1600, will rise soon. Instead of buying the stock directly, you can buy a call option with strike ₹1650. If Infosys rises to ₹1700, your option increases in value, and you earn profit without investing the full cost of shares.
This flexibility is what makes options attractive—but also dangerous if used without proper strategies.
Why Beginners Need Strategies Instead of Random Trades
Options can generate huge profits, but they can also cause significant losses. Many beginners are tempted to “buy cheap options” hoping for quick riches. Unfortunately, statistics show that most lose money in the long run.
The reasons are:
Options lose value with time decay (Theta).
Market moves are unpredictable; random bets rarely succeed.
Beginners underestimate risk exposure.
That’s why structured strategies are necessary. A strategy gives:
Clarity – A defined plan for entry and exit.
Risk management – Limited losses instead of unlimited risk.
Flexibility – Ability to profit in different market conditions (bullish, bearish, sideways, or volatile).
In education terms: A strategy is like a map. Just as students need a study plan to pass exams, traders need strategies to succeed in markets.
Zomato

Option Trading Bull Call Spread (Controlled Bullish Strategy)
Best for: Beginners expecting moderate rise in stock.
Market Outlook: Moderately bullish.
How it works:
Buy a lower strike call.
Sell a higher strike call.
Example:
Nifty at 22,000.
Buy 22,000 call at ₹150.
Sell 22,200 call at ₹80.
Net cost = ₹70.
If Nifty rises to 22,200, max profit = ₹130 (₹200 – ₹70).
Max loss = ₹70 (if Nifty stays below 22,000).
✅ Pros: Limited risk, limited reward.
❌ Cons: Not suitable if stock rises sharply.
Bear Put Spread (Controlled Bearish Strategy)
Best for: Beginners expecting moderate fall in stock.
Market Outlook: Moderately bearish.
How it works:
Buy a higher strike put.
Sell a lower strike put.
Example:
Nifty at 22,000.
Buy 22,000 put at ₹160.
Sell 21,800 put at ₹90.
Net cost = ₹70.
If Nifty falls to 21,800, max profit = ₹130.
Max loss = ₹70.
✅ Pros: Controlled loss, cheaper than naked put.
❌ Cons: Profit capped.

PCR Trading Strategies Beginner-Friendly Option Trading Strategies
Here are the most important beginner strategies every new trader should know.
Covered Call Strategy (Low-Risk Income Strategy)
Best for: Beginners who already own stocks.
Market Outlook: Neutral to slightly bullish.
How it works:
You own 100 shares of a stock.
You sell a call option on the same stock.
Example:
You own Infosys shares at ₹1600.
You sell a call option with strike price ₹1700 for a premium of ₹30.
If Infosys stays below ₹1700, the option expires worthless, and you keep ₹30 per share as profit.
If Infosys rises above ₹1700, you sell at ₹1700 (still a profit because you bought at ₹1600).
✅ Pros: Steady income, limited risk.
❌ Cons: Profit capped if stock rallies big.
Protective Put (Insurance Strategy)
Best for: Investors who fear stock downside.
Market Outlook: Bullish but worried about risk.
How it works:
You own stock.
You buy a put option as insurance.
Example:
You own TCS shares at ₹3600.
You buy a put option at strike ₹3500 for ₹50 premium.
If TCS falls to ₹3300, your loss on stock is ₹300, but your put option gains value, protecting you.
✅ Pros: Protects against big losses.
❌ Cons: Premium cost reduces profits.

Part 2 Master Candlestick PatternIntroduction to Options Trading (Basics)
Options trading is one of the most exciting areas in the stock market. Unlike buying and selling shares directly, options allow traders to control a stock without owning it fully. This gives leverage (more exposure with less money), but it also carries risks.
An option is a contract that gives you the right (but not the obligation) to buy or sell a stock at a certain price before a certain date.
Call Option: Right to buy at a fixed price (strike price).
Put Option: Right to sell at a fixed price.
For example:
Suppose Reliance stock is ₹2500. You buy a call option with strike price ₹2600 (expiry in one month). If Reliance goes up to ₹2800, your option value rises, and you make profit without investing huge capital.
Options can be used in different ways:
To speculate (bet on direction)
To hedge (protect investments)
To earn income (through writing options)
But for beginners, blindly speculating with options is risky. That’s why strategies are important—they give a structured approach to trading instead of gambling.
Why Beginners Need Strategies Instead of Random Trades
Most new traders jump into options because they see “quick profits.” However, around 80-90% of beginners lose money in options. The main reason is lack of planning.
Here’s why strategies matter:
Risk Control: Options have unlimited loss potential if traded recklessly. Strategies limit risk.
Consistent Approach: Instead of random bets, strategies follow defined rules.
Flexibility: Strategies allow traders to profit in different market conditions (up, down, sideways).
Capital Efficiency: Beginners usually have limited funds; strategies help them maximize capital use.
Example:
Instead of buying a random call option (which can expire worthless), a beginner can use a bull call spread, reducing risk while still having profit potential.

Part 1 Master Candlestick PatternRisk Management for Beginners
Risk management is the most important subject in options education. Even the best strategy fails without discipline.
Rules for beginners:
Never invest all capital in options (limit to 10–20%).
Always use stop-loss orders.
Trade in liquid contracts (like Nifty, Bank Nifty, large-cap stocks).
Understand Greeks (Delta = direction, Theta = time decay, Vega = volatility).
Avoid selling naked options (unlimited risk).
Common Mistakes Beginners Make
Buying cheap out-of-the-money options – They look attractive but often expire worthless.
Ignoring time decay – Options lose value daily.
Overtrading – Too many trades cause losses.
No exit plan – Holding losing positions too long.
Chasing quick profits – Leads to gambling behavior.
Educational Tips for Success
Start with paper trading to learn without risk.
Focus on 1–2 simple strategies first (covered call, spreads).
Keep a trading journal to track mistakes.
Read about market psychology.
Remember: protecting capital is more important than chasing profits.

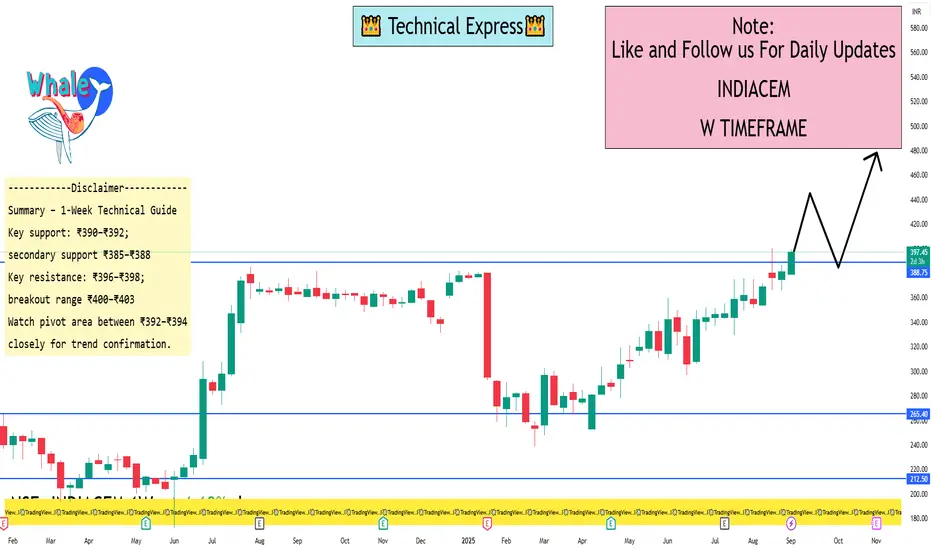
India Cements Ltd. 1 Week ViewCurrent Trend & Technical Overview
On daily analysis, the stock is in a Strong Buy zone, with all moving averages across 5-, 10-, 20-, 50-, 100-, and 200-day periods signaling buy, alongside predominantly bullish indicators such as RSI (~74.9), MACD, ADX, ROC, and more
The stock is trading near its 52-week high (~₹400), with a current range of approximately ₹385–₹398
Analysts maintain a Strong Buy technical stance, though consensus price targets indicate potential downside (~₹282 avg target vs current ~₹397), suggesting valuation may be extended
1-Week Technical Levels
Pivot Points (from Investing.com data):
Classic Pivots (Daily):
S1: ₹390.16
Pivot: ₹392.48
R1: ₹396.61
R2: ₹398.93
R3: ₹403.06
Supports: down to ₹383.71
Fibonacci, Camarilla, and Woodie pivots are closely clustered—suggest key levels between ₹392–₹394 (pivot), with resistance around ₹396–₹398 and support near ₹386–₹390
TradingView Idea (dated August):
Bullish Entry: Daily close above ₹232/₹239, safe entry above ₹269.
Targets: ₹291–₹296 initially; further upside to ₹350–₹354 and ₹409–₹413.
Bearish Risk: Close below ₹223 may expose ₹203 and ₹173
(Note: Those levels are older and far below current prices; still helpful historically.)
Sambhv Steel Tubes Ltd. 1 Day View Intraday Snapshot (1-Day Time Frame)
Latest Price & Movement
Price is hovering around ₹124–₹127 as of today, September 3, 2025. For instance:
Angel One reports ₹124.67 on both NSE and BSE
Economic Times cites a price of ₹126.79, reflecting a ~2.55% rise from the previous close
Intraday Range
Moneycontrol and Investing show the day’s trading range between ₹122.97 and ₹126.90
Market depth confirms bids around ₹125.90 and asks near ₹126.20, underlining a tight trading bandwidth
Support & Resistance
A technical model identifies ₹123.06 as a key support level. The stock is said to maintain its uptrend as long as it stays above this level
Quick Summary Table
Parameter Value
Price Range (Today) ₹122.97 – ₹126.90
Support Level ₹123.06
Recent Trend Uptrend supported above ₹123.06
Volume Moderate, typical for small-cap names
Technical Indicators Not specifically available for 1-day, but you can reference RSI, MACD, VWAP on chart platforms

Part 10 Trading Masterclass With ExpertsTypes of Options
There are two fundamental types of options:
(a) Call Option
A call option gives the buyer the right to buy the underlying asset at a fixed strike price before or on expiration.
Buyers of calls expect the price to rise.
Sellers of calls expect the price to stay flat or fall.
Example:
Suppose you buy a call option on TCS with a strike price of ₹3,500, expiring in one month. If TCS rises to ₹3,800, you can exercise the option and buy at ₹3,500, making a profit. If TCS stays below ₹3,500, you lose only the premium.
(b) Put Option
A put option gives the buyer the right to sell the underlying asset at the strike price before or on expiration.
Buyers of puts expect the price to fall.
Sellers of puts expect the price to rise or stay stable.
Example:
You buy a put option on Infosys with a strike of ₹1,500. If Infosys drops to ₹1,200, you can sell at ₹1,500 and earn profit. If Infosys stays above ₹1,500, you lose only the premium.
The Four Basic Positions
Every option trade can be boiled down to four core positions:
Long Call – Buying a call (bullish).
Short Call – Selling a call (bearish/neutral).
Long Put – Buying a put (bearish).
Short Put – Selling a put (bullish/neutral).
All advanced strategies are combinations of these four.

Part 7 Trading Masterclass With ExpertsOptions Greeks and Their Role
Every strategy depends heavily on the Greeks:
Delta: Sensitivity to price changes.
Gamma: Rate of change of delta.
Theta: Time decay of option value.
Vega: Sensitivity to volatility.
Rho: Sensitivity to interest rate changes.
Traders use Greeks to fine-tune strategies and manage risk exposure.
Risk Management in Options
Risk control is crucial. Key principles:
Never risk more than you can afford to lose.
Use spreads instead of naked options.
Monitor Greeks daily.
Diversify across strikes and expiries.
Set stop-loss and exit plans.

Part 6 Institutional Trading Advanced & Professional Strategies
(a) Butterfly Spread
Combination of 3 strike prices (buy 1 low strike call, sell 2 middle strike calls, buy 1 high strike call).
Profits from minimal price movement.
(b) Calendar Spread
Sell near-term option and buy long-term option at the same strike.
Profits from time decay difference.
(c) Ratio Spread
Buy 1 option, sell 2 options at different strikes.
Increases reward potential but adds risk.
(d) Box Spread
Arbitrage-like strategy combining bull and bear spreads.
Used by professionals for risk-free returns (if pricing inefficiency exists).

Part 4 Institutional Trading Intermediate Strategies
(a) Bull Call Spread
Buy a call at lower strike and sell a call at higher strike.
Reduces cost but caps profit.
Good for moderately bullish markets.
(b) Bear Put Spread
Buy a put at higher strike, sell a put at lower strike.
Used in moderately bearish markets.
(c) Straddle
Buy one call and one put at the same strike and expiry.
Profits if stock makes a big move in either direction.
Expensive, requires high volatility.
(d) Strangle
Buy OTM call + OTM put.
Cheaper than straddle but needs a larger price move.
(e) Iron Condor
Combination of bull put spread + bear call spread.
Profits when price stays in a range.
Great for low-volatility environments.

Part 3 Institutional Trading Popular Basic Strategies
(a) Covered Call
Buy the underlying stock and sell a call option.
Used to earn extra income if you already own shares.
Risk: Stock price falls.
Reward: Premium + limited upside.
(b) Protective Put
Buy stock and simultaneously buy a put option.
Acts like insurance — protects against downside risk.
Example: If you own TCS stock at ₹3500, buy a 3400 put.
Risk: Premium paid.
Reward: Unlimited upside with limited downside.
(c) Long Call
Buy a call option expecting the price to rise.
Limited risk (premium paid), unlimited reward.
Example: Buy Nifty 20,000 CE at 100 premium.
(d) Long Put
Buy a put option expecting a fall in price.
Limited risk (premium), large profit potential in downturns.

Part 2 Ride The Big Moves Why Use Options Trading Strategies?
Options are powerful, but without strategy, they are risky. Strategies are used to:
Hedge Risks – Protect existing investments from price fluctuations.
Speculate – Bet on the direction of stock prices with controlled risk.
Generate Income – Earn steady returns through premium collection.
Leverage Capital – Control larger positions with smaller investments.
Diversify Portfolio – Use non-linear payoffs to balance stock positions.
Classification of Option Strategies
Broadly, option trading strategies can be divided into:
Directional Strategies – Profiting from a specific market direction (up or down).
Non-Directional Strategies – Profiting from volatility regardless of direction.
Income Strategies – Generating consistent returns by selling options.
Hedging Strategies – Protecting existing portfolio positions.

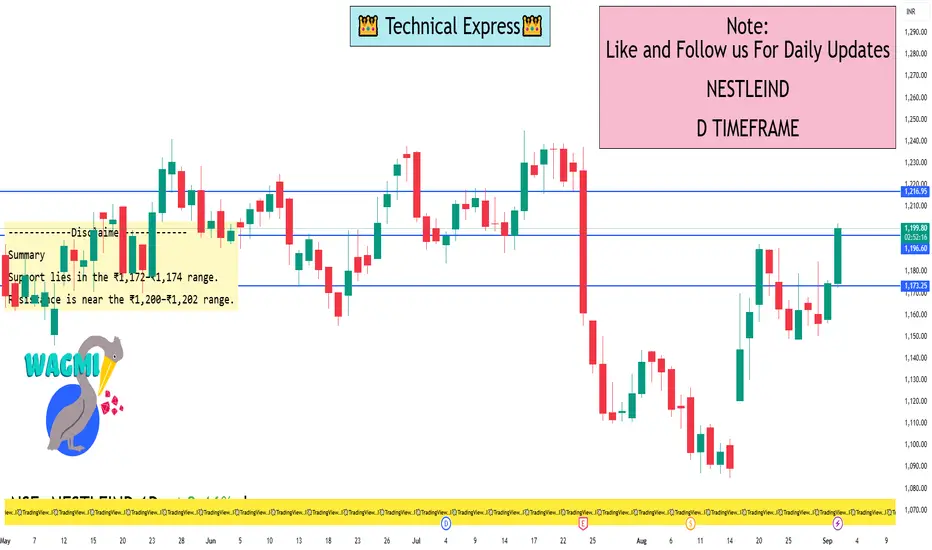
Nestlé India Ltd. 1 Day ViewCurrent Intraday Range & Price Highlights
Today's price movements show Nestlé India trading within a range of approximately ₹1,172 to ₹1,202, with the most recent prices hovering around ₹1,198.
As of September 1, 2025 (Monday), the stock closed at ₹1,174.20, marking a 1.61% gain, outperforming the Sensex, which was up by 0.70%.
1-Day Technical Levels
Level Type Price (Approx.)
Support (Intraday Low) ₹1,172–₹1,174
Resistance (Intraday High) ₹1,202
Previous Close ₹1,174.20
VWAP (Indicative) ₹1,188–₹1,189
These levels represent key intraday zones traders often monitor for entry, exit, or trend confirmation.
Summary
Support lies in the ₹1,172–₹1,174 range.
Resistance is near the ₹1,200–₹1,202 range.
VWAP (~₹1,189) suggests the average traded price today, offering insight into overall sentiment.
The previous day’s strong close (₹1,174.20) can act as both support and a momentum benchmark.
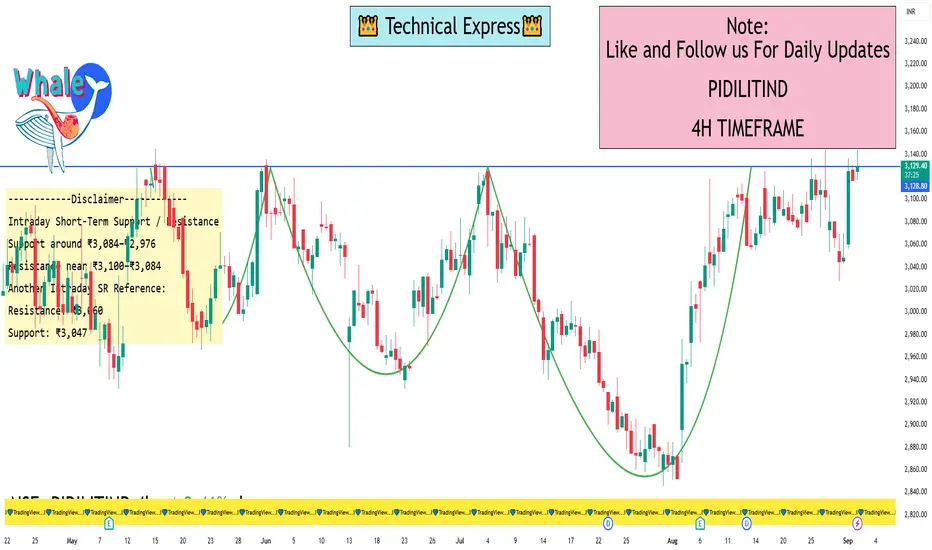
Pidilite Industries Ltd. 4 Hour View While most platforms don’t explicitly publish 4-hour support/resistance levels, we can gather actionable insights from intraday pivot data and community analysis reflecting this timeframe.
Intraday Pivot & Intra-Day Levels
Intraday support levels: ₹3,028.27 and ₹3,006.23
Intraday resistance levels: ₹3,071.17 and ₹3,092.03
Important short-term S/R: Support around ₹3,026.92–₹3,010.53, Resistance at ₹3,073.68–₹3,132.97
These constitute solid reference points for trades over multi-hour windows.
Price Action & Chart Patterns
A trading idea on TradingView highlights a Head & Shoulders formation on the 4-hour chart, with the ₹3,000 round level acting as a potential support (neckline). The suggestion: watch for a breakdown below the neckline followed by a candle-close and retest before considering long trades. If the price rejects again from ₹3,000, that could be a bullish setup.
Quick Summary for 4-Hour Trading
Feature Details
Support Zone ₹3,006–₹3,028 (intraday anchors) and psychological ₹3,000 level
Resistance Zone ₹3,071–₹3,092 and broader zone up to ₹3,130
Pattern Insight 4-hour Head & Shoulders suggests bearish risk if breakdown occurs
Suggested Approach
Watch ₹3,000 closely.
If it holds and price rejects downward moves, look for long setups.
If it breaks decisively with confirmation (e.g., candle close), it may signal further decline—be cautious.
Use intraday pivot levels to anticipate moves.
Support near ₹3,006–₹3,028 can provide entry opportunities for rebounds.
Resistance near ₹3,071–₹3,092 acts as supply zones to monitor for pullbacks or breakout attempts.
Combine with other indicators such as volume, RSI, MACD, or trend filters for stronger signal confirmation.
High Frequency Trading (HFT)Chapter 1: What is High Frequency Trading?
High Frequency Trading (HFT) is a subset of algorithmic trading that uses powerful computer systems and high-speed data networks to execute trades at extremely fast speeds—often in fractions of a second.
Key characteristics of HFT include:
Ultra-fast execution: Trades are placed and canceled in microseconds.
High order volume: Thousands of orders are placed daily, though most are canceled before execution.
Short holding periods: Trades last seconds or less. Unlike long-term investors, HFT firms hold securities for very brief periods.
Market-making role: Many HFT strategies focus on providing liquidity by constantly buying and selling.
Profit from tiny spreads: Instead of making large profits per trade, HFT firms profit from small spreads, repeated thousands of times a day.
In simple terms, HFT is about turning fractions of a cent into big profits by trading at lightning speed.
Chapter 2: The Evolution of High Frequency Trading
1. Early Days of Trading
In the 1980s and 1990s, most trading was still manual. Orders were shouted on trading floors.
The introduction of electronic exchanges like NASDAQ in the U.S. began shifting trading to computers.
2. Rise of Algorithmic Trading
By the early 2000s, algorithms started replacing human traders in executing orders.
These algorithms could split large orders, reduce costs, and minimize market impact.
3. Birth of HFT
In the mid-2000s, faster data networks and co-location services (placing servers directly next to exchange servers) gave rise to High Frequency Trading.
By 2009, it was estimated that over 60% of U.S. equity trading volume came from HFT.
4. Current State
Today, HFT is used globally across equities, futures, options, and even forex markets.
Firms spend billions on technology infrastructure to gain even nanosecond advantages.
Chapter 3: How Does High Frequency Trading Work?
HFT relies on three essential pillars:
1. Technology Infrastructure
Colocation: Placing servers physically near stock exchange servers to reduce transmission time.
Fiber-optic and microwave networks: Data is transmitted at near-light speed between exchanges.
Supercomputers and low-latency systems: Capable of processing massive data and placing orders instantly.
2. Algorithms
Algorithms are the “brains” of HFT. They analyze market data, identify opportunities, and place trades automatically.
These algorithms are designed to spot inefficiencies that exist only for milliseconds.
3. Market Data Access
HFT firms subscribe to direct market feeds, receiving real-time price updates faster than ordinary traders.
They use this information to predict short-term price movements.
Chapter 4: Key Strategies in HFT
1. Market Making
HFT firms continuously post buy (bid) and sell (ask) orders.
They profit from the bid-ask spread.
Example: Buying a stock at $50.01 and selling at $50.02.
2. Arbitrage
Exploiting small price differences across markets.
Types include:
Exchange Arbitrage: Price difference between two stock exchanges.
Statistical Arbitrage: Using mathematical models to predict relationships between securities.
Index Arbitrage: Profit from differences between a stock and its index value.
3. Momentum Ignition
Algorithms detect trends and push prices in a certain direction, profiting from momentum.
4. Liquidity Detection
Algorithms try to identify large institutional orders and trade ahead of them.
5. Latency Arbitrage
Exploiting delays in price reporting between exchanges.
Chapter 5: Benefits of High Frequency Trading
Supporters argue that HFT improves markets in several ways:
Liquidity Provision: HFT firms make markets more liquid by constantly buying and selling.
Tighter Spreads: Increased competition reduces the cost of trading for all investors.
Efficiency: HFT ensures that prices reflect available information faster.
Market Access: Investors can execute trades quicker and at better prices.
Cost Reduction: By automating trading, HFT reduces brokerage and transaction costs.
Chapter 6: Criticisms and Risks of HFT
Despite benefits, HFT is controversial. Critics highlight:
Unfair Advantage
Retail and institutional investors cannot compete with nanosecond speeds.
HFT creates a two-tier market where “fast traders” dominate.
Market Manipulation
Some HFT practices resemble manipulation (e.g., “spoofing” where fake orders are placed to mislead).
Flash Crashes
In May 2010, the U.S. stock market experienced a “Flash Crash”, where the Dow dropped nearly 1,000 points in minutes before recovering. HFT was partly blamed.
Liquidity Mirage
Liquidity provided by HFT can disappear instantly during stress, making markets unstable.
Systemic Risk
Reliance on algorithms means errors can cause massive disruptions.
Chapter 7: Regulation of HFT
Governments and regulators have introduced rules to address risks:
U.S. SEC and CFTC
Monitoring HFT firms closely.
Requiring disclosure of algorithmic strategies.
European Union (MiFID II)
Demands HFT firms be properly registered.
Introduces circuit breakers to prevent flash crashes.
India (SEBI)
Introduced co-location services but with strict monitoring.
Considering minimum resting times for orders to reduce excessive cancellations.
Circuit Breakers Worldwide
Exchanges use automatic halts to prevent market meltdowns.
Chapter 8: Case Studies
1. The 2010 Flash Crash
The Dow Jones dropped 9% in minutes.
HFT amplified the crash by withdrawing liquidity.
2. Knight Capital Incident (2012)
A trading algorithm malfunction cost Knight Capital $440 million in 45 minutes.
Highlighted risks of poorly tested algorithms.
3. India’s NSE Co-location Controversy
Certain brokers allegedly received faster data access.
Raised questions about fairness in Indian markets.
Chapter 9: HFT and Global Markets
HFT is not limited to the U.S. It is now common across:
Europe: Major in London, Frankfurt, Paris.
Asia: Japan, Singapore, and India are growing hubs.
Emerging Markets: As technology spreads, HFT is entering Brazil, South Africa, etc.
Each market has its own regulations, but the global trend is clear: HFT is becoming a dominant force in financial markets worldwide.
Chapter 10: The Future of HFT
The future of High Frequency Trading is shaped by:
Artificial Intelligence & Machine Learning
Algorithms will become more adaptive and predictive.
Quantum Computing
Could reduce processing time further, creating ultra-fast HFT.
Tighter Regulations
Governments may impose stricter controls to protect investors.
Global Expansion
HFT will penetrate deeper into developing markets.
Ethical Debate
Questions about fairness will continue, especially with retail investor growth.
Chapter 11: Ethical and Social Considerations
Fairness vs Innovation: Should markets reward speed over analysis?
Social Value: Does HFT add value to society or only enrich a few?
Job Impact: Replacing human traders with algorithms.
Trust in Markets: Too much reliance on HFT could erode investor confidence.
Conclusion
High Frequency Trading is one of the most transformative developments in modern finance. It merges finance, mathematics, computer science, and telecommunications into a single ecosystem where speed is money.
To its supporters, HFT is a vital innovation—improving liquidity, reducing costs, and making markets more efficient.
To its critics, it is a dangerous distortion—favoring the few, destabilizing markets, and risking systemic failures.
The reality likely lies in between. HFT is here to stay, but it requires responsible regulation, ethical oversight, and technological safeguards to ensure it serves the broader economy.
Ultimately, High Frequency Trading reflects the story of modern markets: a race for speed, efficiency, and profit—where technology shapes the future of finance.

Things Traders Should Avoid1. Ignoring Risk Management
One of the biggest mistakes traders make is trading without a clear risk management plan. Risk management is the backbone of trading. Without it, even the best strategies will eventually fail.
Key Errors to Avoid:
Over-leveraging: Using high leverage magnifies both profits and losses. Many traders blow up accounts by taking oversized positions.
Not using stop-loss orders: Some traders believe they can manually exit trades at the right time. In reality, markets move too fast, and emotions cloud judgment.
Risking too much on one trade: A common guideline is not to risk more than 1–2% of trading capital per trade. Ignoring this rule can wipe out months of profits in a single mistake.
No position sizing strategy: Jumping into trades with random lot sizes leads to inconsistent results.
👉 Example: Imagine a trader with $10,000 capital risks $5,000 on one trade because they feel “confident.” If the trade goes wrong, half the account is gone. Recovering from such a loss requires a 100% gain, which is extremely difficult.
2. Overtrading
Overtrading happens when traders place too many trades, often driven by greed, boredom, or revenge trading.
Mistakes Within Overtrading:
Chasing the market: Entering trades without proper signals because of fear of missing out (FOMO).
Revenge trading: After a loss, trying to “get back” money quickly by doubling positions.
Trading without rest: Markets will always offer opportunities. Overexposure reduces focus and increases mistakes.
👉 Example: A trader loses $200 on a bad trade. Instead of stopping to analyze the mistake, they place another trade with double the position size, hoping to win back losses. Often, this leads to an even bigger loss.
3. Lack of Trading Plan
Trading without a structured plan is like sailing without a compass. A trading plan defines when to enter, when to exit, how much to risk, and which strategies to follow.
Common Errors:
Random decision-making: Buying or selling based on gut feeling.
No journal keeping: Traders who don’t document their trades cannot identify patterns in their mistakes.
Constantly changing strategies: Jumping from one method to another without giving it time to work.
👉 Example: A trader buys a stock because they “heard on TV it’s going up.” Without entry rules, stop-loss, or profit target, the trade is based purely on luck.
4. Letting Emotions Control Decisions
Trading psychology is often more important than technical skills. Emotional trading leads to poor decisions.
Emotional Traps:
Fear: Prevents traders from taking good trades or causes them to exit too early.
Greed: Leads to holding onto winning positions for too long until profits disappear.
FOMO: Entering trades late because others are profiting.
Ego & overconfidence: Refusing to admit mistakes, holding onto losing trades in the hope they recover.
👉 Example: A trader buys a stock at ₹500, it rises to ₹550, but instead of booking profit, greed makes them wait for ₹600. The stock falls back to ₹480, turning profit into loss.
5. Trading Without Education
Many beginners jump into trading with little knowledge, believing they can “figure it out as they go.” This often ends in losses.
What Traders Avoid Learning:
Market fundamentals: Basic concepts like how interest rates, inflation, or company earnings affect prices.
Technical analysis: Chart patterns, indicators, and price action signals.
Risk-reward ratio: Understanding whether a trade is worth the potential risk.
Brokerage & fees: Ignoring transaction costs that eat into profits.
👉 Example: A new trader hears about “options trading” and buys random call options without knowing how time decay works. Even though the stock moves slightly in their favor, the option premium decays, and they lose money.
6. Relying Too Much on Tips & News
Traders who depend solely on TV channels, social media influencers, or WhatsApp tips rarely succeed.
Mistakes:
Acting on rumors: Many news stories are exaggerated or already priced in.
Not verifying sources: Following random advice without checking fundamentals or technicals.
Late entry: By the time news is public, smart money has already acted.
👉 Example: A trader buys a stock after hearing “strong quarterly results” on TV. But by then, the stock is already up 10%. The trader enters late and suffers when the price corrects.
7. Ignoring Market Trends
Fighting the trend is one of the costliest mistakes. Many traders try to “pick tops and bottoms” instead of riding the trend.
Errors:
Catching falling knives: Buying a stock just because it “has fallen too much.”
Selling too early in a bull run: Going short against strong upward momentum.
Not respecting price action: Ignoring charts that clearly show the trend direction.
👉 Example: During a bull market, a trader repeatedly short-sells thinking “this rally can’t last.” Each time, they lose money as the market keeps moving higher.
8. Poor Time Management
Successful trading requires patience and timing. Rushing into trades or neglecting the right timeframes leads to losses.
Errors:
Day trading without time: Traders with full-time jobs trying to scalp during lunch breaks.
Ignoring timeframes: Using a 1-minute chart for long-term investments or a daily chart for intraday scalps.
Not waiting for setups: Jumping in before confirmation.
👉 Example: A trader sees a stock forming a breakout pattern but enters early. The stock pulls back before breaking out, hitting their stop-loss.
9. Overcomplicating Strategies
Many traders load their charts with 10+ indicators, hoping for a perfect signal. In reality, complexity leads to confusion.
Mistakes:
Indicator overload: RSI, MACD, Bollinger Bands, Stochastic, all at once.
No price action focus: Forgetting that price itself is the ultimate indicator.
Constant tweaking: Changing settings after every losing trade.
👉 Example: A trader waits for five indicators to align before trading. By the time the signals confirm, the price has already moved.
10. Lifestyle & Psychological Habits to Avoid
Trading is not just about charts and strategies—it’s also about mindset and lifestyle.
Mistakes:
Lack of sleep: Fatigue reduces focus and increases impulsive decisions.
Trading under stress: Personal problems or financial pressure cloud judgment.
Unrealistic expectations: Believing trading will double money every month.
Neglecting health: Sitting for hours without breaks affects mental sharpness.
👉 Example: A trader under debt pressure tries to make “quick money” by doubling account size. Stress pushes them into risky trades, worsening the situation.
11. Not Adapting to Market Conditions
Markets are dynamic. A strategy that works in a trending market may fail in a range-bound market.
Errors:
Rigid strategies: Refusing to adapt when volatility changes.
Ignoring global events: Economic data, elections, or geopolitical tensions affect all markets.
No backtesting: Not testing strategies across different conditions.
👉 Example: A trader uses breakout strategies during low volatility. Instead of clean moves, the market fakes out, hitting stop-loss repeatedly.
12. Treating Trading Like Gambling
Trading is about probabilities, not luck. When traders treat it like a casino, losses are inevitable.
Mistakes:
All-in bets: Putting entire capital on one trade.
No analysis: Buying or selling randomly.
Relying on luck: Believing one “big trade” will make them rich.
👉 Example: A trader bets entire account on a penny stock hoping it will double. Instead, the stock crashes, wiping them out.
Conclusion
Trading can be rewarding, but only for those who avoid the common traps. The key things traders should avoid include:
Ignoring risk management
Overtrading
Trading without a plan
Emotional decision-making
Relying on tips and news
Fighting the trend
Poor time management
Overcomplicating strategies
Unrealistic expectations
The markets will always be uncertain. A trader’s job is not to predict perfectly but to manage risk, follow discipline, and protect capital. By avoiding the mistakes outlined above, traders can significantly improve their chances of long-term success.
Trading Master Class With ExpertsWhat are Options? (Basics)
An Option is a financial contract between two parties:
Buyer (Holder): Pays a premium for the right (not obligation) to buy/sell.
Seller (Writer): Receives the premium and has an obligation to honor the contract.
There are two basic types:
Call Option (CE) – Right to buy.
Put Option (PE) – Right to sell.
Example:
Suppose Infosys stock is trading at ₹1500. You buy a Call Option with a strike price of ₹1550 expiring in 1 month. If Infosys goes above ₹1550, you can exercise your right to buy at ₹1550 (cheaper than market). If it doesn’t, you just lose the small premium you paid.
This flexibility is the beauty of options.
Key Terms in Options Trading
Before diving deeper, let’s understand some key terms:
Strike Price: The fixed price at which you can buy/sell the asset.
Premium: The price paid to buy the option.
Expiry Date: The date on which the option contract expires.
Lot Size: Options are traded in lots (e.g., 25 shares per lot for Nifty options).
In-the-Money (ITM): When exercising the option is profitable.
Out-of-the-Money (OTM): When exercising would cause a loss.
At-the-Money (ATM): When the strike price = current market price.
Option Buyer: Pays premium, has limited risk but unlimited profit potential.
Option Seller (Writer): Receives premium, has limited profit but unlimited risk.
Types of Options – Calls and Puts
Call Option (CE)
Buyer has the right to buy.
Profits when the price goes up.
Put Option (PE)
Buyer has the right to sell.
Profits when the price goes down.
Example with Reliance stock (₹2500):
Call Option @ 2600: Profitable if Reliance goes above ₹2600.
Put Option @ 2400: Profitable if Reliance goes below ₹2400.

Divergence SecretsHow Options Work in Real Life
Imagine buying insurance:
You pay a premium to the insurance company.
If an accident happens, you claim and get compensated.
If nothing happens, your premium is lost.
Options work the same way:
Premium = Insurance cost.
Strike Price = Insured value.
Expiry Date = Policy end date.
So, options are like insurance policies for traders!
Why Trade Options? (Advantages)
Leverage: Small capital can control a large position.
Flexibility: Profit in bullish, bearish, or sideways markets.
Hedging: Protects portfolio from big losses.
Defined Risk for Buyers: You only lose the premium paid.
Income Generation: Sellers earn premium regularly.

Part 1 Support and ResistanceIntroduction to Options Trading
Trading in the stock market has many forms: buying shares, trading futures, investing in mutual funds, or speculating in commodities. Among all these, Options Trading is one of the most exciting and complex areas.
Options trading gives traders the right, but not the obligation, to buy or sell an underlying asset (like a stock, index, or commodity) at a fixed price before a fixed date.
In simple words:
If you buy a Call Option, you are betting that the price will go up.
If you buy a Put Option, you are betting that the price will go down.
Options give flexibility—traders can profit from rising, falling, or even sideways markets if they use the right strategies. That’s why they are called derivative instruments (their value is derived from an underlying asset).
What are Options? (Basics)
An Option is a financial contract between two parties:
Buyer (Holder): Pays a premium for the right (not obligation) to buy/sell.
Seller (Writer): Receives the premium and has an obligation to honor the contract.
There are two basic types:
Call Option (CE) – Right to buy.
Put Option (PE) – Right to sell.
Example:
Suppose Infosys stock is trading at ₹1500. You buy a Call Option with a strike price of ₹1550 expiring in 1 month. If Infosys goes above ₹1550, you can exercise your right to buy at ₹1550 (cheaper than market). If it doesn’t, you just lose the small premium you paid.
This flexibility is the beauty of options.

Volume in TradingIntroduction
In the world of financial markets, price is often the first thing that traders and investors focus on. We look at whether a stock, commodity, or cryptocurrency is going up or down, and based on that, we make decisions. However, price alone does not tell the full story. To understand whether a price move is strong, weak, reliable, or suspicious, traders look at another crucial element: Volume.
Volume is one of the most powerful and widely used tools in trading. It tells us how much activity is happening in the market—in other words, how many shares, contracts, or units are being bought and sold during a given period. High volume usually signals strong interest and conviction, while low volume suggests hesitation or lack of participation.
In this write-up, we will explore volume in trading from the basics to advanced applications, explaining why it matters, how it is used, and how traders can benefit from interpreting volume correctly.
What is Volume in Trading?
At its simplest, volume refers to the total number of shares, contracts, or units of a security traded within a specific time period. This period could be one minute, one hour, one day, or any timeframe depending on the trader’s focus.
For example:
If 1,000 shares of Reliance Industries are traded on the NSE between 9:15 AM and 9:30 AM, the trading volume for that period is 1,000 shares.
If 10,000 contracts of Nifty futures are exchanged during the day, then the daily futures volume is 10,000 contracts.
In forex or crypto, volume is often measured in terms of lots or tokens.
Key Point:
Volume measures activity. It does not directly tell you whether people are buying or selling more. It only records the number of transactions. For every buyer, there is always a seller—so volume tells us how many times such exchanges happened, not the direction.
Why is Volume Important in Trading?
Volume is like the heartbeat of the market. Without volume, price movements can be misleading or unreliable. Here’s why it matters:
Confirms Price Trends
If a stock is rising but on low volume, the uptrend may not be sustainable. On the other hand, if the stock is rising with high volume, it suggests strong buying interest and a more reliable uptrend.
Identifies Strength of Breakouts
When price breaks above resistance or below support, traders look at volume. A breakout with high volume is more likely to succeed, while a breakout on low volume often fails.
Indicates Market Participation
High volume means many traders are actively participating, which usually reduces manipulation and increases reliability. Low volume may signal lack of interest or potential traps.
Helps Spot Reversals
Sometimes, a sudden spike in volume during an uptrend or downtrend can indicate exhaustion and reversal. For instance, after a long rally, if volume spikes but price fails to rise further, it may signal distribution.
Used in Technical Indicators
Several technical indicators, like On-Balance Volume (OBV), Volume Weighted Average Price (VWAP), and Volume Profile, are built entirely around volume data.
How is Volume Calculated?
The calculation is straightforward:
In stocks, volume is the total number of shares traded in a given time frame.
In futures and options, it is the number of contracts traded.
In forex, volume is often tick volume, which measures how many times the price changes, since centralized volume data is unavailable.
In cryptocurrency, volume is the number of tokens traded across exchanges.
Example:
If Infosys has 20 lakh shares traded on NSE in a day, then the daily volume is 20 lakh.
Relationship Between Price and Volume
To understand market psychology, traders study how volume behaves relative to price. Here are some classic patterns:
Price Up + Volume Up → Bullish Confirmation
Rising price on rising volume shows strong demand and confirms the uptrend.
Price Up + Volume Down → Weak Rally
If price rises but volume falls, it may signal that fewer participants are pushing the price, often leading to reversals.
Price Down + Volume Up → Bearish Confirmation
Falling price with increasing volume confirms strong selling pressure.
Price Down + Volume Down → Weak Decline
Declining prices with low volume suggest lack of strong sellers; the trend may be temporary.
Tools & Indicators Based on Volume
Traders don’t just look at raw volume numbers. They use tools to interpret volume more effectively:
1. On-Balance Volume (OBV)
OBV adds volume on up days and subtracts volume on down days, creating a running total. Rising OBV confirms bullish pressure, while falling OBV confirms bearish pressure.
2. Volume Profile
Volume Profile shows how much volume occurred at different price levels, not just over time. It helps identify support/resistance zones based on where most trading activity happened.
3. VWAP (Volume Weighted Average Price)
VWAP calculates the average price at which a security has traded throughout the day, weighted by volume. Institutional traders often use VWAP as a benchmark for fair value.
4. Accumulation/Distribution Line
This indicator uses both price and volume to detect whether money is flowing into (accumulation) or out of (distribution) a stock.
5. Chaikin Money Flow (CMF)
CMF combines price and volume to measure buying and selling pressure over a certain period.
Volume Patterns in Trading
Volume often reveals patterns that help traders interpret the market:
High Volume at Breakouts
When a stock breaks out of a range with high volume, it confirms a real move.
Low Volume Breakouts
Often fake moves. If volume is weak, the breakout might not sustain.
Volume Spikes
Sudden surges in volume may indicate big institutional activity, news events, or trend reversals.
Volume Dry-Up
When volume dries up after a trend, it may signal exhaustion or upcoming consolidation.
Climax Volume
Near the end of strong trends, volume may spike dramatically, showing panic buying or selling. This often signals reversals.
Practical Applications of Volume
1. Spotting Trend Continuation
If an uptrend continues with increasing volume, traders stay in the trade confidently.
2. Detecting False Moves
Volume helps avoid traps. For example, a stock breaking resistance with weak volume is a red flag.
3. Day Trading with Volume
Intraday traders often use VWAP and relative volume (RVOL) to judge whether momentum trades are worth taking.
4. Long-Term Investing
Investors also watch volume to confirm whether institutions are accumulating or distributing shares.
Volume in Different Markets
Stock Market: Volume shows investor participation. Stocks with higher volumes are more liquid, making them easier to buy/sell.
Futures & Options: Volume indicates interest in contracts. High option volume often highlights where traders expect big moves.
Forex: Since forex is decentralized, traders use tick volume or broker-provided estimates.
Cryptocurrency: Volume is vital because crypto markets are prone to manipulation. Exchanges often report trading volumes to show liquidity.
Examples from Indian Markets
Reliance Industries Breakout
When Reliance broke past ₹2,000 levels in 2020, it was supported by record-high volumes, confirming strong institutional participation.
Bank Nifty Index Futures
During big events like Union Budget, Bank Nifty futures often see surges in volume, confirming traders’ interest and directional bets.
SME IPOs
Many SME stocks in India show thin volumes after listing, making them risky for retail investors due to low liquidity.
Common Mistakes in Interpreting Volume
Assuming High Volume Always Means Bullish
High volume doesn’t always mean buying. It could also be strong selling. Traders must analyze price action alongside volume.
Ignoring Context
Volume must be compared with historical averages. A spike is meaningful only if it is unusual compared to typical activity.
Relying on One Indicator
Volume should confirm price action, not replace it. Relying solely on volume can be misleading.
Advanced Concepts
Relative Volume (RVOL): Compares current volume to average past volume. RVOL > 2 means twice the usual activity.
Volume Divergence: If price rises but volume falls, it warns of weakening trend.
Dark Pools: Large institutional trades may not immediately show in public volume data, so volume analysis is not always perfect.
Psychological Aspect of Volume
Volume reflects human behavior in markets. Rising volume shows enthusiasm, fear, or greed, while falling volume shows apathy or caution. Big volume often comes from institutions, and spotting their footprints helps retail traders align with the “smart money.”
Conclusion
Volume is one of the most essential elements in trading. It is not just a number—it is a window into market psychology and trader participation. By studying volume along with price, traders can confirm trends, identify breakouts, detect reversals, and avoid false signals.
From simple applications like confirming support/resistance breakouts to advanced tools like VWAP and Volume Profile, volume remains a critical guide for traders across stocks, futures, forex, and crypto.
The key lesson is: Price tells you what is happening, but Volume tells you how strong it is.
Together, they form the foundation of smart trading decisions.
Types of SharesIntroduction
In the world of finance and investing, shares represent one of the most important building blocks. When an individual or institution buys a share, they are essentially purchasing a small unit of ownership in a company. Shares give investors the right to participate in the profits of the company, attend shareholder meetings, and in some cases, vote on critical business decisions.
For companies, issuing shares is a powerful way to raise funds for growth, expansion, research, or debt repayment. Instead of borrowing from banks, businesses can invite the public to invest by offering shares.
However, not all shares are the same. There are different types of shares—each carrying its own rights, responsibilities, and advantages for both the company and the shareholder. Understanding these types is critical for investors, traders, and business owners.
This detailed discussion explores the various types of shares from multiple perspectives—legal, financial, and practical—while also examining their role in India’s corporate structure and the global financial markets.
What is a Share?
A share is the basic unit into which the capital of a company is divided. It represents fractional ownership in the company. If a company has issued 1,00,000 shares and an investor owns 10,000 shares, they effectively own 10% of the company.
Each share has a face value (original issue price), a market value (price at which it trades), and may provide benefits such as:
Dividends: A share in profits distributed to shareholders.
Voting rights: Power to influence company policies and decisions.
Capital appreciation: Increase in the share price over time.
Broad Classification of Shares
In corporate law, especially under the Companies Act, 2013 (India) and globally under common corporate structures, shares are classified into two major categories:
Equity Shares (Ordinary Shares)
Preference Shares
Let us break these down in detail.
1. Equity Shares
Meaning
Equity shares are the most common type of shares issued by a company. They represent ownership with voting rights and entitle holders to dividends, though dividends are not guaranteed. Equity shareholders bear the highest risk but also enjoy highest rewards in terms of capital appreciation.
Features of Equity Shares
Voting rights in company matters.
Dividend depends on profits and company policies.
Higher risk compared to preference shares.
Residual claim in case of liquidation (paid after creditors and preference shareholders).
Types of Equity Shares
Equity shares can further be divided into subcategories:
(a) Based on Rights
Voting Equity Shares – Normal shares with voting power.
Non-Voting Equity Shares – Shares that do not carry voting rights but may offer higher dividends.
(b) Based on Convertibility
Convertible Equity Shares – Can be converted into another type of security like debentures or preference shares after a specific period.
Non-Convertible Equity Shares – Cannot be converted into any other security.
(c) Based on Dividend Rights
Bonus Shares – Issued free of cost to existing shareholders from accumulated profits.
Rights Shares – Offered to existing shareholders at a discounted price before going to the public.
(d) Based on Listing
Listed Equity Shares – Traded on recognized stock exchanges such as NSE, BSE.
Unlisted Equity Shares – Not traded on stock exchanges; often held privately.
2. Preference Shares
Meaning
Preference shares are a special type of share that gives shareholders a priority claim over dividends and assets in case of liquidation. They are called "preference" because they enjoy preference over equity shares in two key respects:
Dividend distribution
Repayment of capital during liquidation
However, preference shareholders usually do not have voting rights, except in special cases (like non-payment of dividend).
Features of Preference Shares
Fixed dividend rate.
Preference in dividend payment and repayment.
Limited or no voting rights.
Considered safer than equity shares but with limited growth potential.
Types of Preference Shares
Cumulative Preference Shares
If the company cannot pay dividends in a particular year, the unpaid dividend is carried forward to future years.
Non-Cumulative Preference Shares
If the company misses dividend payments, shareholders cannot claim them in the future.
Participating Preference Shares
Allow holders to receive additional dividends if the company makes excess profits.
Non-Participating Preference Shares
Holders receive only a fixed dividend and no share in surplus profits.
Convertible Preference Shares
Can be converted into equity shares after a specific period.
Non-Convertible Preference Shares
Cannot be converted into equity shares.
Redeemable Preference Shares
Can be bought back (redeemed) by the company after a fixed period.
Irredeemable Preference Shares
Cannot be redeemed during the lifetime of the company (rare in practice due to regulations).
Other Types of Shares in Practice
Apart from the primary division between equity and preference shares, companies and markets recognize various special categories of shares:
1. Bonus Shares
Issued free of cost to existing shareholders in proportion to their holdings. For example, a 1:1 bonus issue means one extra share for every share held.
2. Rights Shares
Offered to existing shareholders at a discounted price to raise fresh capital without involving outsiders.
3. Sweat Equity Shares
Issued to employees or directors at a discount or for non-cash consideration, as a reward for their contribution to the company.
4. Treasury Shares
Shares that were issued and later bought back by the company, held in its treasury.
5. DVR (Differential Voting Right) Shares
Shares with different voting rights compared to ordinary equity shares. Example: Tata Motors issued DVR shares in India.
Global Classification of Shares
In international markets, shares may also be classified as:
Common Stock – Equivalent to equity shares in India.
Preferred Stock – Equivalent to preference shares.
Class A, B, C Shares – Different classes with varying voting powers and dividend rights (e.g., Google/Alphabet issues Class A, B, C shares).
Legal & Regulatory Framework (India)
In India, shares are governed by:
Companies Act, 2013
SEBI (Securities and Exchange Board of India) regulations
Stock Exchange Rules (NSE, BSE)
The law specifies:
Companies can issue only two main classes: Equity and Preference.
Special variations (like DVR, sweat equity, bonus, rights) must comply with SEBI guidelines.
Importance of Different Types of Shares
For Companies:
Equity shares help raise permanent capital.
Preference shares provide flexible funding without diluting voting control.
Rights/bonus shares help reward and retain existing investors.
For Investors:
Equity shares provide growth and voting rights.
Preference shares provide stable income with lower risk.
DVRs allow participation with limited voting burden.
Advantages & Disadvantages
Equity Shares
✅ Potential for high returns
✅ Voting rights
❌ High risk during market downturns
❌ No fixed income
Preference Shares
✅ Fixed dividend
✅ Safer than equity
❌ Limited upside potential
❌ No major voting rights
Real-Life Examples
Reliance Industries issues equity shares traded on NSE/BSE.
Tata Motors has issued DVR shares in India.
Infosys rewarded employees with sweat equity shares.
Globally, Alphabet (Google) issues Class A (1 vote/share), Class B (10 votes/share), and Class C (no voting rights) shares.
Conclusion
Shares are not just financial instruments—they are a reflection of ownership, risk-taking, and reward-sharing in a company. From equity shares that drive growth and risk, to preference shares that balance safety and income, and special categories like bonus, rights, DVR, and sweat equity, every type of share has a purpose.
For investors, understanding these types allows better portfolio choices. For companies, it ensures effective fundraising and governance.
In short, shares are the foundation of modern capital markets, enabling wealth creation, corporate growth, and economic development.
Part 6 Learn Institutional TradingHow Options are Priced
Options are more complex than stocks because they have two value components:
Intrinsic Value = Difference between spot price and strike price (if profitable).
Time Value = Extra premium traders pay for the possibility of future moves.
The pricing is influenced by The Greeks:
Delta: Sensitivity of option price to underlying asset moves.
Theta: Time decay (options lose value as expiry nears).
Vega: Impact of volatility on option price.
Gamma: Rate of change of delta.
Understanding Greeks is essential for advanced option strategies.
Types of Options
Options exist across asset classes:
Equity Options: Stocks like Reliance, TCS, Infosys.
Index Options: Nifty, Bank Nifty, Sensex.
Currency Options: USD/INR, EUR/INR.
Commodity Options: Gold, Crude oil, Agricultural products.
