Part 2 Ride The Big MovesRisks & Rewards in Options Trading
Unlike stock trading, options have asymmetric risk-reward structures:
Option Buyers: Risk limited to premium paid, but potential profit can be unlimited (for calls) or large (for puts).
Option Sellers (Writers): Profit limited to premium received, but risk can be very high if the market moves sharply.
Hence, option writing is generally done by professional traders with high capital and hedging systems.
Option Trading in India
In India, options trading is regulated by SEBI and conducted on exchanges like NSE and BSE.
Lot Sizes: Options are traded in lots (e.g., Nifty = 50 units, Bank Nifty = 15 units).
Margins: Sellers must deposit margin with brokers to cover risk.
Expiry Cycle: Weekly (indices) and monthly (stocks).
Liquidity: Index options are most liquid (Nifty & Bank Nifty).
Zomato

Part 2 Master Candlestick PatternKey Participants in the Options Market
The options market has a mix of participants:
Hedgers: Protect themselves from risks (institutions, exporters, investors).
Speculators: Try to profit from price moves (retail & professional traders).
Arbitrageurs: Exploit price inefficiencies between cash and derivatives.
Institutions & Banks: Use options for structured products and risk management.
How Options are Priced
Options are more complex than stocks because they have two value components:
Intrinsic Value = Difference between spot price and strike price (if profitable).
Time Value = Extra premium traders pay for the possibility of future moves.
The pricing is influenced by The Greeks:
Delta: Sensitivity of option price to underlying asset moves.
Theta: Time decay (options lose value as expiry nears).
Vega: Impact of volatility on option price.
Gamma: Rate of change of delta.
Understanding Greeks is essential for advanced option strategies.

PCR Trading StrategiesIntroduction to Options Trading
The world of financial markets is vast, offering different ways to invest, trade, and manage risks. Among these instruments, Options have gained immense popularity because they offer flexibility, leverage, and unique strategies that regular stock trading cannot provide.
Options trading is not new—it has been around for decades in global markets—but in recent years, with the rise of online platforms and growing financial literacy, even retail traders are actively participating in it.
At its core, an option is a financial contract that gives the buyer the right, but not the obligation, to buy or sell an underlying asset (like a stock, index, currency, or commodity) at a predetermined price, within a certain period. This ability to choose—without compulsion—is what makes options unique compared to other financial products.
Basics of Options (Calls & Puts)
There are two main types of options:
Call Option: Gives the holder the right to buy the underlying asset at a fixed price (called the strike price) before or on the expiry date.
Example: You buy a Reliance call option with a strike price of ₹2500. If Reliance rises to ₹2700, you can buy at ₹2500 and gain from the difference.
Put Option: Gives the holder the right to sell the underlying asset at the strike price before expiry.
Example: You buy a Nifty put option with a strike price of 22,000. If Nifty falls to 21,500, your put gains in value since you can sell higher (22,000) while the market trades lower.
In simple terms:
Calls = Right to Buy
Puts = Right to Sell

Part 1 Trading Master ClassReal-World Applications of Options
Hedging
Institutions hedge portfolios using index options. For example, buying Nifty puts to protect against market crash.
Income Generation
Funds sell covered calls or iron condors to earn steady income.
Event-Based Trading
Earnings announcements, policy changes, and global events cause volatility—ideal for straddles or strangles.
Speculation with Leverage
Traders use calls/puts for leveraged bets on short-term moves.
Pros and Cons of Options Trading
Pros
Flexibility in strategy.
Limited risk (for buyers).
High leverage.
Ability to profit in all market conditions.
Cons
Complexity.
Time decay erodes value of options.
Volatility risk.
Unlimited risk (for sellers).

Divergence SectersIntermediate Options Strategies
These involve combining calls and puts to create structured payoffs.
Bull Call Spread
Outlook: Moderately bullish.
How it works: Buy a call (lower strike), sell another call (higher strike).
Risk: Limited to net premium.
Reward: Limited to strike difference minus premium.
Example: Buy ₹100 call at ₹5, sell ₹110 call at ₹2. Net cost ₹3. Max profit = ₹7.
Bear Put Spread
Outlook: Moderately bearish.
How it works: Buy a put (higher strike), sell another put (lower strike).
Risk: Limited to net premium.
Reward: Limited.
Iron Condor
Outlook: Neutral, low volatility.
How it works: Sell OTM call and put, buy further OTM call and put.
Risk: Limited.
Reward: Premium collected.
Best for: Range-bound markets.
Straddle
Outlook: Expect big move (up or down).
How it works: Buy one call and one put at same strike/expiry.
Risk: High premium cost.
Reward: Unlimited if strong move.
Strangle
Outlook: Expect volatility but uncertain direction.
How it works: Buy OTM call + OTM put.
Risk: Lower premium than straddle.
Reward: Unlimited if strong price move.

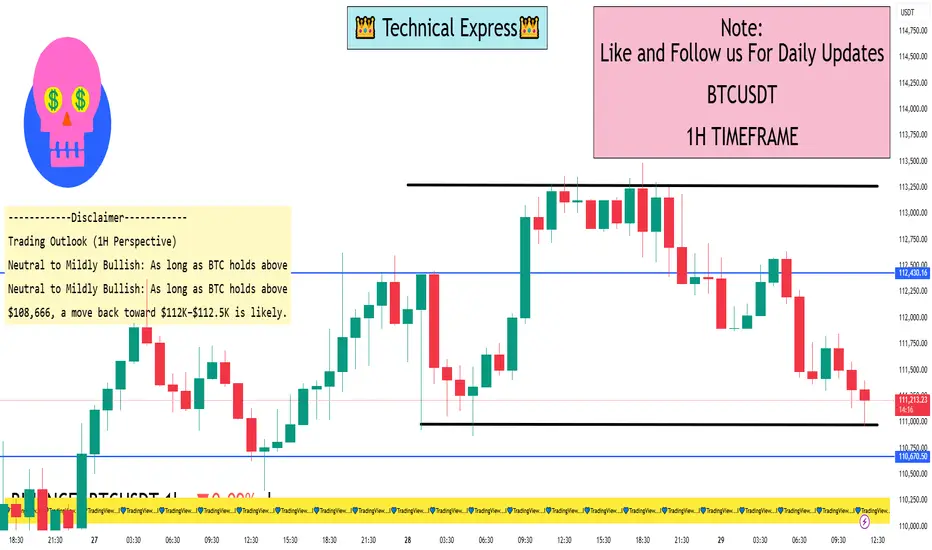
BTC/USDT 1 Hour View1-Hour Technical Snapshot
Key Levels
Support Zones:
~$110,000–$110,600 — viewed as a critical short-term support / demand area. It’s where BTC could stabilize if the current slide continues
~$108,666 — a deeper support level; a break below this risks a pullback toward $101,000, near the 200-day moving average
Resistance Zones:
~$112,000–$112,500 — a key resistance or supply area, with potential selling pressure around this range
~$124,474 — the recent monthly closing high and psychologically significant level; clearing this would be a strong bullish confirmation
Market Sentiment & Setup
Bullish Case: BTC sitting near $111,600 is seen by some analysts as a potential entry zone for a bullish continuation pattern (like a bull flag). A break above $115,544 (20-day SMA) could fuel a push toward $125,000
Bearish Risk: If $108,666 support fails, the risk is for a deeper drop toward $101,000, negating the bullish setup
Other indicator-based technical analysis tools (like TradingView’s technical summary) reflect a neutral bias on 1H charts, while longer-term timeframes lean more bullish
Algorithmic & Quantitative TradingIntroduction
Trading has evolved dramatically over the past few decades. From the days of shouting bids in open-outcry pits to today’s ultra-fast trades executed in milliseconds, technology has transformed how markets operate. Two of the most important concepts in this transformation are algorithmic trading and quantitative trading.
At their core, both involve using mathematics, statistics, and technology to make trading decisions instead of relying purely on human judgment. While traditional traders might rely on intuition, news, and gut feeling, algo and quant traders build rules, models, and systems to trade with consistency and efficiency.
In this comprehensive guide, we’ll dive into:
The basics of algorithmic & quantitative trading.
Their differences and overlaps.
The strategies they use.
The technologies and tools behind them.
Risks, challenges, and regulatory aspects.
The future of algo & quant trading.
By the end, you’ll understand how these forms of trading dominate global financial markets today.
1. Understanding Algorithmic Trading
Definition
Algorithmic trading (often called algo trading) is the process of using computer programs and algorithms to automatically place buy or sell orders in financial markets. The algorithm follows a set of predefined instructions based on variables like:
Price
Volume
Timing
Technical indicators
Market conditions
The key idea is automation: once the rules are programmed, the system executes trades without manual intervention.
Why Algorithms?
Speed: Computers can process data and execute trades in milliseconds, far faster than humans.
Accuracy: Algorithms eliminate emotional decision-making.
Efficiency: They can scan thousands of instruments simultaneously.
Consistency: Strategies are applied without deviation or hesitation.
Examples of Algo Trading in Action
A program that buys stock when its 50-day moving average crosses above its 200-day moving average.
A system that places trades when prices deviate 1% from fair value in futures vs. spot markets.
High-frequency algorithms that profit from microsecond price differences across exchanges.
2. Understanding Quantitative Trading
Definition
Quantitative trading (quant trading) uses mathematical and statistical models to identify trading opportunities. Instead of intuition, it relies on data-driven analysis of price patterns, volatility, correlations, and probabilities.
In simple words:
Algo trading = How trades are executed.
Quant trading = How strategies are designed using math and data.
Many traders combine both: they design quantitative strategies and then execute them algorithmically.
Why Quantitative?
Markets are complex and noisy. Statistical models help filter out randomness.
Data-driven strategies can uncover hidden opportunities humans can’t easily spot.
Backtesting allows quants to test ideas on historical data before risking real money.
Quantitative Models Used
Mean Reversion Models – assuming prices return to their average over time.
Trend-Following Models – capturing momentum in markets.
Statistical Arbitrage Models – exploiting mispricings between correlated assets.
Machine Learning Models – using AI to adapt and predict market moves.
3. Algo vs. Quant Trading: Key Differences
Although often used interchangeably, there are subtle differences:
Feature Algorithmic Trading Quantitative Trading
Focus Execution of trades using automation Strategy design using math & statistics
Tools Algorithms, order routing systems Models, statistical analysis, simulations
Objective Speed, precision, automation Finding profitable patterns
Example VWAP (Volume Weighted Average Price) execution algorithm Pairs trading based on correlation
In practice, quant trading often leads to algo trading:
Quants design models.
Those models are turned into algorithms.
Algorithms execute trades automatically.
4. Key Strategies in Algorithmic & Quantitative Trading
Both algo and quant trading employ a wide variety of strategies. Let’s explore them in depth.
A. Trend-Following Strategies
Based on the belief that prices tend to move in trends.
Uses tools like moving averages, momentum indicators, and breakout levels.
Example: Buy when 50-day MA > 200-day MA (Golden Cross).
B. Mean Reversion Strategies
Assumes prices revert to their average over time.
Tools: Bollinger Bands, RSI, Z-score analysis.
Example: If stock deviates 2% from its mean, bet on reversal.
C. Arbitrage Strategies
Exploit price discrepancies between related securities.
Statistical Arbitrage – trading correlated assets (like Coke vs. Pepsi).
Merger Arbitrage – trading on price gaps during acquisitions.
Index Arbitrage – between index futures and underlying stocks.
D. Market-Making Strategies
Provide liquidity by continuously quoting buy and sell prices.
Profit comes from the bid-ask spread.
Requires ultra-fast systems.
E. High-Frequency Trading (HFT)
Subset of algo trading with extremely high speed.
Millisecond or microsecond execution.
Often used for arbitrage, market making, and exploiting tiny inefficiencies.
F. Machine Learning & AI-Based Strategies
Use large datasets and predictive models.
Neural networks, reinforcement learning, and deep learning applied to market data.
Example: Predicting volatility spikes or option price movements.
G. Execution Algorithms
These are not designed to predict prices but to optimize order execution:
VWAP (Volume Weighted Average Price) – executes in line with average traded volume.
TWAP (Time Weighted Average Price) – spreads order evenly over time.
Iceberg Orders – hides large orders by breaking them into small chunks.
5. Tools & Technologies Behind Algo & Quant Trading
Trading at this level requires robust infrastructure.
A. Data
Historical Data – for backtesting strategies.
Real-Time Data – for live execution.
Alternative Data – satellite images, social media, news sentiment, credit card usage, etc.
B. Programming Languages
Python – easy, rich libraries (pandas, numpy, scikit-learn).
R – strong for statistics and visualization.
C++/Java – high-speed execution.
MATLAB – research-heavy environments.
C. Platforms
MetaTrader, NinjaTrader, Amibroker – retail algo platforms.
Interactive Brokers API, FIX protocol – institutional-grade.
D. Infrastructure
Low-latency servers close to exchange data centers.
Cloud computing for scalability.
Databases (SQL, NoSQL) to handle terabytes of data.
6. Advantages of Algo & Quant Trading
Speed – execute trades in milliseconds.
Emotion-Free – avoids greed, fear, panic.
Backtesting – test before risking capital.
Diversification – manage thousands of instruments simultaneously.
Liquidity Provision – improves market efficiency.
Scalability – one strategy can be deployed globally.
7. Risks & Challenges
Despite advantages, algo & quant trading face serious risks.
A. Market Risks
Models might fail during extreme market conditions.
Example: 2008 financial crisis saw many quant funds collapse.
B. Technology Risks
Latency issues.
Software bugs leading to erroneous trades (e.g., Knight Capital loss of $440M in 2012).
C. Overfitting in Models
A strategy may look profitable in historical data but fail in real-time.
D. Regulatory Risks
Authorities impose strict rules to avoid market manipulation.
Example: SEBI in India regulates algo orders with checks on co-location and latency.
E. Ethical Risks
HFT firms sometimes exploit slower participants.
Raises fairness concerns.
8. Algo & Quant Trading in Global Markets
US & Europe: Over 60-70% of equity trading is algorithmic.
India: Around 50% of trades on NSE are algorithm-driven, with growing adoption.
Emerging Markets: Adoption is slower but rising as infrastructure improves.
Major players include:
Citadel Securities
Renaissance Technologies
Two Sigma
DE Shaw
Virtu Financial
9. Regulations Around Algo Trading
Different regulators have implemented measures:
SEC (US) – Market access rule, risk controls for algos.
MiFID II (Europe) – Transparency and monitoring of algo strategies.
SEBI (India) – Approval for brokers, limits on co-location, kill switches for runaway algos.
The aim is to balance innovation with market stability.
10. The Future of Algo & Quant Trading
The next decade will see major shifts:
AI & Deep Learning – self-learning trading models.
Quantum Computing – solving optimization problems faster.
Blockchain & Smart Contracts – decentralized, transparent execution.
Alternative Data Explosion – satellite data, IoT, ESG metrics.
Retail Algo Access – democratization through APIs and brokers.
Markets will become more data-driven, automated, and technology-intensive.
Conclusion
Algorithmic and quantitative trading represent the intersection of finance, mathematics, and technology. Together, they have reshaped global markets by making trading faster, more efficient, and more complex.
Algorithmic trading focuses on execution automation.
Quantitative trading focuses on designing mathematically-driven strategies.
From trend-following to machine learning, from VWAP execution to HFT, these approaches dominate today’s trading world.
However, with great power comes great risk—overreliance on models, tech glitches, and ethical debates remain.
Looking ahead, advancements in AI, alternative data, and quantum computing will further revolutionize how markets operate. For traders, investors, and policymakers, understanding these dynamics is crucial.

Futures & Options (F&O) TradingIntroduction
Futures and Options (commonly known as F&O) are among the most exciting segments of financial markets. They fall under the category of derivatives trading, meaning their value is derived from an underlying asset such as stocks, commodities, currencies, or indices.
Unlike simple buying and selling of shares, F&O trading allows investors to hedge risks, speculate on price movements, and even leverage small capital into big trades. However, it also carries high risk and requires deep understanding.
This guide will cover:
What F&O trading is
How futures work
How options work
Key terms
Strategies used
Advantages & risks
Practical examples
Psychology of F&O trading
Regulations in India
Final thoughts for beginners
By the end, you’ll have a solid foundation in F&O trading.
Part 1: Understanding Derivatives
What are Derivatives?
A derivative is a financial contract whose value depends on the price of an underlying asset. For example, if you buy a derivative linked to Reliance Industries stock, its value will move as Reliance’s stock price moves.
Derivatives can be of many types:
Futures
Options
Forwards
Swaps
In India, the most popular are Futures and Options (F&O).
Part 2: Futures Trading
What are Futures?
A futures contract is an agreement between two parties to buy or sell an asset at a predetermined price on a future date.
Buyer of futures: Agrees to buy the asset in future.
Seller of futures: Agrees to sell the asset in future.
Both are obligated to honor the contract on expiry.
Key Features of Futures:
Standardized contracts – traded on exchanges (like NSE, BSE).
Leverage – You pay only a margin (a fraction of total value).
Settlement – Can be cash-settled or delivery-based.
Expiry dates – Futures have fixed expiry (weekly, monthly, quarterly).
Example of Futures:
Suppose Reliance stock is trading at ₹2,500.
You buy a Reliance Futures contract (lot size 250 shares).
Contract value = ₹2,500 × 250 = ₹6,25,000.
But you don’t pay full amount, only margin (say 15% = ₹93,750).
If Reliance rises to ₹2,600, your profit = (100 × 250) = ₹25,000.
If Reliance falls to ₹2,400, your loss = ₹25,000.
So, futures magnify both profit and loss.
Part 3: Options Trading
What are Options?
Options are more flexible than futures. An option gives the buyer the right, but not the obligation, to buy or sell the underlying asset at a fixed price on or before expiry.
There are two types of options:
Call Option (CE): Right to buy.
Put Option (PE): Right to sell.
Key Terms in Options:
Strike Price: Pre-decided price at which option can be exercised.
Premium: Price paid by buyer to seller of option.
Option Buyer: Has rights, limited risk (loss = premium).
Option Seller (Writer): Has obligation, unlimited risk but limited profit (premium received).
Example of Call Option:
Reliance at ₹2,500.
You buy a Call Option (CE) 2600 strike, expiring in 1 month, paying ₹20 premium.
Lot size = 250. Total premium paid = ₹5,000.
If Reliance goes to ₹2,700 before expiry:
Option value = ₹100 (intrinsic value).
Profit = (100 - 20) × 250 = ₹20,000.
If Reliance stays below ₹2,600, option expires worthless.
Loss = only premium paid (₹5,000).
So, options limit risk for buyers but sellers face higher risk.
Part 4: Comparison – Futures vs Options
Feature Futures Options
Obligation Buyer & seller both obligated Buyer has right, seller has obligation
Risk High (both sides) Limited for buyer, unlimited for seller
Cost Margin required Premium required
Profit Potential Unlimited both ways Unlimited for buyer, limited for seller
Best for Speculation & hedging Hedging, speculation, income strategies
Part 5: Why Trade F&O?
1. Hedging
Investors use F&O to protect portfolios from adverse price movements.
Example: An investor holding Reliance shares can buy a Put Option to protect against downside.
2. Speculation
Traders use leverage to bet on market movements.
3. Arbitrage
Taking advantage of price differences between cash market and F&O.
4. Income Generation
Selling (writing) options to earn premium.
Part 6: Important Concepts in F&O
Leverage & Margin – You control large value with small capital.
Mark-to-Market (MTM) – Futures contracts are settled daily.
Time Decay (Theta) – Options lose value as expiry nears.
Implied Volatility (IV) – Measures expected price swings.
Greeks in Options – Delta, Gamma, Vega, Theta, Rho – help manage risk.
Part 7: Common F&O Strategies
Futures Strategies:
Long Futures – Buy if you expect rise.
Short Futures – Sell if you expect fall.
Options Strategies:
Covered Call – Hold stock + sell call.
Protective Put – Hold stock + buy put (insurance).
Straddle – Buy call + buy put (expect big move).
Strangle – Buy out-of-money call & put.
Iron Condor – Combination to earn premium in sideways market.
Part 8: Risks in F&O Trading
High Leverage Risk – Small moves can wipe out capital.
Time Decay in Options – Value erodes with time.
Volatility Risk – Sudden moves may cause losses.
Liquidity Risk – Some contracts have low trading volume.
Psychological Pressure – High stress and emotions.
Part 9: F&O in India
Introduced in 2000 (NSE).
Most popular: Index Futures & Options (Nifty, Bank Nifty).
Also available: Stock futures, stock options, currency derivatives, commodity derivatives.
Regulated by SEBI (Securities and Exchange Board of India).
Lot Sizes in India
Each F&O contract has a fixed lot size decided by SEBI (e.g., Nifty lot = 50 units).
Expiry Cycle
Index Options: Weekly & monthly expiry.
Stock Options: Monthly expiry.
Part 10: Psychology of F&O Trading
Success in F&O is not just about knowledge, but also about mindset:
Discipline – Stick to stop-loss and plan.
Patience – Wait for right setup.
Emotional Control – Don’t let greed/fear drive decisions.
Risk Management – Never risk more than 1–2% of capital in one trade.
Conclusion
Futures & Options (F&O) trading is a double-edged sword. It offers leverage, hedging, and high profit potential, but also comes with complexity and high risk.
For beginners:
Start with options buying (limited risk).
Learn basic strategies like covered call, protective put.
Always use stop-loss.
Treat F&O as a tool for hedging first, speculation second.
With proper knowledge, discipline, and risk management, F&O can become a powerful addition to an investor’s toolkit.
Part 2 Master Candlestick PatternAdvanced Strategies for Experienced Traders
If you’ve mastered the basics, here are some advanced setups:
Bull Call Spread → Buy 1 Call, Sell higher strike Call.
Bear Put Spread → Buy 1 Put, Sell lower strike Put.
Butterfly Spread → Profit from low volatility (range-bound market).
Calendar Spread → Buy long-term option, sell short-term option.
These strategies help balance risk vs reward.
SEBI Regulations & Margins
In India, SEBI ensures options trading is safe:
Option sellers must keep high margins.
Brokers must collect upfront premiums.
Intraday exposure limits are monitored.
This protects retail traders from excessive risks.

Part 1 Master Candlestick PatternOptions in the Indian Stock Market
In India, options trading is booming, especially in:
Nifty & Bank Nifty (Index options).
Stock Options (Reliance, TCS, HDFC Bank, etc.).
👉 Interesting fact: Over 90% of trading volume in NSE comes from options today.
Expiry days (Thursdays for weekly index options) see massive action, as traders bet on final movements.
The Power of Weekly Options
Earlier, only monthly options were available. Now NSE has weekly expiries for Nifty, Bank Nifty, and even stocks.
Weekly options = cheaper premiums.
Traders use them for intraday or short-term bets.
But time decay is very fast.

Trading Master Class With ExpertsReal-Life Applications of Options
Options are not just trading tools; they have practical uses:
Insurance companies use options to hedge portfolios.
Exporters/Importers hedge currency risks using options.
Banks use interest rate options to manage risk.
Investors use protective puts to safeguard their stock portfolios.
Psychology of Options Trading
Trading options requires discipline. Many beginners blow up accounts because:
They buy cheap OTM options hoping for jackpots.
They ignore time decay.
They overtrade due to low cost of entry.
A successful option trader thinks like a risk manager first, profit seeker second.

Part 6 Institutional Trading The Greeks: The Math Behind Options
Advanced traders use Greeks to understand risks.
Delta → Sensitivity of option price to stock price movement.
Gamma → Rate of change of Delta.
Theta → Time decay (how much option loses daily).
Vega → Sensitivity to volatility.
Rho → Sensitivity to interest rates.
Example:
A Call with Delta = 0.6 → If stock rises ₹10, option rises ₹6.
Theta = –5 → Option loses ₹5 daily as time passes.
Options vs Futures
Both are derivatives, but with a key difference:
Futures → Obligation to buy/sell at a price.
Options → Right, not obligation.
Example:
Futures are like booking a hotel room—you must pay whether you stay or not.
Options are like paying for a movie ticket—if you don’t watch, you lose only ticket price.

Part 4 Institutional Trading Simple Option Strategies
Options allow creativity. Instead of just buying/selling, traders create strategies by combining calls & puts.
a) Protective Put
Buy stock + Buy Put option = Insurance against downside.
b) Covered Call
Own stock + Sell Call option = Earn income if stock stays flat.
c) Straddle
Buy Call + Buy Put (same strike, same expiry) = Profit from big moves either way.
d) Strangle
Buy OTM Call + OTM Put = Cheaper than straddle but requires bigger move.
e) Iron Condor
Sell OTM Call + OTM Put, while buying further OTM options = Profit if market stays in range.
These are just a few. Professional traders use dozens of strategies depending on market condition.
Risks in Options Trading
Options are attractive, but risky too.
Time Decay (Theta) → Every day, options lose value as expiry approaches.
Wrong Direction → If your view is wrong, you lose the premium.
Liquidity Risk → Some strikes may have no buyers/sellers.
Over-Leverage → Small premium tempts traders to overtrade, leading to big losses.

Part 1 Ride The Big MovesKey Terminologies in Options
Before diving deeper, you need to know the “language of options.”
Strike Price → The fixed price at which you can buy/sell (like 2500 in Reliance example).
Premium → The cost you pay to buy an option.
Expiry Date → Options have a life—weekly, monthly, quarterly. After expiry, they are worthless.
Lot Size → Options are not traded in single shares. They come in fixed quantities called lots (e.g., Nifty lot size = 50).
In the Money (ITM) → Option has intrinsic value.
Out of the Money (OTM) → Option has no value (only time value).
At the Money (ATM) → Strike price = Current market price.
How Option Prices Are Decided
Option premiums are not random. They are influenced by:
Intrinsic Value (IV) → Difference between current price and strike price.
Example: Reliance at ₹2600, Call 2500 → Intrinsic value = ₹100.
Time Value → More time till expiry = higher premium.
Volatility → If a stock is volatile, options are expensive because chances of big movement are high.
Interest rates & Dividends → Minor but relevant in longer-term options.

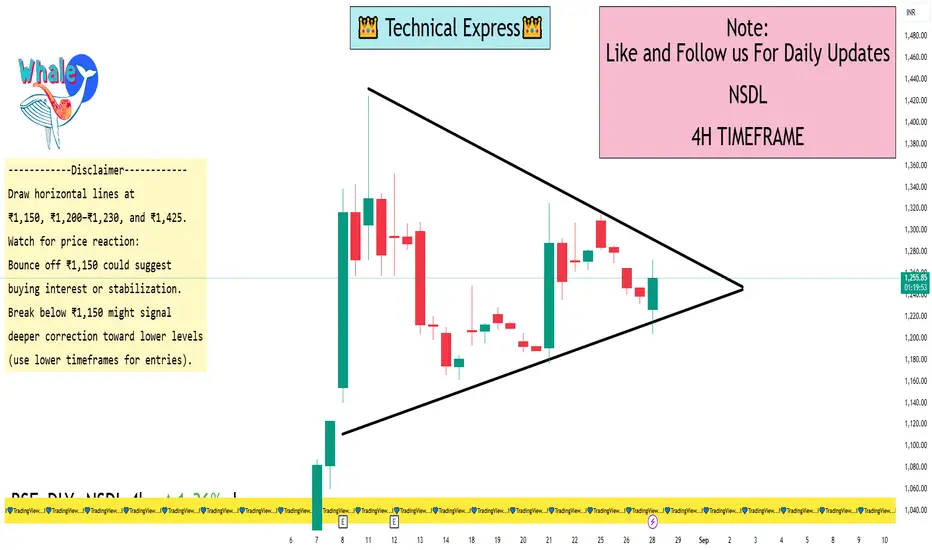
NSDL 4 Hour ViewKey Levels to Watch
Support Levels
₹1,150 — Analysts highlight this as a critical support. Post-Q1, NSDL dropped nearly 9% in two sessions, and ₹1,150 is seen as a potential line of defense. A break below may lead to sharper losses.
₹1,200–₹1,230 — Near the stock's current region (around ₹1,237), which can act as a short-term base due to recent consolidation and VWAP alignment.
Resistance Levels
₹1,425 — The recent all-time high reached after a strong post-IPO rally. Forms a clear resistance zone.
Technical Context & Market Sentiment
Recent Rally: NSDL surged ~78% from its ₹800 IPO price and ~62% from its ₹880 listing price, peaking near ₹1,425.
Profit Booking: The sharp decline post-Q1 earnings reflects investor caution and stretched valuations, reinforcing the significance of the ₹1,150 level.
How to Use These Levels on Your 4-Hour Chart
Draw horizontal lines at ₹1,150, ₹1,200–₹1,230, and ₹1,425.
Watch for price reaction:
Bounce off ₹1,150 could suggest buying interest or stabilization.
Break below ₹1,150 might signal deeper correction toward lower levels (use lower timeframes for entries).
Advances toward ₹1,425 could reignite bullish momentum if volume supports the move.
Combine with indicators:
Moving Averages (e.g., 20/50 EMA) — can offer dynamic support/resistance.
RSI/MACD — monitor for divergence or overbought/oversold conditions to time entries or exits.
Confirm before acting:
Look for candlestick signals (pin bars, engulfing patterns) around these zones.
Volume spikes on breakouts or bounces add conviction.
F&O Trading & SEBI Regulations1. Introduction
The Indian stock market has seen remarkable growth over the last few decades, and one of the most fascinating areas of this growth has been in derivatives trading. Derivatives are financial instruments that derive their value from an underlying asset, and in India, the most widely traded derivatives are Futures and Options (F&O).
F&O trading allows investors and traders to participate in the price movement of stocks, indices, and commodities without necessarily owning them. It provides opportunities to hedge risks, speculate, and arbitrage.
However, with great power comes great responsibility. The Securities and Exchange Board of India (SEBI)—the market regulator—plays a crucial role in ensuring that F&O trading does not turn into a high-risk gamble for unsuspecting investors. SEBI lays down strict rules and guidelines to maintain market integrity, protect investors, and reduce systemic risks.
This article will give you a comprehensive understanding of F&O trading and SEBI’s regulations governing it.
2. Understanding Derivatives
Before diving into F&O, let’s clarify what derivatives are.
A derivative is a financial contract whose value depends on the performance of an underlying asset. In India, the underlying assets include:
Equity shares (like Reliance, Infosys, HDFC Bank)
Stock indices (like Nifty 50, Bank Nifty)
Commodities (like gold, crude oil)
Currencies (like USD/INR)
Types of derivatives:
Forwards – Customized contracts between two parties, traded over-the-counter (OTC).
Futures – Standardized contracts traded on exchanges like NSE & BSE.
Options – Contracts that give the right, but not the obligation, to buy or sell an asset.
Swaps – Mostly used in currency and interest rate markets.
In India, Futures and Options are the most liquid and popular derivative instruments, especially in the stock market.
3. What is F&O Trading?
3.1 Futures
A Futures contract is an agreement to buy or sell an underlying asset at a predetermined price on a specific date in the future.
Example: If you buy Nifty Futures at 20,000 today, you are betting that Nifty will be above 20,000 on the expiry date.
If Nifty rises to 20,500, you make a profit.
If Nifty falls to 19,500, you incur a loss.
3.2 Options
An Options contract gives the buyer the right but not the obligation to buy or sell the underlying asset at a predetermined price.
Two types of options:
Call Option (CE): Right to buy.
Put Option (PE): Right to sell.
Example:
If you buy Reliance Call Option at ₹2,500 strike, you profit if Reliance moves above ₹2,500.
If you buy Reliance Put Option at ₹2,500 strike, you profit if Reliance falls below ₹2,500.
Options also have premium, strike price, and expiry terms.
3.3 Why do people trade F&O?
Hedging: Protecting investments from adverse price movements.
Speculation: Betting on price movements for profit.
Arbitrage: Exploiting price differences between markets.
Leverage: Controlling large positions with small capital.
4. Growth of F&O Trading in India
The Indian F&O market has grown tremendously since it was introduced in 2000. NSE and BSE both offer equity derivatives, but NSE has emerged as the dominant player.
Key reasons for popularity:
High liquidity in index derivatives like Nifty 50 & Bank Nifty.
Opportunity for intraday traders to capture price swings.
Low margin requirements compared to cash market.
Availability of weekly options.
However, SEBI has also noticed risks—especially from retail investors treating F&O like gambling, leading to heavy losses. Reports show that nearly 9 out of 10 retail traders lose money in F&O trading.
This has pushed SEBI to tighten regulations.
5. SEBI’s Role in Regulating F&O
The Securities and Exchange Board of India (SEBI) is the watchdog of Indian financial markets. Its mission is to:
Protect investor interests.
Promote fair and efficient markets.
Regulate intermediaries and stock exchanges.
Minimize systemic risks.
For F&O trading, SEBI has set strict rules, margins, disclosures, and eligibility criteria.
6. SEBI Regulations on F&O Trading
Let’s explore the major regulations SEBI has imposed:
6.1 Eligibility of Stocks for Derivatives
Not all stocks can be traded in F&O. To qualify:
The stock must have a minimum market capitalization of ₹5,000 crore.
Average daily traded value should be high.
Adequate liquidity must exist.
Price band restrictions and surveillance mechanisms should be applicable.
This ensures that only liquid and stable stocks are allowed in F&O.
6.2 Contract Specifications
SEBI mandates standardization of contracts:
Lot size: Minimum notional value (₹5-10 lakhs).
Expiry: Monthly & weekly expiries.
Strike intervals: Based on stock/index price range.
Tick size: ₹0.05 for equity derivatives.
This standardization prevents manipulation.
6.3 Margin Requirements
Margins are crucial in derivatives as they are leveraged products.
Types of margins:
SPAN Margin – Based on risk of position.
Exposure Margin – Additional buffer.
Premium Margin – For option buyers.
Mark-to-Market (MTM) Margin – Daily settlement of gains/losses.
This ensures that traders have skin in the game and cannot default.
6.4 Risk Mitigation Measures
Daily price bands for stocks in derivatives.
Position limits for clients, members, and FIIs.
Ban periods for stocks crossing OI (Open Interest) limits.
Intraday monitoring of margins and positions.
6.5 Disclosure Requirements
Brokers must give risk disclosure documents before enabling F&O trading.
Investors must sign an agreement acknowledging risks.
Margin details and exposure reports are sent via SMS/email daily.
6.6 Segregation of Clients’ Funds
Brokers must segregate their own funds from clients’ funds. Misuse of client collateral is strictly prohibited.
6.7 Investor Protection & Education
SEBI regularly issues advisories warning retail traders about F&O risks.
Investor education campaigns (e.g., “Options are not lottery tickets”).
Free online resources for risk management.
7. SEBI’s New Regulations (Recent Developments)
In the last few years, SEBI has tightened norms further:
Peak Margin Reporting (2021):
Traders must maintain full margin upfront.
No more leveraging via intraday tricks.
Intraday Leverage Ban (2022):
Brokers cannot offer more than 20% margin funding.
This reduced excessive speculation.
Increased Disclosure of F&O Risks (2023-24):
Exchanges must display warnings showing percentage of retail traders losing money.
Eligibility Tightening (2023):
SEBI proposed reviewing stocks in derivatives regularly. Illiquid stocks may be excluded.
Investor Suitability Check (2024 Proposal):
Only financially literate and risk-capable investors may be allowed in F&O in future.
8. Benefits of SEBI Regulations
Market Stability: Prevents manipulation and speculation bubbles.
Investor Protection: Safeguards retail traders from blind gambling.
Transparency: Standardized contracts and disclosure norms.
Risk Management: Margins and limits reduce systemic collapse.
Trust in Markets: Encourages more participation in regulated environment.
9. Challenges & Criticisms
Despite SEBI’s efforts, challenges remain:
Retail Traders’ Losses: Majority still lose money due to lack of knowledge.
Over-regulation Concerns: Some argue SEBI rules reduce liquidity.
Complexity: F&O remains difficult for beginners despite regulations.
Broker Malpractices: Some brokers mis-sell options strategies to clients.
Speculative Craze: Many traders treat weekly options like gambling.
10. Future of F&O Trading in India
Looking ahead:
F&O will remain the largest contributor to market volumes.
SEBI may bring financial literacy tests before allowing retail traders.
More focus on institutional participation and reducing retail over-exposure.
Increased use of AI-driven surveillance to detect manipulation.
Potential restrictions on weekly options if speculation rises.
Conclusion
Futures and Options trading is an exciting and powerful tool in the financial markets, offering opportunities for hedging, speculation, and arbitrage. But it is also risky, especially for retail investors without proper knowledge and discipline.
The Securities and Exchange Board of India (SEBI) plays a vital role in ensuring that F&O trading remains fair, transparent, and not a casino for retail investors. Its regulations on eligibility, margins, disclosures, and risk management are designed to create a balance between freedom and protection.
As India’s capital markets continue to grow, SEBI’s regulations will evolve further. Traders must remember that regulations are not restrictions but safeguards—helping ensure that markets grow sustainably while protecting investors.
The future of F&O in India is bright, but only if traders approach it with knowledge, discipline, and respect for risk management.

IPOs & SME IPOs BoomIntroduction
The world of stock markets has always fascinated investors, traders, and even common people who might not actively trade but follow financial news. One term that grabs headlines again and again is IPO (Initial Public Offering). An IPO is when a private company decides to raise money from the public by offering its shares for the first time.
In recent years, especially in India and several emerging markets, IPOs have witnessed a boom. Not just large companies, but even SMEs (Small and Medium Enterprises) are coming forward to list themselves on SME exchanges through SME IPOs.
This IPO & SME IPO boom reflects not only investor enthusiasm but also the maturity of financial markets, government policies, and the rising appetite of retail investors who now want to participate in the growth stories of businesses right from the early stage.
This article will give you a comprehensive 3000-word explanation of IPOs and SME IPOs boom, in simple yet detailed language.
Part 1: What is an IPO?
Definition
An IPO (Initial Public Offering) is the process by which a private company offers its shares to the public for the first time. After listing, the company’s shares can be traded on stock exchanges such as NSE or BSE in India, or NASDAQ and NYSE in the US.
Key Objectives of an IPO
Raising Capital – To fund expansion, repay debt, or improve working capital.
Brand Visibility – Being listed increases brand credibility.
Liquidity for Promoters – Founders and early investors can sell part of their stake.
Public Participation – Gives retail and institutional investors a chance to own part of the company.
IPO Process in Brief
Appointing Merchant Bankers (Lead Managers)
Regulatory Approval (SEBI in India, SEC in US, etc.)
Draft Red Herring Prospectus (DRHP) Filing
IPO Marketing & Roadshows
Price Band & Book-Building
IPO Subscription by Investors
Allotment & Refunds
Listing on Stock Exchange
Part 2: What is an SME IPO?
Definition
An SME IPO is an IPO specifically designed for Small and Medium Enterprises. These are businesses that may not yet have the size or turnover to list directly on the main board of the stock exchange.
India has two major SME platforms:
BSE SME Exchange
NSE EMERGE
Key Features of SME IPOs
Minimum post-issue paid-up capital: ₹3 crore.
Investors: Retail, HNIs, and institutional investors.
Lower compliance requirements compared to mainboard IPOs.
Ticket size for investment is usually smaller.
Acts as a bridge for small businesses to access capital markets.
Objectives of SME IPOs
To provide SMEs with growth capital.
To create liquidity for promoters and investors.
To give SMEs recognition and credibility.
To act as a stepping stone for listing on the main board in future.
Part 3: Why IPOs & SME IPOs are Booming
The boom in IPOs and SME IPOs can be attributed to several factors:
1. Strong Investor Participation
Retail investors have become more active in financial markets, thanks to digital trading apps, UPI-based IPO bidding, and low-cost brokerage accounts.
2. Liquidity in the Market
Post-pandemic, central banks infused liquidity into the financial system. Investors had surplus money to deploy in equity markets, fueling IPO demand.
3. India’s Economic Growth Story
India is among the fastest-growing economies. Global investors want to participate in India’s growth via IPOs.
4. Success Stories of Past IPOs
Many IPOs delivered stellar listing gains (Zomato, Nykaa, MapmyIndia, IRCTC, etc.), creating investor confidence.
5. SME Sector Growth
SMEs form the backbone of India’s economy, contributing nearly 30% to GDP and 40% to exports. SME IPOs are now seen as a lucrative way to fund this growth.
6. Regulatory Push
SEBI and exchanges have simplified rules, making IPO participation easier for retail investors and listing smoother for companies.
7. Rising Financial Awareness
Mutual funds, social media, and financial influencers have educated people about IPO investing.
Part 4: Benefits of IPOs & SME IPOs
For Companies
Access to large capital pool.
Improved brand image and trust.
Ability to attract and retain talent (ESOPs).
Liquidity for promoters.
For Investors
Opportunity to invest early in a growing company.
Potential for high listing gains.
Long-term wealth creation.
Portfolio diversification.
For the Economy
Mobilizes savings into productive assets.
Boosts entrepreneurship.
Strengthens capital markets.
Enhances corporate governance.
Part 5: Risks & Challenges
Despite the boom, IPOs and SME IPOs carry risks:
Overvaluation – Companies may come at expensive valuations.
Market Volatility – IPO success depends heavily on market sentiment.
Liquidity Risks in SME IPOs – Trading volumes are often lower.
Short-Term Speculation – Many investors enter just for listing gains.
Regulatory Burden – SMEs may struggle with compliance post-listing.
Part 6: Case Studies of IPO & SME IPO Boom
Mainboard IPOs (India)
Zomato (2021) – One of India’s most hyped IPOs, raised ₹9,375 crore.
Nykaa (2021) – Strong listing, became a household name.
LIC (2022) – India’s biggest IPO, raised ₹21,000+ crore.
SME IPOs (India)
Droneacharya Aerial Innovations (2022) – Gained over 100% on listing.
Eighty Jewellers, Global Surfaces, Infollion Research – Delivered strong returns.
Many SME IPOs in 2023–24 have been oversubscribed by 100x+.
Part 7: Global IPO Boom
It’s not just India — worldwide IPO activity has seen cycles of booms:
US Tech IPOs like Airbnb, Uber, Rivian.
China’s STAR Market fueling SME & tech IPOs.
Middle East IPOs in Saudi Arabia and UAE linked to oil & diversification plans.
This global enthusiasm for IPOs reflects investors’ hunger for growth companies.
Part 8: Future Outlook of IPOs & SME IPOs
Continued Momentum in India – With India’s strong GDP growth, IPOs and SME IPOs will remain active.
Technology & Digital Startups – More unicorns will go public.
SME Sector Expansion – With government support (Make in India, PLI schemes), SMEs will increasingly tap markets.
Global Capital Inflows – FIIs and DIIs will continue supporting IPO markets.
Regulatory Strengthening – Investor protection measures will grow, ensuring sustainable IPO growth.
Part 9: How Retail Investors Should Approach IPOs
Study DRHP carefully.
Check valuations compared to peers.
Don’t just chase listing gains – look for long-term potential.
Diversify across sectors instead of putting all money into one IPO.
Be cautious with SME IPOs – higher risk, but higher reward.
Conclusion
The boom in IPOs and SME IPOs is a reflection of the changing investment landscape. Companies are now more open to tapping markets, investors are more financially literate, and technology has made participation seamless.
While IPOs offer opportunities for wealth creation, they also carry risks. The SME IPO boom in particular highlights the democratization of capital markets, allowing small businesses to grow with public support.
As long as investors remain disciplined, regulators ensure transparency, and companies use the raised capital productively, the IPO and SME IPO boom is likely to continue shaping the future of stock markets in India and across the world.

Part 1 Support ans ResistancePayoff Diagrams (Understanding Profits & Losses)
Options are best understood with payoff diagrams.
Call Buyer → Loss limited to premium, profit unlimited.
Put Buyer → Loss limited to premium, profit grows as price falls.
Call Seller → Profit limited to premium, risk unlimited.
Put Seller → Profit limited to premium, risk high if price falls.
Common Option Strategies
Beginners usually just buy Calls or Puts. But professionals use strategies combining multiple options:
Covered Call → Hold stock + Sell Call to earn income.
Protective Put → Hold stock + Buy Put for protection.
Straddle → Buy Call + Buy Put (bet on big movement either way).
Strangle → Similar to Straddle but strikes are different.
Iron Condor → Sell both Call & Put spreads (profit if market stays flat).

Part 2 Trading Master ClassTypes of Options
There are only two main types of options:
(A) Call Option (Right to Buy)
A call option gives the buyer the right to buy the asset at a fixed price.
👉 Example:
Stock: Reliance is at ₹2,500 today.
You buy a Call Option at strike price ₹2,600, paying a premium of ₹50.
If Reliance goes to ₹2,700, you can buy at ₹2,600 (profit).
If Reliance stays below ₹2,600, your option expires worthless, and you lose the ₹50 premium.
(B) Put Option (Right to Sell)
A put option gives the buyer the right to sell the asset at a fixed price.
👉 Example:
Stock: Infosys is at ₹1,400.
You buy a Put Option at strike ₹1,350, paying premium ₹20.
If Infosys falls to ₹1,300, you can sell at ₹1,350 (profit).
If Infosys stays above ₹1,350, your option expires worthless, and you lose the ₹20 premium.
Why Trade Options?
Options are popular because they provide flexibility, leverage, and hedging.
1. Leverage (Small money, big exposure)
With just a small premium, you control a large quantity of shares.
Example: To buy 50 shares of Nifty (at 20,000), you need ₹10 lakhs. But an option may cost only ₹20,000 for the same exposure.
2. Hedging (Risk Protection)
Investors use options to protect portfolios. Example: If you hold Infosys shares, you can buy a Put Option to protect against price falls (like insurance).
3. Speculation (Profit from movement)
Traders use options to bet on price moves (up, down, or even staying flat).
4. Income (Option Writing)
Professional traders sell options to earn premiums regularly.

Part 1 Trading Master ClassIntroduction to Options Trading
Imagine you want to buy a house. You like one particular property, but you don’t want to commit right away. Instead, you tell the seller:
"Here’s ₹1 lakh. Keep this house reserved for me for the next 6 months. If I decide to buy, I’ll pay you the agreed price. If not, you can keep this ₹1 lakh."
That ₹1 lakh you gave is called a premium. The deal you made is an option — a contract that gives you the right but not the obligation to buy the house.
This is the core idea of options trading: you pay a small premium to get the right to buy or sell something (like stocks, indexes, commodities, etc.) at a fixed price in the future.
What is an Option?
An option is a contract between two parties:
Buyer of option (the one who pays the premium).
Seller of option (the one who receives the premium).
The buyer has the right (but not obligation) to buy or sell at a certain price. The seller has the obligation to fulfill the deal if the buyer exercises the option.
Key Terms:
Underlying Asset → The thing on which the option is based (stocks like Reliance, Infosys, indexes like Nifty, commodities, etc.).
Strike Price → The pre-decided price at which the buyer can buy or sell.
Premium → The cost of buying the option.
Expiry → The last date till which the option is valid.
Lot Size → Options are traded in fixed quantities, not single shares. Example: Nifty options lot = 50 shares.

Option Trading Introduction to Options Trading
Imagine you want to buy a house. You like one particular property, but you don’t want to commit right away. Instead, you tell the seller:
"Here’s ₹1 lakh. Keep this house reserved for me for the next 6 months. If I decide to buy, I’ll pay you the agreed price. If not, you can keep this ₹1 lakh."
That ₹1 lakh you gave is called a premium. The deal you made is an option — a contract that gives you the right but not the obligation to buy the house.
This is the core idea of options trading: you pay a small premium to get the right to buy or sell something (like stocks, indexes, commodities, etc.) at a fixed price in the future.
What is an Option?
An option is a contract between two parties:
Buyer of option (the one who pays the premium).
Seller of option (the one who receives the premium).
The buyer has the right (but not obligation) to buy or sell at a certain price. The seller has the obligation to fulfill the deal if the buyer exercises the option.
Key Terms:
Underlying Asset → The thing on which the option is based (stocks like Reliance, Infosys, indexes like Nifty, commodities, etc.).
Strike Price → The pre-decided price at which the buyer can buy or sell.
Premium → The cost of buying the option.
Expiry → The last date till which the option is valid.
Lot Size → Options are traded in fixed quantities, not single shares. Example: Nifty options lot = 50 shares.

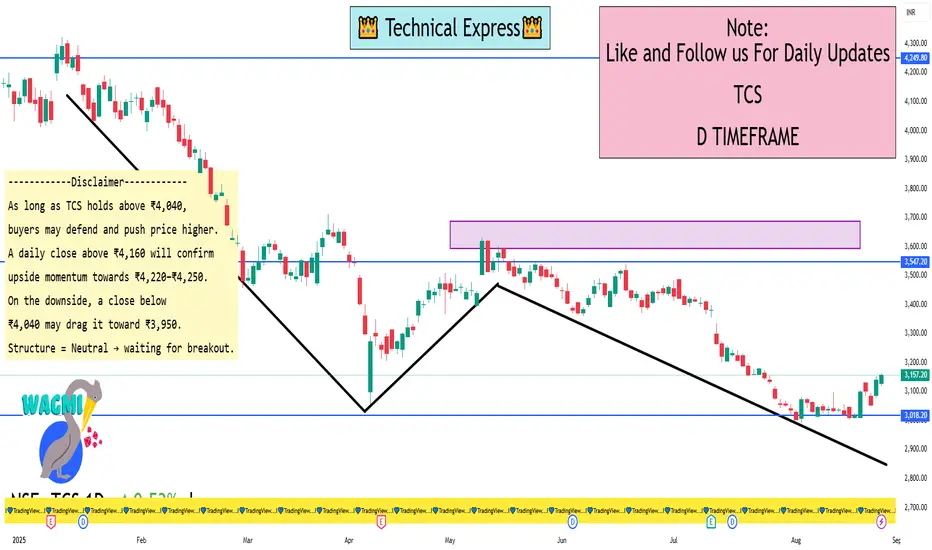
TCS 1 Day View TCS – 1 Day Timeframe Levels
🔹 Support Levels:
₹4,040 – 4,060 → Strong demand zone, recent bounce levels.
₹3,950 – 3,970 → Next major support if weakness continues.
₹3,850 → Broader support, trend-defining zone.
🔹 Resistance Levels:
₹4,140 – 4,160 → Immediate supply zone.
₹4,220 – 4,250 → Strong resistance; multiple rejections earlier.
₹4,300+ → Breakout level, opens path for higher rally.
View (Daily Structure)
Price is consolidating between ₹4,040 support and ₹4,160 resistance.
A daily close above ₹4,160 may trigger upside momentum toward ₹4,220–₹4,250.
A break below ₹4,040 could invite selling pressure toward ₹3,950.
Currently in a sideways consolidation, awaiting breakout for clear trend.
Eicher Motors Ltd 2 HourReal-Time Data Summary (Latest Close)
The most recent available data (close as of August 26, 2025) shows Eicher Motors trading at around ₹6,151, with a daily range between ₹5,970 and ₹6,210
Pivot Points (Daily) – Useful for Approximate 2-Hour Levels
While true 2-hour pivots aren't available, daily pivot points can be used as guidance for shorter intraday intervals.
From Investing.com (Daily Pivots):
Classic Pivot: ₹6,185
Support Levels (S1/S2/S3): ₹6,170, ₹6,140, ₹6,125
Resistance Levels (R1/R2/R3): ₹6,214.5, ₹6,229.5, ₹6,259
TipRanks Pivot Points (Based on Prior Day's Prices)
Classic Pivot: ₹5,951.98
Support (S1–S3): ₹5,913.97, ₹5,858.98, ₹5,820.97
Resistance (R1–R3): ₹6,006.97, ₹6,044.98, ₹6,099.97
Support & Resistance via StockInvest.us
Fibonacci Levels:
R1: ₹6,203.99
R2: ₹6,261.27
R3: ₹6,353.98
S1: ₹6,018.57
S2: ₹5,961.29
S3: ₹5,868.58
Additional Support (Accumulated Volume):
₹5,527, ₹5,495.55, ₹5,439.75
Final Thoughts
Overall bullish momentum persists (daily strong buy signals), though some indicators signal overbought conditions—be cautious.
Key swing zones:
Support: ₹6,018–₹5,961 (short term), ₹5,527–₹5,495 (deeper)
Resistance: ₹6,204–₹6,261 zone
Intraday, keep an eye on how price behaves around ₹6,100–₹6,150—it’s critical for deciding direction.
