Fundamental Analysis vs Technical Analysis: Which Strategy Wins?Introduction
In the world of stock market investing and trading, two schools of thought dominate: Fundamental Analysis (FA) and Technical Analysis (TA). Both approaches aim to answer the same question — “Should I buy, hold, or sell this stock?” — but they take entirely different paths to reach their conclusion.
Fundamental analysis focuses on the business behind the stock: revenues, profits, assets, management quality, industry position, and future growth potential.
Technical analysis focuses on the stock’s price and volume behavior, studying patterns and trends to predict short-term and long-term movements.
This debate has existed for decades, with investors like Warren Buffett standing firmly on the side of fundamentals, and traders like Paul Tudor Jones thriving on technicals. But in reality, the answer to “which strategy wins” is more nuanced.
In this guide, we’ll break down both approaches in detail, compare their strengths and weaknesses, and analyze which one works better in different market contexts.
Part 1: Understanding Fundamental Analysis
What is Fundamental Analysis?
Fundamental Analysis (FA) is the study of a company’s intrinsic value. The idea is simple: every stock has a “true worth,” and if its current market price is lower than this intrinsic value, it’s undervalued (a buying opportunity). Conversely, if the market price is higher, it’s overvalued (a selling or shorting opportunity).
Key Components of FA
Financial Statements
Income Statement (profit & loss) → Are revenues and profits growing?
Balance Sheet → Does the company have too much debt?
Cash Flow Statement → Is the company generating real cash or just accounting profits?
Ratios & Metrics
P/E Ratio (Price-to-Earnings) – How much are investors willing to pay for each unit of earnings?
P/B Ratio (Price-to-Book) – Is the stock valued fairly compared to assets?
ROE (Return on Equity) – How efficiently is management using investor capital?
Debt-to-Equity – Is the company financially stable?
Qualitative Factors
Management quality
Competitive advantage (moat)
Industry trends
Government policies and regulations
Macroeconomic Factors
Inflation, interest rates, GDP growth
Global economic conditions
Sectoral growth trends
Example of Fundamental Analysis in Action
Imagine you’re analyzing Infosys.
Revenue and profits have been steadily growing.
P/E ratio is lower than peers like TCS and Wipro.
Strong cash flows, low debt, high ROE.
The IT industry is expected to grow as global businesses continue digital transformation.
Conclusion: Infosys is fundamentally strong, and if its stock is trading at a reasonable valuation, it may be a good long-term buy.
Part 2: Understanding Technical Analysis
What is Technical Analysis?
Technical Analysis (TA) studies price and volume patterns on stock charts to predict future movements. The underlying belief is that “Price reflects everything” — all news, fundamentals, and emotions are already priced into the stock. Thus, by studying charts, traders can anticipate where the price will move next.
Key Components of TA
Price Charts
Line charts, candlestick charts, bar charts
Trends
Uptrend (higher highs, higher lows)
Downtrend (lower highs, lower lows)
Sideways (range-bound)
Support & Resistance Levels
Support = a price level where demand is strong enough to stop decline
Resistance = a level where selling pressure stops price rise
Technical Indicators
Moving Averages (MA, EMA) – Identify trend direction
RSI (Relative Strength Index) – Measures overbought/oversold conditions
MACD (Moving Average Convergence Divergence) – Identifies momentum shifts
Bollinger Bands – Measures volatility and breakout possibilities
Chart Patterns
Head & Shoulders, Double Top, Cup & Handle, Triangles, Flags, etc.
Volume Analysis
Rising price + high volume = strong bullish confirmation
Falling price + high volume = strong bearish confirmation
Example of Technical Analysis in Action
Suppose Reliance Industries is trading at ₹2,500.
The stock has formed strong support at ₹2,450 and resistance at ₹2,600.
RSI shows it’s oversold near 30, suggesting a bounce.
Volume spikes confirm buying interest.
A candlestick reversal pattern (hammer) forms near support.
Conclusion: Reliance may bounce from ₹2,450 towards ₹2,600 in the short term, making it a good trading opportunity.
Part 3: Key Differences Between FA and TA
Aspect Fundamental Analysis Technical Analysis
Focus Business, financials, valuation Price, volume, market psychology
Timeframe Long-term investing (months to years) Short to medium-term trading (minutes to weeks)
Tools Balance sheet, ratios, economy, management analysis Charts, indicators, patterns, support/resistance
Philosophy “Buy good businesses at the right price” “Price discounts everything; trends repeat”
Users Investors, value investors, mutual funds Traders, swing traders, day traders, scalpers
Strengths Identifies undervalued stocks for wealth creation Captures quick moves for profit
Weaknesses Slow, doesn’t time entries well May give false signals, ignores fundamentals
Part 4: Strengths & Weaknesses of Each Approach
Strengths of FA
Helps identify multi-bagger stocks (e.g., Infosys, HDFC Bank, Asian Paints).
Provides long-term conviction, reducing panic selling.
Focuses on wealth creation rather than just trading gains.
Weaknesses of FA
Doesn’t provide precise entry/exit timing.
Market can stay irrational for long (undervalued stocks may stay undervalued).
Requires deep knowledge of finance and economics.
Strengths of TA
Provides timing precision (when to buy/sell).
Useful for short-term profits.
Works in any market — stocks, forex, commodities, crypto.
Weaknesses of TA
Can be subjective (two traders may interpret the same chart differently).
False signals are common.
Doesn’t consider company fundamentals — risky if used blindly.
Part 5: Which Strategy Wins?
The answer isn’t either/or. The real winners are those who know when to use which approach.
For Long-Term Investors
FA is the primary tool.
Example: Warren Buffett uses fundamentals to identify businesses that will compound wealth over decades.
For Short-Term Traders
TA is more effective.
Example: Day traders and swing traders rely on charts, not balance sheets.
For Hybrid Investors (Best of Both Worlds)
The most successful investors often combine both.
Example: Buy fundamentally strong companies (FA) and use TA for better entry/exit timing.
Part 6: Real-Life Examples
Amazon (FA Winner): In 2001, Amazon was loss-making, but fundamental believers in e-commerce saw potential. Long-term holders became millionaires.
Tesla (FA + TA): Initially, Tesla looked overvalued by fundamentals, but TA showed strong momentum and trend-following traders made massive gains.
Yes Bank (FA Ignored): Many traders made profits using TA in short-term swings, but long-term FA showed cracks in fundamentals, leading to eventual collapse.
Part 7: Market Conditions – Who Wins When?
Bull Market → Both FA and TA work. FA finds strong companies, TA helps ride the trend.
Bear Market → TA is more useful for risk management. FA may trap investors in “value traps.”
Sideways Market → TA is superior as it identifies range-bound trades.
Post-Crash Recovery → FA wins by identifying undervalued gems for long-term recovery.
Conclusion
The debate of Fundamental Analysis vs Technical Analysis isn’t about which is superior, but about which fits your goals, personality, and timeframe.
If you want to build long-term wealth → Go with Fundamental Analysis.
If you want to make short-term profits → Technical Analysis is your tool.
If you want the best of both worlds → Combine FA + TA.
Ultimately, markets reward not those who argue which strategy is better, but those who apply the right strategy at the right time.
Zomato
Stock Market & Trading Basics1. What is a Stock Market?
At its core, a stock market is a place where people buy and sell ownership of companies. When you buy a share, you are literally buying a tiny piece of that company. If the company grows, you benefit through price appreciation and dividends. If it fails, you share the loss.
Think of it as a giant marketplace – just like a vegetable market. Instead of potatoes and onions, here you trade shares of companies like Reliance, Infosys, or TCS.
The purpose of a stock market is simple:
Companies raise money for growth.
Investors get a chance to grow their wealth.
It is essentially a bridge between businesses and investors.
2. History and Evolution of Stock Markets
The concept of stock trading is centuries old.
The Amsterdam Stock Exchange (1602) is considered the world’s first official stock exchange, started by the Dutch East India Company.
In the U.S., the New York Stock Exchange (NYSE) was founded in 1792 under the famous “Buttonwood Agreement.”
In India, the Bombay Stock Exchange (BSE) was established in 1875, making it Asia’s oldest stock exchange. Later, the National Stock Exchange (NSE) launched in 1992, which brought electronic trading to India.
Over time, trading shifted from open outcry (shouting bids in trading pits) to today’s electronic screen-based trading where a smartphone is enough to trade.
3. Why Do Companies List Their Shares?
A company can grow in two ways:
Take loans from banks.
Raise money from investors by selling ownership (shares).
When a company issues shares for the first time through an IPO (Initial Public Offering), it becomes “listed” on a stock exchange. Once listed, anyone can buy or sell those shares.
Advantages for companies:
Easy access to large funds.
Increases credibility and brand value.
Provides liquidity to early investors.
4. How Investors Participate in the Market
Investors participate by opening a Demat and Trading Account with a broker (like Zerodha, Upstox, Angel One, etc.).
Trading Account = to buy/sell.
Demat Account = to store shares digitally (like a bank account for stocks).
Example: If you buy 10 shares of Infosys, they’ll reflect in your Demat account, and you can sell anytime through your trading account.
5. Primary Market vs Secondary Market
Primary Market → Where companies issue new shares via IPOs. Example: LIC IPO in India (2022).
Secondary Market → Where investors trade already issued shares. Example: Buying/selling Infosys shares daily on NSE.
In simple terms:
Primary = company → investor.
Secondary = investor → investor.
6. Key Stock Market Participants
The market has different types of players:
Retail Investors → Normal individuals like us.
Domestic Institutional Investors (DII) → Indian mutual funds, insurance companies.
Foreign Institutional Investors (FII) → Big international funds investing in India.
Market Makers / Brokers → Provide liquidity by facilitating trades.
Regulators (SEBI in India, SEC in USA) → Ensure fair play.
7. Basic Market Terminology
Some must-know terms:
Bull Market → Rising market.
Bear Market → Falling market.
Blue-chip stocks → Large, stable companies like TCS, Infosys.
Market Capitalization = Share Price × Total Shares.
Dividend = Profit sharing by company to shareholders.
Volume = Number of shares traded.
8. Types of Trading
Delivery Trading – Buy today, hold as long as you want.
Intraday Trading – Buy and sell on the same day.
Futures & Options (F&O) – Derivatives trading, betting on price movements without owning stock.
Commodities Trading – Gold, silver, crude oil.
Currency Trading – Forex pairs like USD/INR.
9. Understanding Indices
Indices are like “thermometers” of the stock market.
Sensex (BSE, 30 companies) → Oldest Indian index.
Nifty 50 (NSE, 50 companies) → Most popular benchmark in India.
Dow Jones (USA), S&P 500, Nasdaq → Global indices.
If Nifty is up, it usually means the overall market is healthy.
10. Market Orders
Different ways to buy/sell stocks:
Market Order – Execute instantly at current price.
Limit Order – Execute only at a specific price you set.
Stop Loss Order – Automatically sell if price falls below your set limit (risk management).
11. Stock Market Instruments
Equity Shares
Bonds / Debentures
Mutual Funds / ETFs
Derivatives (Futures, Options)
Commodities
Currencies
Each instrument has its own risk-return profile.
12. How Prices Move
Stock prices are driven by:
Demand & Supply → More buyers than sellers = price goes up.
News & Events → Quarterly results, elections, wars, etc.
Investor Sentiment → Greed vs fear.
13. Role of Regulators
In India, SEBI (Securities and Exchange Board of India) regulates markets.
Protects investors.
Ensures transparency.
Monitors insider trading and scams.
14. Trading Basics: Technical vs Fundamental Analysis
Fundamental Analysis → Studying a company’s financials, balance sheet, profits, growth potential. (Long-term investing).
Technical Analysis → Studying price charts, patterns, indicators (RSI, MACD, Moving Averages) to predict short-term moves.
Most traders use a mix of both.
15. Popular Trading Styles
Scalping → Very quick trades, seconds to minutes.
Intraday Trading → Same-day trading.
Swing Trading → Holding for days/weeks.
Position Trading → Holding for months/years.
Long-term Investing → Buy and hold for wealth creation.
Conclusion & Future of Trading
The stock market is not a casino – it is a platform for wealth creation. Yes, risks exist, but with the right knowledge, discipline, and strategy, it can be one of the most rewarding journeys.
The future of trading will be AI-driven, with algorithms, data analytics, and global connectivity shaping markets. But the basics – demand, supply, psychology – will always remain the same.
Part 2 Master Candle Sticks PatternIntroduction to Options Trading
In the world of financial markets, options trading is considered one of the most powerful and flexible forms of trading. Unlike simple stock buying and selling, options allow traders to control larger positions with less capital, hedge their risks, and design strategies that fit different market conditions — bullish, bearish, or even sideways.
An option is essentially a contract that gives the buyer the right, but not the obligation, to buy or sell an asset at a specific price (called the strike price) within a given period of time.
If you buy an option, you are purchasing a right.
If you sell (or write) an option, you are giving someone else that right and taking on an obligation.
Options are traded on stocks, indexes (like Nifty 50 or Bank Nifty in India), commodities, currencies, and even cryptocurrencies in some global markets.
They are widely used by:
Investors to hedge portfolios.
Speculators to make money from price moves.
Institutions to manage large exposures.

Part 3 Learn Institutional TradingCall Options & Put Options Explained
Options are of two types:
🔹 Call Option
Gives the right to buy an asset at a fixed price.
Buyers of call options are bullish (expect prices to rise).
👉 Example:
If Nifty is at 22,000 and you buy a 22,100 Call Option for ₹100 premium, you pay ₹100 × lot size (say 50) = ₹5,000.
If Nifty rises to 22,400, the 22,100 call is worth 300 points. Profit = (300 - 100) × 50 = ₹10,000.
If Nifty stays below 22,100, you lose only the premium ₹5,000.
🔹 Put Option
Gives the right to sell an asset at a fixed price.
Buyers of put options are bearish (expect prices to fall).
👉 Example:
If Bank Nifty is at 48,000 and you buy a 47,800 Put for ₹200 premium, lot size = 15.
If Bank Nifty falls to 47,000, option value = 800 points. Profit = (800 - 200) × 15 = ₹9,000.
If Bank Nifty stays above 47,800, you lose only premium = ₹3,000.
So:
Call = Bullish bet.
Put = Bearish bet.

Part 2 Ride The Big MovesBasic Concepts & Terminology
Before going deeper, let’s simplify the core terms in options trading:
Strike Price: The fixed price at which the buyer can buy (call) or sell (put) the asset.
Expiry Date: The date on which the option contract expires (e.g., weekly or monthly).
Option Premium: The cost paid by the buyer to the seller for getting this right.
Lot Size: Options are traded in lots, not single shares. Example: Nifty option lot = 50 units.
In-the-Money (ITM): When exercising the option is profitable.
Out-of-the-Money (OTM): When exercising the option is not profitable.
At-the-Money (ATM): When the strike price = current price of the underlying asset.
Example:
Suppose Reliance is trading at ₹2,500.
A Call option with strike 2,400 is ITM (because you can buy at 2,400, lower than 2,500).
A Put option with strike 2,600 is ITM (because you can sell at 2,600, higher than 2,500).

Part 1 Ride The Big MovesIntroduction to Options Trading
In the world of financial markets, options trading is considered one of the most powerful and flexible forms of trading. Unlike simple stock buying and selling, options allow traders to control larger positions with less capital, hedge their risks, and design strategies that fit different market conditions — bullish, bearish, or even sideways.
An option is essentially a contract that gives the buyer the right, but not the obligation, to buy or sell an asset at a specific price (called the strike price) within a given period of time.
If you buy an option, you are purchasing a right.
If you sell (or write) an option, you are giving someone else that right and taking on an obligation.
Options are traded on stocks, indexes (like Nifty 50 or Bank Nifty in India), commodities, currencies, and even cryptocurrencies in some global markets.
They are widely used by:
Investors to hedge portfolios.
Speculators to make money from price moves.
Institutions to manage large exposures.

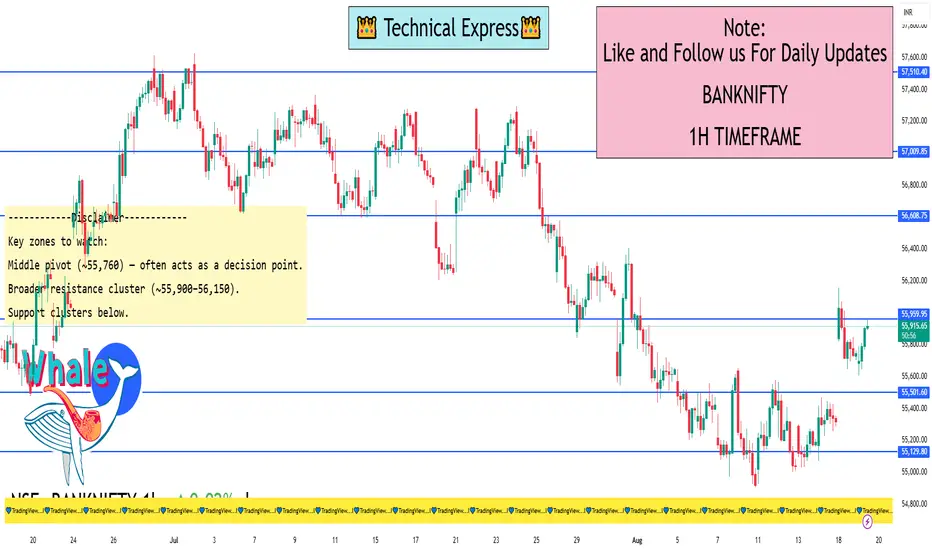
Banknifty 1 Hour Time Frame August MonthBank Nifty is moving within a descending channel on the 1-hour chart.
Immediate support: 55,000–55,200.
Intraday strength likely above 55,950, while weakness may emerge below 55,000.
Short-term Buy Setup: Buy above 55,820 → Targets: 55,910, 56,030, 56,150; Stop-loss: 55,650.
Short-term Sell Setup: Sell below 55,550 → Targets: 55,460, 54,305, 54,150; Stop-loss: 55,800
Positional Support / Resistance (Earnometer)
Support zones: 55,364, 54,865, 52,606.
Resistance zones: 55,899, 56,077, 56,261, 56,332, 56,500, 56,566
Pivot Levels (Investing.com India)
Classic pivots:
Support: S1 = 55,527.8; S2 = 55,586.85; S3 = 55,701.35
Pivot Point (PP): 55,760.4
Resistance: R1 = 55,874.9; R2 = 55,933.95; R3 = 56,048.45
Fibonacci pivots:
S1 = 55,586.85; S2 = 55,653.15; S3 = 55,694.1
PP = 55,760.4
R1 = 55,826.7; R2 = 55,867.65; R3 = 55,933.95
Momentum Trading Strategies1. Introduction to Momentum Trading
If you’ve ever watched a cricket match where a batsman suddenly starts hitting boundaries one after another, you’ll notice something called momentum. Once the flow begins, it often continues until something major interrupts it. The same happens in stock markets.
Momentum trading is built on a simple idea:
👉 “Stocks that are moving strongly in one direction are likely to keep moving in that direction—at least for a while.”
In trading, momentum is like catching a moving train. Instead of trying to guess where the train will start or stop, you jump on when it’s already moving. Unlike long-term investing, where you analyze fundamentals deeply, momentum trading is more about riding the wave created by news, earnings, emotions, or institutional flows.
For example:
If Reliance stock is up 8% today on strong earnings and massive volume, a momentum trader might buy in, expecting further upside tomorrow or over the next week.
If crude oil prices fall sharply, a momentum trader might short oil stocks, assuming more selling pressure will follow.
So momentum trading isn’t about predicting the future—it’s about following what’s already happening.
2. The Psychology Behind Momentum
Markets are not purely logical. They are driven by human behavior—fear, greed, and herd mentality. Momentum thrives on these psychological forces:
Herd Behavior – When people see a stock rising, they rush in, fearing they’ll miss out (FOMO). This buying creates more buying.
Confirmation Bias – Traders look for news or charts that confirm their belief, reinforcing the trend.
Fear of Loss – When prices fall, investors panic and sell, creating downward momentum.
Overreaction – Markets often overreact to news—both positive and negative. Momentum traders exploit this by catching the exaggerated moves.
That’s why momentum works: people chase winners and dump losers.
3. Core Principles of Momentum Trading
To really get momentum trading, let’s simplify it into a few golden rules:
The Trend is Your Friend – Don’t fight against the flow. If Nifty is trending up with strong breadth, focus on long trades.
Volume Confirms Momentum – Price alone is not enough. A move backed by high trading volume signals real strength.
Momentum Has a Shelf Life – No stock rises forever. Momentum fades when buyers lose energy. So, entry and exit timing is crucial.
Relative Strength Matters – Stronger stocks outperform weaker ones, especially in bull markets. Momentum traders prefer leaders, not laggards.
Risk is Key – Since momentum can reverse sharply, strict stop-loss discipline is non-negotiable.
Think of momentum like surfing. You don’t control the wave—you just ride it until it fades, then exit before it crashes.
4. Popular Momentum Trading Strategies
Momentum isn’t one single style—it’s a family of approaches. Let’s explore the most widely used ones:
4.1 Breakout Trading
This is the classic momentum method. Traders wait for a stock to break above resistance or below support with strong volume.
Example:
Stock X is stuck between ₹100–₹110 for weeks.
Suddenly, it breaks above ₹110 with huge volume.
A momentum trader buys here, expecting ₹120, ₹125, or higher.
The psychology? Breakouts attract fresh buyers, and shorts are forced to cover—fueling momentum.
4.2 Moving Average Crossover Strategy
Traders use moving averages (like 20-day, 50-day, 200-day) to capture momentum.
If a short-term average (20-day) crosses above a longer one (50-day), it signals upward momentum.
If it crosses below, it signals downward momentum.
This strategy filters noise and captures medium-term trends.
4.3 Relative Strength Strategy
Momentum traders often compare how a stock is performing relative to the overall market or sector.
Example:
Nifty is up 1%, but Stock A is up 6%.
That relative strength suggests momentum, making Stock A a candidate for long trades.
The reverse works for shorting weak stocks in a weak market.
4.4 Intraday Momentum Scalping
Some traders capture quick bursts of momentum within minutes or hours. They trade news, economic data releases, or sudden volume spikes.
For instance, if Infosys announces strong guidance at 10 AM, intraday momentum traders jump in for a 2–3% move before it cools off.
4.5 News & Earnings-Based Momentum
Earnings season is a goldmine for momentum traders. Positive surprises often create upward momentum; negative surprises trigger downward spirals.
Example:
Company beats earnings estimates → stock gaps up 10%.
Traders buy expecting continued demand from institutions.
This “post-earnings drift” is a classic momentum phenomenon.
4.6 Sector Rotation Momentum
Big money often flows into specific sectors (IT, Banks, Pharma) during different phases of the economy.
Momentum traders ride the hot sector until it cools.
Example:
When RBI cuts rates, banking stocks rally for weeks.
A trader focuses on the strongest banks instead of random picks.
5. Technical Indicators Used in Momentum
Momentum trading heavily relies on technical analysis. Some widely used tools:
Relative Strength Index (RSI) – Measures speed of price movements. Above 70 = overbought, below 30 = oversold.
Moving Average Convergence Divergence (MACD) – Tracks trend strength using moving averages.
Rate of Change (ROC) – Calculates % change in price over a period.
Volume Indicators (OBV, VWAP) – Confirm if price moves are supported by volume.
Bollinger Bands – Help spot volatility and potential momentum breakouts.
These are not perfect, but they guide entry/exit decisions.
6. Risk Management in Momentum Trading
Momentum can be rewarding but also dangerous because reversals are sudden. To survive, traders follow strict rules:
Stop-Loss Orders – Never trade without a predefined exit point.
Position Sizing – Don’t put all capital in one trade. Risk 1–2% per trade.
Avoid Overnight Risk (for intraday) – News or global events can reverse momentum overnight.
Don’t Chase Too Late – Entering after a huge move often results in buying the top.
Take Partial Profits – Lock in gains as momentum matures.
Think of risk management as your seatbelt—it won’t prevent the accident, but it can save your life.
7. Real-Life Examples of Momentum Trading
Example 1: Adani Enterprises 2020–2022
Adani stocks had a massive rally driven by infrastructure growth stories. Traders who identified the breakout early rode the multi-month momentum.
Example 2: Tesla in the US
Tesla stock in 2020–21 was a momentum trader’s dream—surging 10x in months. Technical breakouts plus EV hype created sustained momentum.
Example 3: COVID Crash & Recovery (2020)
Markets fell sharply in March 2020. Momentum traders shorted stocks during the fall. Then, when recovery began, they switched sides and rode the rally.
8. Advantages and Challenges
Advantages
Quick profits in short time.
Works in both rising and falling markets.
Backed by psychology and herd behavior.
Flexible—can be applied intraday, swing, or positional.
Challenges
Momentum is short-lived; timing is tricky.
False breakouts can trap traders.
High emotional stress due to volatility.
Requires constant monitoring—can’t be passive.
9. Tips for Traders
Trade only liquid stocks—avoid low-volume traps.
Combine momentum with fundamentals for stronger conviction.
Don’t overtrade; wait for clear setups.
Learn to exit gracefully—don’t wait for the last rupee.
Keep a trading journal to track what worked and what didn’t.
10. Conclusion
Momentum trading is like riding waves in the ocean—you don’t create the wave, you just ride it skillfully. It’s about speed, timing, and discipline. Done well, it can be one of the most profitable trading styles. Done poorly, it can wipe out accounts.
The key is to remember:
Follow the trend, not emotions.
Risk management is more important than entries.
Momentum is temporary—treat it like an opportunity, not a guarantee.
If investing is like planting a tree, momentum trading is like harvesting fruits quickly when they’re ripe. Both can make money, but momentum needs sharper focus and faster decisions.
Global Macro Factors in TradingIntroduction
Trading is not just about charts, patterns, or company earnings—it’s also about understanding the bigger picture. This bigger picture is shaped by global macroeconomic factors that influence the flow of money across countries, sectors, and asset classes.
A trader who ignores global macro factors risks missing the underlying forces driving market trends. On the other hand, traders who integrate macroeconomic analysis into their strategies can often anticipate market shifts before they appear on technical charts.
In this deep dive, we’ll explore what global macro factors are, why they matter, how they affect different asset classes, and how traders can practically use them in their decision-making.
What are Global Macro Factors?
Global macro factors are large-scale economic, political, and social conditions that impact the performance of financial markets worldwide. They include:
Economic growth cycles (GDP, industrial output, unemployment)
Inflation and deflation trends
Interest rates and monetary policy
Government fiscal policies
Global trade dynamics (exports, imports, tariffs, supply chains)
Geopolitical risks (wars, elections, sanctions, political instability)
Commodities and energy prices (oil, gas, metals, agriculture)
Currency exchange rates
Technological disruptions & structural shifts
Climate change and sustainability policies
These factors drive cross-border capital flows, influence investor sentiment, and dictate the performance of stocks, bonds, commodities, and currencies.
Why Global Macro Factors Matter for Traders
They Move Markets More Than Company News
For example, if the U.S. Federal Reserve raises interest rates sharply, the Indian stock market might fall—even if Indian companies are performing well—because global capital exits riskier emerging markets.
They Explain Market Trends
Sometimes markets rise or fall without obvious technical reasons. Looking at macro data (like inflation, global interest rates, or oil prices) often reveals the underlying cause.
They Help in Asset Allocation
A trader who knows that inflation is rising globally may prefer commodity trading (gold, silver, crude) over growth stocks.
They Reduce Trading Risk
Anticipating macro shocks—such as a recession, a currency crisis, or a geopolitical conflict—helps traders manage risk better.
Key Global Macro Factors in Detail
Let’s go through the most important ones, with trading implications.
1. Economic Growth Cycles (GDP Trends)
What it means:
Gross Domestic Product (GDP) is the main indicator of economic health. High GDP growth attracts foreign investments, boosts corporate profits, and supports strong stock market performance. Slow growth or contraction signals recession.
Impact on Trading:
When global growth is strong → equities, emerging markets, and cyclical sectors (automobiles, banking, infrastructure) perform well.
When growth slows → safe-haven assets like gold, U.S. Treasuries, and defensive sectors (pharma, FMCG) gain.
Example:
In 2020, when the world economy went into lockdown, GDP collapsed globally. Stock markets initially crashed, but later surged when governments and central banks provided massive stimulus, betting on a V-shaped recovery.
2. Inflation & Deflation
What it means:
Inflation is the rise in prices of goods and services. Controlled inflation is good—it indicates demand. But runaway inflation hurts purchasing power. Deflation, the opposite, signals weak demand and economic stagnation.
Impact on Trading:
High inflation → central banks raise interest rates, stock markets fall, bond yields rise. Commodities like gold and oil rally.
Low inflation/deflation → central banks cut rates, boosting equity markets.
Example:
In 2022, global inflation spiked due to supply chain disruptions and the Russia-Ukraine war. Central banks raised rates aggressively, causing sharp declines in tech and growth stocks while energy companies benefited.
3. Interest Rates & Monetary Policy
What it means:
Central banks like the U.S. Federal Reserve, ECB, or RBI control monetary policy—deciding interest rates and liquidity. Interest rates directly affect borrowing costs, investments, and asset valuations.
Impact on Trading:
Rising rates → bearish for stocks (especially tech), bullish for bonds and the U.S. dollar.
Falling rates → bullish for equities and commodities, bearish for the dollar.
Example:
In 2023–2024, markets closely tracked the Fed’s decisions. Whenever the Fed hinted at slowing down rate hikes, global stock markets rallied.
4. Fiscal Policy & Government Spending
What it means:
Governments influence markets through budgets, taxation, subsidies, and spending programs. Fiscal stimulus can boost markets, while austerity can slow them.
Impact on Trading:
Infrastructure spending → benefits construction, cement, steel stocks.
Tax cuts → boost corporate profits and consumer spending.
Subsidies/removals → affect agriculture, energy, and renewable stocks.
Example:
India’s Union Budget announcements often cause sectoral rallies—defense allocations push defense stocks up, while higher infrastructure spending boosts capital goods.
5. Global Trade & Supply Chains
What it means:
Globalization ties economies together. Exports, imports, tariffs, sanctions, and supply chain disruptions influence asset prices.
Impact on Trading:
Trade wars or tariffs → hurt global growth and export-driven stocks.
Strong global trade → boosts commodities and shipping sectors.
Supply chain disruptions → create inflation and shortages (e.g., semiconductors in 2021).
Example:
The U.S.-China trade war in 2018 caused volatility in technology and industrial stocks worldwide.
6. Geopolitical Risks
What it means:
Wars, sanctions, elections, and political instability affect global investor sentiment.
Impact on Trading:
Rising geopolitical tensions → bullish for gold, oil, U.S. dollar (safe havens).
Stable geopolitics → bullish for equities and emerging markets.
Example:
The Russia-Ukraine war in 2022 caused oil and gas prices to spike, benefiting energy companies but hurting global equity markets.
7. Commodities & Energy Prices
What it means:
Oil, natural gas, metals, and agricultural commodities drive costs across industries.
Impact on Trading:
Rising oil → hurts airline, transport, and manufacturing stocks. Benefits energy producers.
Rising gold/silver → signals investor risk aversion.
Agricultural prices → affect FMCG and food companies.
Example:
When crude oil rose above $100 per barrel in 2022, airline stocks crashed while oil & gas companies rallied.
8. Currency Exchange Rates
What it means:
Currencies reflect economic health, capital flows, and interest rate differentials.
Impact on Trading:
Strong USD → hurts emerging markets, commodity prices fall.
Weak USD → boosts gold, commodities, and EM equities.
Currency depreciation → benefits exporters but hurts importers.
Example:
In 2022, the U.S. dollar index hit a 20-year high. This pressured Indian equities as foreign investors pulled money out, and crude oil imports became costlier for India.
9. Technological Disruptions
What it means:
Innovation (AI, blockchain, EVs, renewable energy) shifts capital allocation.
Impact on Trading:
New tech adoption → boosts related sectors (AI → IT companies, EV → battery makers).
Old industries → may lose capital (oil majors losing to renewables).
Example:
AI-driven rallies in 2023–2024 saw tech giants like Nvidia and Microsoft outperform global markets.
10. Climate Change & ESG Policies
What it means:
Sustainability and environmental regulations now influence capital flows.
Impact on Trading:
ESG-focused funds avoid polluting industries.
Renewable energy, EV, and green tech companies benefit.
Carbon taxes and environmental restrictions increase costs for traditional industries.
Example:
Europe’s carbon neutrality push boosted renewable energy companies while hurting coal producers.
How Global Macro Factors Affect Different Asset Classes
Equities (Stocks)
Bull markets when growth, low inflation, and easy money align.
Bear markets during recessions, high inflation, or geopolitical shocks.
Bonds
Bond prices rise when interest rates fall.
Inflation erodes bond returns.
Commodities
Rise in inflation and geopolitical risks → commodity bull runs.
Strong dollar usually weakens commodities.
Currencies (Forex)
Driven by interest rates, trade balances, and capital flows.
Safe-haven currencies (USD, CHF, JPY) rise during crises.
Crypto Assets
Sensitive to liquidity conditions and global risk sentiment.
Perform better during easy monetary policy and risk-on environments.
Conclusion
Global macro factors are the invisible strings that pull the markets in different directions. They influence whether money flows into equities, commodities, bonds, or currencies.
For traders, the ability to combine macro awareness with technical analysis is a powerful edge. It helps anticipate large market moves, align trades with the broader economic cycle, and reduce risk exposure.
In today’s interconnected world, no market operates in isolation. Understanding GDP trends, inflation, interest rates, currency shifts, and geopolitical developments is essential to surviving and thriving as a trader.
Short-Term Trading vs. Long-Term TradingIntroduction
When people step into the stock market, they usually come across two main approaches: short-term trading and long-term investing (or trading). Both are methods of participating in the markets, but they differ significantly in terms of time horizon, mindset, strategies, risks, and rewards.
Short-term trading is like sprinting: fast-paced, energetic, and often risky. Long-term investing is like running a marathon: steady, patient, and endurance-driven. Both can lead to success, but they suit different kinds of personalities, financial goals, and market conditions.
In this detailed discussion, we’ll explore what each strategy means, how they work, their pros and cons, famous examples, psychology, and ultimately how traders and investors can decide which approach (or blend of both) works for them.
What is Short-Term Trading?
Short-term trading refers to buying and selling financial assets within a short period, ranging from a few minutes to a few weeks. The primary objective is to take advantage of price fluctuations and profit quickly.
Types of Short-Term Trading
Scalping – Trades last seconds or minutes, aiming for small profits multiple times a day.
Day Trading – Buying and selling within the same day, closing all positions before market close.
Swing Trading – Holding trades for a few days to weeks, capturing short price “swings.”
Momentum Trading – Jumping into stocks with strong upward or downward momentum, often influenced by news, results, or events.
Key Features of Short-Term Trading
Time horizon: seconds to weeks.
Tools used: technical analysis, chart patterns, volume profile, moving averages, RSI, etc.
Driven by: volatility, news, earnings reports, global events.
Requires active monitoring and fast decision-making.
What is Long-Term Trading (or Investing)?
Long-term investing involves holding an asset for years, often ignoring short-term fluctuations. The goal is to grow wealth gradually by benefiting from compounding, dividends, and the long-term growth of companies or markets.
Key Features of Long-Term Trading
Time horizon: several years to decades.
Tools used: fundamental analysis, company earnings, valuation ratios (P/E, P/B), macroeconomic trends.
Driven by: company growth, economic cycles, innovation, demographics.
Requires patience, consistency, and belief in the long-term growth of markets.
Famous Example:
Warren Buffett is the most celebrated long-term investor. He buys strong companies with durable advantages and holds them for decades.
Time Horizon: The Core Difference
Short-Term Trading: Profit targets can be hit in minutes or days. Focus is on timing entry/exit perfectly.
Long-Term Trading: Success depends less on timing and more on time in the market. Staying invested allows the power of compounding to work.
For example:
A day trader might buy Reliance stock at ₹2800 and sell at ₹2825 within a few hours.
A long-term investor might buy Reliance at ₹1000 in 2016 and hold until 2025 when it reaches above ₹2800, gaining multiple times the initial capital.
Risk and Reward
Short-Term Trading Risks & Rewards
Rewards: Quick profits, ability to capitalize on volatility, frequent opportunities.
Risks: High transaction costs, emotional stress, overtrading, large losses from sudden moves.
Long-Term Trading Risks & Rewards
Rewards: Power of compounding, lower taxes (on long-term capital gains), dividends, financial security.
Risks: Market crashes (like 2008 or 2020), company failures, inflation risk, long waiting period.
Tools & Techniques
Short-Term Traders Rely On:
Technical charts (candlesticks, moving averages, RSI, MACD).
Market structure and volume profile.
News-driven events (earnings, economic data).
Risk management via stop-loss orders.
Long-Term Traders Rely On:
Fundamental analysis (balance sheet, income statement, cash flow).
Valuation models (Discounted Cash Flow, P/E ratios).
Macroeconomic outlook (GDP growth, interest rates, inflation).
Patience and steady investment via SIPs (Systematic Investment Plans).
Psychology Behind Both Approaches
Psychology of Short-Term Traders
Need discipline and emotional control.
Greed and fear drive most mistakes.
High adrenaline, similar to professional gaming or sports.
Psychology of Long-Term Traders
Patience and conviction are crucial.
Must endure downturns without panic selling.
Delayed gratification mindset—willing to wait years for returns.
Costs and Taxes
Short-Term Trading: Frequent buying and selling means higher brokerage, slippage, and short-term capital gains tax (usually higher).
Long-Term Investing: Fewer transactions reduce costs. Long-term capital gains tax rates are often lower, helping wealth accumulation.
Who Should Choose What?
Short-Term Trading Suits:
Active individuals who can track markets daily.
Those comfortable with risk and volatility.
People looking for quick income rather than long-term wealth.
Long-Term Trading Suits:
Salaried professionals or business owners who can’t monitor markets daily.
People aiming for retirement planning, wealth creation, children’s education.
Investors who prefer stability over thrill.
Case Studies
Short-Term Example:
A trader in March 2020 (COVID crash) bought Nifty futures at 7,600 and sold at 8,000 within 2 days. Quick 400 points profit = massive gain.
Long-Term Example:
Someone who invested in Infosys IPO in 1993 (₹95 per share, adjusted for splits/bonuses) would now have wealth worth crores.
Blended Approach (Best of Both Worlds)
Many professionals suggest mixing both:
Keep 80% of funds in long-term investments (stable growth, retirement security).
Use 20% for short-term trading (to exploit opportunities, stay active, and generate extra income).
This way, you don’t miss out on compounding while also enjoying the benefits of active trading.
Advantages & Disadvantages Side by Side
Aspect Short-Term Trading Long-Term Trading
Time Horizon Minutes to weeks Years to decades
Risk Very high Moderate (if diversified)
Reward Potential High, quick Massive over time
Stress Level Very high Lower
Tools Used Technical charts Fundamental analysis
Costs High Low
Taxes Higher Lower
Skill Requirement Very high Moderate
Best For Active, aggressive traders Patient investors
Final Thoughts
Short-term trading and long-term investing are two sides of the same coin. One thrives on speed, volatility, and timing, while the other prospers through patience, consistency, and the power of compounding.
The truth is, there’s no universal “better” strategy. It depends on your personality, risk tolerance, financial goals, and lifestyle. Some people thrive in the fast action of short-term trades, while others find peace in buying good companies and letting time do the heavy lifting.
If you’re new to the market, starting with long-term investing is generally safer. Once you gain experience, you may gradually allocate some portion of your capital to short-term trading.
In the end, the best strategy isn’t about chasing the highest return, but about choosing the path you can follow consistently without losing peace of mind.
India Growth SupercycleIntroduction: What is a Growth Supercycle?
A “growth supercycle” refers to a prolonged period—often spanning decades—when a country or region experiences sustained economic expansion driven by structural changes. It’s not just about one or two years of high GDP growth; rather, it’s a long-term trend powered by deep forces like demographics, industrialization, urbanization, rising consumption, technological adoption, and capital inflows.
History has shown us examples:
The US in the 20th century, after World War II.
Japan from the 1950s to 1980s.
China from the 1990s to 2010s, where hundreds of millions moved out of poverty into middle-class prosperity.
Now, global investors and economists believe India is entering its own multi-decade growth supercycle. With a young population, expanding middle class, strong reforms, and growing global relevance, India is being compared to China in the 2000s—but with its own unique advantages and challenges.
Chapter 1: India’s Growth Journey So Far
India’s path to its current stage has been gradual but consistent:
1. Pre-Liberalization Era (1947–1991)
India gained independence in 1947 and adopted a planned economy with state control over industries, foreign trade, and capital flows.
Growth averaged only 3–4% per year (famously called the “Hindu rate of growth”).
Limited global integration, bureaucratic hurdles, and a heavy public sector slowed momentum.
2. Liberalization Reforms (1991–2000s)
In 1991, a balance of payments crisis forced India to open up its economy.
Reforms under PM P.V. Narasimha Rao and Finance Minister Dr. Manmohan Singh:
Deregulation of industries.
Reduction in tariffs and import restrictions.
Encouragement of private sector participation.
Growth accelerated to 6–7% annually.
3. IT & Services Boom (2000s)
India emerged as the world’s IT outsourcing hub.
Cities like Bengaluru, Hyderabad, and Pune became global tech centers.
Services contributed heavily to GDP; exports boomed.
Growth averaged 7–8%.
4. The Current Era (2014–present)
Reforms like GST, Insolvency & Bankruptcy Code, digitization push, UPI payments, startup ecosystem.
Government focus on Make in India, manufacturing, infrastructure, renewable energy.
Despite global shocks (COVID, Ukraine war, inflation), India maintained one of the highest GDP growth rates globally.
Chapter 2: The Key Drivers of India’s Growth Supercycle
Now let’s look at the forces that will drive India’s rise over the next two to three decades.
1. Demographic Dividend
India has a median age of just 28 years (vs. 38 in the US, 39 in China, 48 in Japan).
Over 65% of the population is below 35.
Each year, 12 million people join the workforce.
A young, working-age population boosts productivity, consumption, and innovation.
Contrast: China and developed economies face aging populations.
2. Rising Middle Class & Consumption
India’s middle class is expected to reach 500 million+ by 2035.
Growing income levels mean more spending on:
Consumer goods
Housing
Automobiles
Travel & lifestyle
Healthcare & education
India is shifting from basic survival consumption (food, shelter) to aspirational consumption (gadgets, cars, brands).
3. Urbanization & Infrastructure
Currently, only 36% of Indians live in cities (vs. 60% in China).
By 2040, 50%+ will be urban.
This will drive:
Construction of smart cities.
Demand for housing, roads, metro rail, airports, and logistics.
Real estate boom.
Infrastructure push: Highways, bullet trains, ports, digital infrastructure.
4. Digital Transformation
India is the world’s fastest-growing digital economy.
Over 850 million internet users.
UPI digital payments leading globally—more transactions than US + China combined.
IndiaStack & Aadhaar enabling financial inclusion.
Growth in AI, e-commerce, fintech, edtech, healthtech.
5. Manufacturing & “China+1” Opportunity
Global companies are diversifying supply chains beyond China.
India has become a preferred alternative due to:
Large labor force.
Government incentives (PLI schemes).
Stable democracy.
Sectors gaining: electronics, semiconductors, EVs, defense, textiles.
6. Global Investments & FDI
Foreign Direct Investment (FDI) inflows hitting records.
Global investors see India as a long-term growth story.
Stock markets reflecting optimism: India is now the 5th largest equity market in the world.
7. Energy & Sustainability Transition
India is targeting net-zero by 2070.
Massive investments in solar, wind, hydrogen energy.
India is also positioning itself as a leader in green tech.
Chapter 3: Sectors Benefiting from the Supercycle
The growth story won’t be uniform—some sectors will be the biggest beneficiaries:
Banking & Financial Services – Rising credit demand, digital banking, financial inclusion.
Infrastructure & Real Estate – Roads, airports, housing, smart cities.
Technology & Digital – IT services, startups, AI, SaaS, e-commerce.
Manufacturing & Exports – Electronics, pharma, textiles, defense.
Energy & Renewables – Solar, hydrogen, EV ecosystem.
Healthcare & Education – Expanding middle class driving quality demand.
Consumer & Retail – FMCG, automobiles, premium lifestyle products.
Chapter 4: Risks & Challenges
No growth story is without challenges. For India, the supercycle path will face hurdles:
Job Creation – 12 million youth enter workforce yearly; quality jobs are needed.
Income Inequality – Urban-rural divide may widen.
Infrastructure Gaps – Speed of execution must match growth.
Geopolitical Risks – India must balance US, China, Russia relationships.
Climate Change & Resource Scarcity – Water stress, pollution, energy demands.
Policy Consistency – Reforms must be steady; bureaucratic delays could hurt.
Chapter 5: The Global Context – Why India Matters Now
The world economy is slowing down: US, Europe facing stagnation, China aging.
India is expected to contribute 15–20% of global growth in the next decade.
Global investors see India as the next growth engine.
India’s democratic setup adds stability compared to authoritarian regimes.
Chapter 6: India in 2047 – A Vision
India will celebrate 100 years of independence in 2047. By then, projections suggest:
India could be a $30–35 trillion economy (from ~$4.3 trillion today).
The largest consumer market in the world.
A hub for manufacturing, technology, and services.
A global leader in renewable energy & digital finance.
Home to the world’s largest middle class.
Conclusion: The India Growth Supercycle is Real
India’s growth is not just about GDP numbers. It is about a civilizational rise—a young nation transforming into a global powerhouse. The combination of demographics, digital adoption, manufacturing push, and global trust in India creates a unique moment in history.
Yes, challenges remain. But the long-term trajectory is clear:
India is entering a multi-decade supercycle of growth, much like the US in the 20th century and China in the 2000s.
For investors, businesses, and global policymakers, ignoring this story would mean missing the biggest growth opportunity of the 21st century.

Inflation & Market Performance (2025 Context)1. Introduction
Inflation has always been one of the most critical variables in shaping market performance. It affects everything — from consumer spending and corporate profits to central bank policies and stock valuations. In 2025, inflation continues to remain a hot topic across global economies, especially after the turbulent years of post-pandemic recovery, geopolitical conflicts, energy shocks, and monetary tightening cycles.
Markets don’t react to inflation in isolation; they respond to expectations about inflation, interest rates, and growth. While mild inflation is seen as healthy, runaway inflation or deflation can shake investor confidence and distort asset pricing.
In this article, we will explore:
The nature of inflation in 2025 and its drivers.
How inflation influences stock markets, bond markets, commodities, and currencies.
Sector-wise winners and losers in high/low inflation scenarios.
The interplay of central bank policies and investor psychology.
India’s inflation-market dynamics in 2025 compared with global trends.
Long-term structural themes in inflation-linked market performance.
2. Inflation Basics: Why It Matters
Before we dive into the 2025 context, let’s refresh the basics.
Definition: Inflation is the sustained rise in the general price level of goods and services.
Measurement: Typically measured via CPI (Consumer Price Index), WPI (Wholesale Price Index), or PCE (Personal Consumption Expenditure index in the US).
Causes:
Demand-pull inflation (too much demand chasing limited supply).
Cost-push inflation (higher input costs like wages, oil, commodities).
Built-in inflation (expectations embedded into wage-price cycles).
Why markets care about inflation:
Corporate Earnings: Rising costs squeeze profit margins.
Interest Rates: Central banks raise rates to tame inflation, making borrowing costlier.
Bond Yields: Higher inflation reduces the real return on fixed-income instruments.
Valuations: Equity valuations (P/E ratios) decline as discount rates rise.
Sector Rotation: Some sectors thrive in inflation (commodities, energy), while others suffer (tech, consumer discretionary).
In short, inflation is a valuation driver, a sentiment shaper, and a policy trigger.
3. The Global Inflation Landscape in 2025
3.1 Post-Pandemic Normalization
The pandemic years (2020–2022) created supply chain disruptions, leading to soaring prices. By 2023–2024, central banks aggressively raised rates (US Fed, ECB, RBI) to cool inflation. By 2025, inflation rates in developed economies are lower than peak levels but remain sticky — slightly above central bank comfort zones.
US Inflation (2025): Moderated to ~3% but stubborn in services and housing.
Eurozone: Around 2.5%, with energy still a risk due to geopolitical tensions.
India: CPI hovering around 4.5–5.5%, close to RBI’s comfort band but sensitive to food and fuel shocks.
Emerging Markets: More volatile inflation, often linked to currency weakness and commodity imports.
3.2 Key Drivers in 2025
Energy Prices: Oil & natural gas remain unpredictable due to Middle East tensions and Russia-Ukraine war aftershocks.
Climate Events: Erratic monsoons, floods, and heatwaves impact agricultural output (food inflation).
Geopolitical Fragmentation: Supply chain re-shoring, trade restrictions, and technology export controls add structural cost pressures.
Wages: Labor markets are tight, especially in tech and healthcare, adding wage-push inflation.
In essence, inflation in 2025 is not runaway like 2022, but sticky, uneven, and multi-speed across regions.
4. Inflation and Stock Market Performance
4.1 General Market Trends
Mild Inflation (2–3%): Markets usually perform well, as it signals healthy growth.
Moderate Inflation (3–5%): Mixed market performance — cost pressures vs. growth optimism.
High Inflation (>6%): Equity markets usually decline, except for inflation-hedge sectors.
4.2 Sectoral Winners in 2025
Energy & Commodities:
Oil, gas, metals tend to rise with inflation.
Companies in these sectors enjoy pricing power.
Banks & Financials:
Benefit from higher interest margins when rates rise.
Loan growth might slow, but profitability improves.
FMCG & Consumer Staples:
Can pass on costs to consumers, maintaining margins.
Defensive demand makes them stable.
Real Estate & Infrastructure:
Tangible assets act as inflation hedges.
However, sensitive to interest rates.
4.3 Sectoral Losers in 2025
Technology & Growth Stocks:
High valuations get compressed under rising discount rates.
Investors shift to value/cyclical stocks.
Consumer Discretionary:
Higher inflation erodes consumer purchasing power.
Luxury goods and non-essentials see demand contraction.
Bond-Proxies (Utilities, REITs):
Lose appeal as bond yields rise.
Higher financing costs hurt profitability.
5. Inflation and Bond Markets
Bond markets are directly linked to inflation expectations.
Nominal Bonds: Inflation erodes real returns, leading to higher yields.
Inflation-Indexed Bonds (TIPS in the US, IIBs in India): Demand rises when inflation uncertainty increases.
Yield Curve:
Flattening or inversion signals that markets expect inflation to cool and growth to slow.
Steepening suggests prolonged inflation risks.
In 2025, bond yields are high compared to the pre-pandemic era, reflecting elevated risk premiums. Institutional investors are diversifying between nominal and inflation-linked bonds.
6. Inflation and Commodities
Commodities are direct beneficiaries of inflation.
Gold & Silver: Classic safe havens. In 2025, gold trades strong due to persistent inflation fears and central bank buying (especially by China & India).
Oil & Gas: Sensitive to geopolitical disruptions; higher prices fuel inflation.
Agricultural Commodities: Climate shocks and supply-chain fragmentation keep food prices elevated.
Thus, commodity cycles are tightly interwoven with inflation, making them critical for portfolio diversification.
7. Inflation and Currencies
Currencies react strongly to inflation differentials.
High inflation, weak currency: Investors dump the currency (e.g., Turkey, Argentina).
Controlled inflation, stable currency: Boosts investor confidence.
In 2025:
US Dollar (USD): Stronger compared to EM currencies due to sticky inflation and Fed’s restrictive stance.
Indian Rupee (INR): Relatively stable but under pressure when oil surges.
Euro (EUR): Mixed performance; energy dependency makes inflation management tricky.
Yen (JPY): Weak due to ultra-loose monetary policy, despite global inflation trends.
8. Central Banks and Inflation Control
8.1 Federal Reserve (US)
The Fed remains cautious in 2025. It cannot cut rates too aggressively as inflation is not fully tamed. Markets closely track every FOMC meeting, as Fed policy guides global liquidity.
8.2 Reserve Bank of India (RBI)
RBI balances inflation control with growth support. India’s food inflation remains a challenge, but structural reforms, better forex reserves, and stable inflows help anchor market confidence.
8.3 European Central Bank (ECB) & Others
ECB faces a tough balancing act — weak growth but still above-target inflation. Other central banks (BoE, BoJ) adopt diverse stances depending on domestic pressures.
9. Investor Psychology in Inflationary Times
Markets are not just numbers; they’re a reflection of human behavior. Inflation affects psychology in powerful ways:
Fear: Rising prices reduce real wealth, making investors risk-averse.
Speculation: Some chase commodities or real estate as hedges.
Rotation: Capital shifts from growth to value, from equity to bonds, from domestic to global.
Herding: Retail investors often chase inflation-hedge assets at late stages, creating bubbles.
In 2025, investor sentiment is cautious yet opportunistic — inflation is high enough to worry but not catastrophic.
10. India’s Inflation-Market Performance in 2025
India is a special case in inflation-market dynamics.
Inflation Drivers: Food (vegetables, pulses), fuel imports, and rural demand are key factors.
Equity Markets:
Nifty and Sensex show resilience, supported by domestic flows (SIPs, DIIs).
Sectors like banking, IT services exports, and infrastructure remain strong.
Midcaps and SMEs are volatile due to inflation-sensitive costs.
Bond Markets: Rising G-sec yields (6.5–7.5%) reflect inflation risks but attract foreign inflows.
Rupee: Stable around 83–85/USD but vulnerable to oil price spikes.
India’s structural growth story (demographics, digital adoption, reforms) keeps markets buoyant even under moderate inflation.
Conclusion
Inflation in 2025 is not a crisis but a constant companion for markets. It’s sticky, regionally diverse, and shaped by structural shifts in energy, demographics, and geopolitics.
For investors and traders, understanding inflation means understanding market performance. It dictates central bank actions, bond yields, sectoral rotations, and even investor psychology.
The key takeaway: Markets can thrive under mild-to-moderate inflation, but elevated inflation demands strategic repositioning. In 2025, successful investors are those who embrace flexibility, hedge intelligently, and adapt to inflation’s multi-dimensional impact.

Inflation & Interest Rates Shape Commodity PricesIntroduction
Commodities are the building blocks of the global economy. Crude oil fuels industries and transport, metals like copper and aluminum are vital for infrastructure and technology, while agricultural products like wheat, corn, and soybeans feed billions of people. But what truly drives their prices beyond just supply and demand?
Two of the most powerful forces are inflation and interest rates. These economic levers not only dictate consumer purchasing power and business costs, but also ripple through investment flows, currency valuations, and ultimately, the price of commodities across the globe.
In this discussion, we’ll dive deep into how inflation and interest rates shape commodity markets, exploring both theory and real-world cases, while keeping the explanation practical and easy to follow for traders, investors, and learners.
1. The Link Between Commodities and Inflation
1.1 Why Commodities Reflect Inflation
Commodities are often called the “canary in the coal mine” for inflation. That’s because:
When prices of raw materials like oil, metals, and food rise, the cost of finished goods increases.
Rising commodity prices feed into Consumer Price Index (CPI) and Wholesale Price Index (WPI).
This makes commodities not just a victim of inflation but also a driver of inflation.
For example:
If crude oil rises from $60 to $90 per barrel, fuel prices climb, logistics costs rise, and nearly every product (from groceries to electronics) becomes more expensive.
If wheat and corn prices jump, bread, meat, and packaged foods see higher retail prices.
Thus, inflation and commodities have a feedback loop.
1.2 Commodities as an Inflation Hedge
Investors often rush into commodities during inflationary times. Why?
Unlike paper currency, which loses value when inflation is high, commodities retain real value.
Gold, for instance, is historically seen as a store of value when fiat currencies weaken.
Energy and food are unavoidable necessities, so demand remains resilient even when money loses purchasing power.
This means in inflationary phases, commodity demand often rises not just for consumption, but for investment and speculation.
2. The Role of Interest Rates in Commodity Prices
Interest rates—set by central banks like the U.S. Federal Reserve, the RBI in India, or the ECB in Europe—act as the steering wheel of the economy. They determine the cost of borrowing, capital flows, and ultimately, investment appetite.
2.1 High Interest Rates and Commodities
When interest rates rise:
Borrowing becomes expensive, slowing down industrial production and construction.
This reduces demand for industrial commodities like steel, copper, and aluminum.
Investors shift money from risky assets (like commodities) into safe interest-bearing assets (like bonds).
Higher rates strengthen the local currency, which usually pushes commodity prices down (since most commodities are priced in USD).
Example: When the Fed raised interest rates aggressively in 2022, copper and aluminum prices dropped, reflecting weaker industrial demand.
2.2 Low Interest Rates and Commodities
When rates fall:
Borrowing is cheaper, stimulating economic activity.
Demand for commodities like oil, metals, and agricultural goods rises.
Investors seek returns in riskier assets, driving money into commodities and equities.
A weaker currency (due to low rates) often makes dollar-priced commodities cheaper for global buyers, increasing demand.
Example: After the 2008 global financial crisis, the Fed cut rates to near zero. Easy liquidity flooded into commodities, driving gold to record highs above $1,900 by 2011.
3. Inflation + Interest Rates: The Push-Pull Effect
Inflation and interest rates are not independent—they are two sides of the same coin. Central banks raise or lower interest rates mainly to control inflation.
High Inflation → Higher Interest Rates → Commodities pressured
Low Inflation → Lower Interest Rates → Commodities supported
But it’s not always linear. Some commodities, like gold, may rise both when inflation is high and when interest rates are high (if real interest rates are still negative).
4. Commodity-Specific Impacts
Let’s break down how inflation and interest rates affect major categories of commodities.
4.1 Energy (Oil, Natural Gas, Coal)
Inflationary effect: Energy is a primary driver of inflation since it impacts transport, electricity, and production costs. Rising oil prices often signal or cause inflation.
Interest rate effect: Higher rates can reduce oil demand as industries slow, but if inflation is too high, oil can still rise despite rate hikes (e.g., during 2022 Russia-Ukraine conflict).
4.2 Precious Metals (Gold, Silver, Platinum)
Inflationary effect: Gold and silver thrive when inflation is high, as investors use them as a hedge.
Interest rate effect: High interest rates typically hurt gold (since it doesn’t yield interest). However, if inflation exceeds rate levels (negative real interest rates), gold still shines.
4.3 Industrial Metals (Copper, Aluminum, Nickel)
Inflationary effect: Rising input and construction costs lift industrial metal prices.
Interest rate effect: Rate hikes slow housing, manufacturing, and infrastructure demand, weakening these metals.
4.4 Agricultural Commodities (Wheat, Corn, Soybeans, Sugar)
Inflationary effect: Food inflation hits hardest because it’s essential. Rising wages and population growth amplify the impact.
Interest rate effect: Higher rates increase farming credit costs and slow global trade, but food demand remains relatively inelastic.
5. Global Currency Connection
Most commodities are priced in U.S. dollars. That means:
When U.S. interest rates rise, the dollar strengthens, making commodities more expensive for buyers in other currencies → lower demand.
When rates fall, the dollar weakens, boosting demand globally → higher prices.
Thus, the USD Index and commodities often move inversely.
6. Historical Case Studies
6.1 1970s Stagflation
High oil prices + high inflation + weak growth.
Gold surged as an inflation hedge.
Central banks struggled to balance rates without worsening recession.
6.2 2008 Global Financial Crisis
Fed slashed rates → liquidity rush into commodities.
Gold, oil, and copper soared until demand collapsed during the recession.
6.3 2020 Pandemic & 2021–22 Inflation Surge
Initially, oil collapsed (negative prices in April 2020).
Massive stimulus + low rates → commodities roared back in 2021.
By 2022, inflation hit multi-decade highs → Fed hiked rates aggressively → commodity rally cooled except for energy (fueled by Ukraine war).
7. The Trader’s Perspective
For commodity traders and investors, understanding this cycle is critical:
Track inflation indicators (CPI, WPI, PPI).
Follow central bank policy (Fed, RBI, ECB).
Watch bond yields (real vs nominal).
Monitor USD Index (inverse relationship with commodities).
Example:
If inflation is rising but interest rates are low → bullish for commodities.
If inflation is peaking and central banks are hiking rates aggressively → bearish for commodities (except gold sometimes).
8. The Future: AI, Green Energy & Inflation Dynamics
Looking ahead:
Energy transition (from fossil fuels to renewables) will reshape how inflation flows into commodity markets. Lithium, cobalt, and rare earths may act like “new oil.”
AI-driven trading will make interest rate expectations even more quickly reflected in commodity prices.
Geopolitical conflicts will add to supply-driven inflation shocks, as seen in oil and wheat during Russia-Ukraine.
Conclusion
Inflation and interest rates are like the yin and yang of commodity pricing. Inflation fuels higher prices by raising demand for real assets, while interest rates act as the braking system, cooling overheated demand and strengthening currencies.
For traders, investors, and businesses, understanding this balance is essential. Commodities don’t just respond to supply and demand—they are deeply intertwined with monetary policy, global currency flows, and the psychology of inflation.
In simple terms:
Inflation pushes commodities up.
Interest rates can pull them down.
But the net effect depends on timing, central bank actions, and market sentiment.
Mastering this relationship is the key to anticipating commodity price trends in an ever-changing global economy.
Part 10 Trading Master Class 1. Introduction – What are Options?
Imagine you want to buy a house, but you are not fully sure. The seller says:
“You can pay me ₹1 lakh today as a token, and within the next 3 months you have the right (not obligation) to buy this house for ₹50 lakh. If you don’t buy, I will keep your ₹1 lakh.”
That token money is exactly like an option premium.
If house prices shoot up to ₹60 lakh, you can buy it at ₹50 lakh (huge profit).
If prices fall to ₹40 lakh, you don’t buy, and you only lose ₹1 lakh.
This is the essence of options trading:
Right but not obligation to buy/sell at a fixed price within a fixed time.
Limited loss (premium paid).
Unlimited potential profit.
In stock markets, instead of houses, you deal with shares, indexes, or commodities.
2. How Options Work
Options are part of the derivatives market (value is derived from something else).
Underlying asset: Could be NIFTY, Bank NIFTY, Reliance stock, Gold, etc.
Strike price: Pre-decided price at which you may buy/sell.
Expiry: Fixed date (weekly/monthly).
Premium: Price you pay to buy the option.
Options are of two main types:
Call Option (CE) → Right to buy at a fixed price.
Put Option (PE) → Right to sell at a fixed price.

Part 9 Trading Master Class Options in Indian Markets
Options are hugely popular in India, especially on NIFTY & Bank NIFTY.
Weekly expiries (every Thursday) attract massive trading.
Liquidity is high → easy to enter/exit.
Retail traders mostly buy options, institutions mostly sell options.
Example:
Bank NIFTY at 48,000.
Retail traders buy 48,500 CE or 47,500 PE hoping for movement.
Institutions sell far OTM options like 49,500 CE or 46,500 PE to collect premium.
Psychology & Discipline
Most beginners lose in options because:
They only buy OTM options (cheap but low probability).
They ignore time decay (premium melts fast).
They overtrade with leverage.
Success in options = discipline, risk control, strategy, patience.
Pro tips:
Never put all money in one trade.
Understand probability – 70% of options expire worthless.
Use stop-loss and position sizing.

Part 8 Trading Master Class Calls & Puts with Real-Life Examples
Call Option Example
Suppose Reliance stock is trading at ₹2,500.
You buy a Call Option with strike price ₹2,600, paying a premium of ₹50.
If Reliance goes to ₹2,800, your profit = (2800 - 2600 - 50) = ₹150 per share.
If Reliance stays below 2600, you lose only the premium = ₹50.
A call option = bullish bet (you expect prices to rise).
Put Option Example
NIFTY is at 22,000.
You buy a Put Option strike 21,800, premium ₹80.
If NIFTY falls to 21,200 → Profit = (21800 - 21200 - 80) = ₹520 per lot.
If NIFTY rises above 21,800, you lose only ₹80.
A put option = bearish bet (you expect prices to fall).
Why Traders Use Options
Options are powerful because they allow:
Leverage – Control large value with small money (premium).
Example: Buying Reliance stock directly at ₹2,500 may cost ₹2.5 lakh (100 shares). But buying a call option may cost just ₹5,000.
Hedging – Protect portfolio from losses.
Example: If you hold Infosys shares, you can buy a put option to protect against downside.
Speculation – Bet on market direction with limited risk.
Income generation – Selling options (covered calls, cash-secured puts) generates steady income.

Part 7 Trading Master Class Calls & Puts with Real-Life Examples
Call Option Example
Suppose Reliance stock is trading at ₹2,500.
You buy a Call Option with strike price ₹2,600, paying a premium of ₹50.
If Reliance goes to ₹2,800, your profit = (2800 - 2600 - 50) = ₹150 per share.
If Reliance stays below 2600, you lose only the premium = ₹50.
A call option = bullish bet (you expect prices to rise).
Put Option Example
NIFTY is at 22,000.
You buy a Put Option strike 21,800, premium ₹80.
If NIFTY falls to 21,200 → Profit = (21800 - 21200 - 80) = ₹520 per lot.
If NIFTY rises above 21,800, you lose only ₹80.
A put option = bearish bet (you expect prices to fall).
Why Traders Use Options
Options are powerful because they allow:
Leverage – Control large value with small money (premium).
Example: Buying Reliance stock directly at ₹2,500 may cost ₹2.5 lakh (100 shares). But buying a call option may cost just ₹5,000.
Hedging – Protect portfolio from losses.
Example: If you hold Infosys shares, you can buy a put option to protect against downside.
Speculation – Bet on market direction with limited risk.
Income generation – Selling options (covered calls, cash-secured puts) generates steady income.

Option Trading 1. Introduction – What are Options?
Imagine you want to buy a house, but you are not fully sure. The seller says:
“You can pay me ₹1 lakh today as a token, and within the next 3 months you have the right (not obligation) to buy this house for ₹50 lakh. If you don’t buy, I will keep your ₹1 lakh.”
👉 That token money is exactly like an option premium.
If house prices shoot up to ₹60 lakh, you can buy it at ₹50 lakh (huge profit).
If prices fall to ₹40 lakh, you don’t buy, and you only lose ₹1 lakh.
This is the essence of options trading:
Right but not obligation to buy/sell at a fixed price within a fixed time.
Limited loss (premium paid).
Unlimited potential profit.
In stock markets, instead of houses, you deal with shares, indexes, or commodities.
2. How Options Work
Options are part of the derivatives market (value is derived from something else).
Underlying asset: Could be NIFTY, Bank NIFTY, Reliance stock, Gold, etc.
Strike price: Pre-decided price at which you may buy/sell.
Expiry: Fixed date (weekly/monthly).
Premium: Price you pay to buy the option.
Options are of two main types:
Call Option (CE) → Right to buy at a fixed price.
Put Option (PE) → Right to sell at a fixed price.

PCR Trading StrategyMoneyness of Options
Moneyness shows whether the option has intrinsic value:
In the Money (ITM): Already profitable if exercised.
At the Money (ATM): Strike price = market price.
Out of the Money (OTM): No intrinsic value, only time value.
Factors Affecting Option Prices (Option Greeks)
Options are influenced by multiple factors:
Delta: Sensitivity to underlying price changes.
Gamma: Sensitivity of Delta.
Theta: Time decay – options lose value as expiry nears.
Vega: Sensitivity to volatility.
Rho: Sensitivity to interest rates.
Payoff Profiles
Buyer of Call/Put: Limited loss (premium), unlimited profit.
Seller of Call/Put: Limited profit (premium), unlimited or large risk.

Divergence SecretsWhat Are Options?
Options are derivative contracts that give the buyer the right (but not the obligation) to buy or sell an underlying asset (like stocks, index, currency, or commodity) at a predetermined price on or before a specific date.
Call Option (CE): Right to buy.
Put Option (PE): Right to sell.
Key Terms in Options
To understand options, you must know these basics:
Strike Price: The pre-decided price at which you can buy/sell the asset.
Premium: The cost you pay to buy the option contract.
Expiry Date: The date when the option contract ends.
Underlying Asset: The stock, index, or commodity linked to the option.
Lot Size: Minimum quantity you can trade in options (e.g., Nifty lot = 50 units).
Call vs Put Options
Call Option Buyer: Expects price to rise (bullish).
Put Option Buyer: Expects price to fall (bearish).
Call Option Seller: Expects price to stay below strike.
Put Option Seller: Expects price to stay above strike.

Part 2 Support And ResistanceWhy Trade Options?
Leverage – You control large positions with small capital (premium).
Hedging – Protect portfolio from losses. (Insurance-like function).
Speculation – Bet on price movement (up, down, or sideways).
Income Generation – By selling options (collecting premiums).
Example in Real Life
Suppose you think Nifty (index) will go up:
Instead of buying Nifty futures (which needs big margin),
You buy a Nifty Call Option by paying just a small premium.
If Nifty rises, your profit multiplies due to leverage.
If Nifty falls, your maximum loss is only the premium paid.
In simple words: Options = flexibility + leverage + risk control.
They are widely used by retail traders, institutions, and hedgers across the world.

Part 1 Support And ResistanceWhat are Options?
Options are a type of derivative instrument in financial markets.
This means their value is derived from an underlying asset, such as stocks, indices, commodities, or currencies.
An option gives you the right, but not the obligation, to buy or sell the underlying asset at a predefined price (strike price) before or on a specific date (expiry date).
Types of Options
Call Option – Right to buy an asset at a fixed price before expiry.
Example: If you buy a call option of Reliance at ₹2,500, and the stock goes up to ₹2,700, you can still buy at ₹2,500 and profit.
Put Option – Right to sell an asset at a fixed price before expiry.
Example: If you buy a put option of Infosys at ₹1,500, and the stock falls to ₹1,300, you can still sell at ₹1,500 and profit.
Key Terms in Options
Premium – Price you pay to buy the option.
Strike Price – Pre-decided price at which you can buy/sell.
Expiry – The last date till which the option is valid.
ITM (In the Money) – Option has intrinsic value.
OTM (Out of the Money) – Option has no intrinsic value (only time value).

Event-Driven & Earnings Trading1. Introduction to Event-Driven Trading
Event-driven trading is a strategy where traders take positions in securities based on the expectation of a specific event and its potential market impact. Unlike long-term investors who might ignore short-term fluctuations, event-driven traders thrive on these catalysts because they create rapid price movements.
Events can be company-specific (like an earnings release), sector-wide (like regulatory approval for a new drug), or macroeconomic (like a Federal Reserve interest rate decision).
Key Characteristics:
Focuses on short- to medium-term price movements.
Involves research, timing, and speed.
Relies heavily on information flow and news tracking.
Often used by hedge funds, proprietary traders, and active retail traders.
2. Types of Event-Driven Trading
There are many forms of event-driven trading. Here are the most important ones:
a) Earnings Announcements
Quarterly earnings reports are one of the most predictable events. They reveal a company’s profitability, revenue growth, and outlook. Traders position themselves before or after these announcements.
Pre-earnings trades: Betting on volatility leading up to the release.
Post-earnings trades: Reacting quickly to surprises (earnings beats or misses).
b) Mergers & Acquisitions (M&A)
When companies announce mergers, the stock prices of both target and acquiring firms react sharply. Event-driven traders try to profit from these discrepancies.
Merger arbitrage: Buying the target company’s stock at a discount to the announced acquisition price, while sometimes shorting the acquirer.
c) Regulatory & Legal Events
Approval or rejection of drugs, antitrust rulings, or new government policies can send sectors soaring or crashing. For instance, a favorable ruling for a tech company can boost its stock, while a ban can sink it.
d) Macroeconomic Events
These include interest rate decisions, inflation reports, GDP data, central bank speeches, and geopolitical tensions. Traders anticipate how these events affect equities, currencies, and commodities.
e) Corporate Announcements Beyond Earnings
Stock splits
Dividend declarations
Buybacks
Management changes
3. Earnings Trading: A Specialized Event-Driven Strategy
Earnings trading is perhaps the most popular form of event-driven trading because:
Earnings dates are known well in advance.
The results often cause large price gaps.
Institutional investors and analysts closely track them.
Key Earnings Components:
Earnings Per Share (EPS): Profit divided by outstanding shares.
Revenue Growth: Top-line performance.
Guidance: Management’s future expectations.
Margins: Profitability ratios.
A company that beats analyst expectations often sees its stock jump, while a miss usually causes a drop. However, markets sometimes react differently than expected due to guidance, sentiment, or broader market conditions.
4. How Event-Driven & Earnings Trading Works in Practice
Let’s break down the trading process step by step.
Step 1: Research and Preparation
Track corporate calendars: Know when earnings, product launches, or policy announcements are scheduled.
Read analyst estimates: Consensus EPS/revenue forecasts.
Check historical reactions: How has the stock moved in past earnings?
Step 2: Pre-Event Positioning
Some traders enter before the event, speculating on outcomes. This is riskier but offers high reward if they are right.
Step 3: Trading During the Event
High-frequency traders (HFTs) and algorithmic traders react within milliseconds to earnings headlines or economic data. Retail traders typically react slightly slower, but can still profit from post-announcement moves.
Step 4: Post-Event Trading
Markets often overreact initially, creating opportunities for mean reversion or continuation plays. Skilled traders wait for confirmation before entering.
5. Tools for Event-Driven & Earnings Traders
To succeed, traders use a mix of technology, data, and analysis:
Economic & earnings calendars (e.g., Nasdaq, Investing.com, NSE/BSE announcements).
News terminals (Bloomberg, Reuters, Dow Jones Newswires).
Options market data: Implied volatility often spikes before earnings.
Charting tools & technical analysis for timing entries/exits.
Sentiment analysis tools: Tracking social media, analyst ratings, insider activity.
6. Trading Strategies
a) Pre-Earnings Volatility Trading
Buy options (straddles/strangles) expecting large price swings.
Short options if volatility is overpriced.
b) Post-Earnings Drift
Stocks often continue moving in the direction of the earnings surprise for several days or weeks. Traders ride this momentum.
c) Gap Trading
When a stock gaps up or down after earnings, traders wait for pullbacks or breakouts to position.
d) Merger Arbitrage
Buy the target, short the acquirer. Profit when the deal closes.
e) Event Hedging
Using options or futures to hedge positions ahead of risky events.
7. Risks in Event-Driven & Earnings Trading
While potentially rewarding, these strategies carry unique risks:
Event Uncertainty: Even if you predict earnings correctly, stock reaction may differ.
Volatility Risk: Sudden price gaps can wipe out traders using leverage.
Liquidity Risk: Smaller stocks may not have enough trading volume.
Information Asymmetry: Institutions with faster access to data may move ahead of retail traders.
Overconfidence: Traders often assume they can “predict” outcomes better than the market.
8. Psychology of Event-Driven Trading
Event-driven trading is highly psychological because it involves anticipation and reaction. Common biases include:
FOMO (Fear of Missing Out): Jumping into trades too late.
Confirmation Bias: Interpreting results in line with pre-existing beliefs.
Overtrading: Trying to catch every earnings play.
Emotional Volatility: Stress from sudden price moves.
Traders who remain calm, disciplined, and data-driven usually succeed more consistently.
9. Institutional vs. Retail Approaches
Institutions:
Have quants, algorithms, and real-time feeds.
Specialize in merger arbitrage, distressed debt, macro-event plays.
Can hedge using derivatives efficiently.
Retail Traders:
Limited by speed and access to insider info.
Best focus is earnings trading, technical post-event setups, or selective option strategies.
10. Case Studies
Case 1: Tesla Earnings
Tesla often beats or misses expectations dramatically, causing 8–15% post-earnings moves. Traders use options straddles to capture volatility.
Case 2: Pfizer & FDA Approval
When Pfizer announced vaccine approval, the stock spiked sharply. Event-driven traders who anticipated approval profited heavily.
Case 3: Reliance Jio Deals (India)
During 2020, Reliance Industries announced multiple foreign investments in Jio. Each event triggered price rallies, rewarding event-driven traders.
Conclusion
Event-driven and earnings trading is not for the faint-hearted—it demands preparation, quick thinking, and strong discipline. While the potential rewards are high, so are the risks. The best traders treat it as a probability game, not a prediction contest.
By mastering research, tools, psychology, and risk management, traders can consistently capture opportunities from corporate earnings, M&A deals, regulatory events, and macroeconomic announcements.
In short, event-driven trading is about being at the right place at the right time—but with the right plan.