Bitcoin bybit chart analysis February 6
Hello
It's a Bitcoinguide.
If you have a "follower"
You can receive comment notifications on real-time travel routes and major sections.
If my analysis is helpful,
I would like one booster button at the bottom, please.
Bitcoin 30 minute chart.
Recently, the price has continued to decline to the right without any significant fluctuations.
Upper gap (this week) / Lower gap based on 2 weeks ago
Because the current position is the major support line in the pattern
Based on Nasdaq's upward trend or extreme sideways trend
Since Bitcoin has a fast turnover rate, we carried out a long position strategy.
*In arrow movement path
One-way long position strategy
1. $22847.5 entry into long position / stop loss when breaking the green support line
-> Gap $23,406 1st target -> Top price $23636.5 Final target
The current position is a position with some power.
Because the judgment can be ambiguous in the case of sideways
The stop loss progressed leisurely to the green support line.
For normal movement,
It seems that the purple support line will not be easily broken at the current position.
My analysis is for reference only.
I hope you operate safely with principle trading / stop loss essential.
thank you.
Zoomex

Bitcoin bybit chart analysis February 3
Hello
It's a Bitcoinguide.
If you have a "follower"
You can receive comment notifications on real-time travel routes and major sections.
If my analysis is helpful,
I would like one booster button at the bottom, please.
Bitcoin 30 minute chart.
It is a one-way long position strategy.
I think there are a lot of people with long arms.
Let's try again today.
*In light blue finger movement path
long position strategy
1. $23309.5 long position entry section / Stop loss when breaking the green support line -> $24082 long position target
Depending on the situation, the green support line can become a major rebound zone.
A breakout of the green support line could lead to further corrections starting next week.
My analysis is for reference only.
I hope you will operate safely with principle trading / stop loss essential.
Have a good weekend
thank you.

Bitcoin bybit chart analysis February 2
Hello
It's a Bitcoinguide.
If you have a "follower"
You can receive comment notifications on real-time travel routes and major sections.
If my analysis is helpful,
I would like one booster button at the bottom, please.
Bitcoin 30 minute chart.
It is a one-way long position strategy.
*In light blue finger movement path
1. $23684 long position entry section / stop loss when breaking the green support line -> $24671.5 long position target.
I might miss the entry point
I did it as tight as possible.
My analysis is for reference only.
I hope you operate safely with principle trading / stop loss essential.
thank you.

Bitcoin bybit chart analysis February 1
Hello
It's a Bitcoinguide.
If you have a "follower"
You can receive comment notifications on real-time travel routes and major sections.
If my analysis is helpful,
I would like one booster button at the bottom, please.
Bitcoin 30 minute chart.
It is a one-way short position strategy.
To be precise, it is a long -> short -> long switching strategy.
*At the red arrow path
1. $22969.5 long position entry section / stop loss when light blue support line breaks / long position target $23296.5
2. $23296.5 short position switching / stop loss when the red resistance line is broken
3. $22795 long position switching / stop loss when breaking the light blue support line
Today, due to the announcement of interest rates, there are many variables including Nasdaq.
I was able to afford to lose my hand.
In case of falling from the current position,
Please refer to the 3 sections of the light blue finger gap at the bottom -> Bottom price.
My analysis is for reference only.
Please operate safely as principle trading / stop loss is essential.
thank you.

Bitcoin bybit chart analysis January 31
Hello
It's a Bitcoinguide.
If you have a "follower"
You can receive comment notifications on real-time travel routes and major sections.
If my analysis is helpful,
I would like one booster button at the bottom, please.
Bitcoin 30 minute chart.
In the case of Bitcoin
There is no danger signal, and the pattern is broken, but it is a condition for a rebound.
Same as yesterday, I will go long position again.
*In arrow movement path
One-way long position strategy
1. $22870.5 long position entry section / stop loss when green support line breaks / $23189.5 long position 1st target -> Good final target
In case of a correction or further decline, pay attention to the Gap3 section.
My analysis is for reference only.
Please operate safely as principle trading / stop loss is essential.
thank you.

Bitcoin bybit chart analysis January 30
Hello
It's a Bitcoinguide.
If you have a "follower"
You can receive comment notifications on real-time travel routes and major sections.
If my analysis is helpful,
I would like one booster button at the bottom, please.
Bitcoin 30 minute chart.
It is a one-way long position strategy.
*In light blue finger movement path
1. Entry into long position at $22,968 / stop loss when breaking the green support line
The price target is $22563.5 up to the top price.
The Gap4 return is completed with the adjustment a little while ago.
Even the Nasdaq variable took a break.
In addition, the purple support line must not be broken until after 9:00, when the 12-hour bar is created.
Your strategy will increase your chances of success.
My analysis is for reference only.
I hope you operate safely with principle trading / stop loss essential.
thank you.

Bitcoin bybit chart analysis January 27
Hello
It's a Bitcoinguide.
If you have a "follower"
You can receive comment notifications on real-time travel routes and major sections.
If my analysis is helpful,
I would like one booster button at the bottom, please.
Bitcoin 30 minute chart.
This is a one-way neutral strategy.
Today, the potential for sideways movement is very high.
# As indicated above, there is a possibility of whipsaw
#Bitcoin pattern, Gap3 retracement is correct
# In the case of Nasdaq, it is upward trending
A total of three branching points.
Please pay attention to the sideways section of the orange resistance line / green support line.
*I focused on the upward arrow path.
1. Entry into long position at $22914 / stop loss when breaking the green support line
2. $23424.5 short position / stop loss when the red resistance line is broken
3. $22646.5 long position switching / stop loss when breaking the orange support line
The probability of success is very low as there are many diverging points.
In case of further decline or strategy failure,
At the bottom, the sky blue finger -> purple finger section is displayed, so please refer to it.
I hope you operate well according to real-time movement.
My analysis is for reference only.
I hope you operate safely with principle trading / stop loss essential.
thank you.

Bitcoin bybit chart analysis January 26
Hello
It's a Bitcoinguide.
If you have a "follower"
You can receive comment notifications on real-time travel routes and major sections.
If my analysis is helpful,
I would like one booster button at the bottom, please.
Bitcoin 30 minute chart.
It is a one-way short position strategy.
To be precise, it is a short -> long switching strategy.
*In light blue finger movement path
1. $22972.5 short position / stop loss when orange resistance line is broken
2. $22,176 long position switching / stop loss when breaking the light blue support line
The long position target is $23154.5,
Because it is a rebound after Gap3 retracement
You may continue to take the long position trend again.
My analysis is for reference only.
I hope you operate safely with principle trading / stop loss essential
thank you.

Bitcoin bybit chart analysis January 20
Hello
It's a Bitcoinguide.
If you have a "follower"
You can receive comment notifications on real-time travel routes and major sections.
If my analysis is helpful,
I would like one booster button at the bottom, please.
This is a one-way long position strategy on the 30-minute chart.
*In arrow movement path
1. Entry into long position at $20872 / Stop loss when breaking the green support line / Target is $21730
according to Nasdaq
Bitcoin is also unable to catch the direction and continues to move sideways.
With the Nasdaq as the focus, I made a strategy to the degree of upward trend,
Long and short no positions, principle trading and stop loss are required for each position, so please operate safely.
Happy New Year's Day.
thank you.

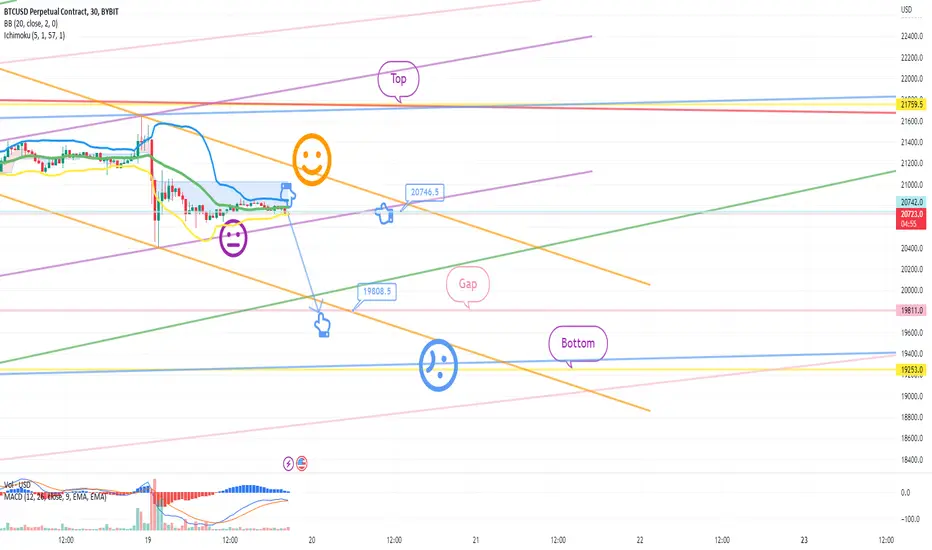
Bitcoin bybit chart analysis January 19
Hello
It's a Bitcoinguide.
If you have a "follower"
You can receive comment notifications on real-time travel routes and major sections.
If my analysis is helpful,
I would like one booster button at the bottom, please.
Bitcoin 30 minute chart.
It is a one-way short position strategy.
To be precise, it is a short -> long switching strategy.
Light blue finger movement path
1. $20729.5 short position entry section / stop loss when orange resistance line completely breaks through
2. Long position switching at 19808.5 USD / stop loss when breaking the light blue support line
The long position target is $20746.5.
My analysis is for reference only, please.
I hope you operate safely with principle trading / stop loss essential
thank you.
Bitcoin bybit chart analysis January 12
Hello
A guide to Bitcoin.
long time no see.
It is also planned to be reorganized in the future.
Today is an important CPI announcement day.
We will proceed with full disclosure.
Bitcoin 30 minute chart.
It is a light blue finger one-way long position strategy.
*17942 Long / Stop Loss when breaking the green support line / The final target is Good -> $19329.5.
My analysis is for reference only.
I hope you operate safely with principle trading / stop loss essential.
thank you.

BTCUSD Bybit Chart Analysis June 16
Hello.
“Make it simple, make profit”
It’s BitcoinGuide.
Don’t forget to
“Follow” me and press “Likes”.
If you "follow" press,
Only 30 Min chart ,
In real time, you can check major sections and move,
Real-time "update I dea" can be checked.
I will begin BTCUSD Bybit Bitcoin Chart Analysis for June 16.
After the final comment, this is the Bitcoin 30-minute chart.
Yesterday was a long-> short switching strategy.
After damaging the pink support line, I modified it to a final short strategy.
Within the purple channel I marked,
It ended with a up-ward sideway move.
The strategy is to deal with a stop loss.
Those who passed the man test are honest,
I think you've made about $2514 in profit.
After touching the 3-hour support line, a rebound followed the Nasdaq.
Because it wasn't a flashlight
Further adjustments are likely.
* Follow Nasdaq or touch the support line at the bottom
How will the movement come about?
I'll take a look at it in its entirety.
Bitcoin 4 hour chart
Was it a short strategy in today's voting?
To avoid confusion, we plan to ignore the Nasdaq and proceed with the strategy.
Approximate top price and bottom price are displayed
around the purple support line
Check the red up/light blue down movement path
I made today's trading strategy.
bitcoin 30 minute chart,
This is a one-way short position strategy.
To be precise, it is a short -> long switching strategy.
Today's biggest variable, if you don't follow the Nasdaq
3-hour support line / touch downtrend
4-hour central line short position operation section
As a chart junkie, it is correct to go down to take a picture at the bottom.
There are no major indicators announced today.
Nasdaq is a neglected strategy.
* When the light blue finger moves
Short -> Long Switching Strategy
1. $22394 chase shot / Stop loss when the green resistance line is broken
2. $18692.5 long position switching / Stop loss when breaking the orange support line
The ambiguous part here is that if you lightly touch it, you may not get to the desired entry point.
Going deep can push you to the orange support line.
The final target will be the green resistance line.
After that, the mission is completed, so maintaining a long position and correcting stop loss would be advantageous, right?
If today's strategy succeeds
It is a rebound section of the desired entry point, so I think it would be good to operate altcoins at the same time.
I want you to stop dragging and move at once.
Don't forget to buy in principle / stop loss is essential
Fighting today.
Thanks for reading.

BTCUSD Bybit Chart Analysis May 16
Hello.
“Make it simple, make profit”
It’s BitcoinGuide.
Don’t forget to
“Follow” me and press “Likes”.
If you "follow" press,
Only 30 Min chart ,
In real time, you can check major sections and move,
Real-time "update I dea" can be checked.
I will begin BTCUSD Bybit Bitcoin Chart Analysis for May 16.
After writing the analysis on May 13th, this is the Bitcoin movement.
The details are summarized in the comments at the bottom of the analysis article.
I marked the main sections with black fingers,
Apart from the Nasdaq, there is no big wave,
The sidewalk was completed by the weekend.
There is no separate entry seat, so cancellation proceeds.
This is the section before the gap retracement.
Nasdaq is all over the touch of the resistance line on the 4-hour chart
Bitcoin is the period after the 4-hour resistance line touch.
30 minutes / 1 hour chart In the state where the positive luck is kept thin
The current position is a short position operation section.
I'll take a look at the whole
This is the Nasdaq 4 hour chart.
Today's approximate Top and Bottom prices are displayed.
around the green support line
Check the red up/light blue down movement path
I made today's trading strategy.
Bitcoin 4 hour chart.
The position is very ambiguous.
Following Nasdaq, if the decline accelerates
It is a seat that can be opened all the way to the bottom.
(4 , 6, 12 MACD deadcross)
around the purple support line
Red up / sky blue down movement path check
I made today's trading strategy.
This is a 30-minute chart one-way long position strategy.
There are no important indicators to be announced today.
The 12-hour MACD Golden Cross is in progress on the NASDAQ side.
In terms of fast turnover and patterns, Bitcoin is more expensive than Nasdaq.
There seems to be a high probability of hitting the lower side first.
If the purple support line is broken, it can be pushed up to the bottom.
Please be careful.
I have left the main time zone and price, so please refer to it.
1) $27675.5 long position entry section / Stop loss price when the purple support line is broken
2) 33466 short position switching section / Stop loss when the green resistance line is broken
In spot exchanges, according to the timing of entering long positions,
You may want to try short-term management of major altcoins.
Please note that there is a high possibility of sidewalking.
Principle trading / Stop loss required
Hope you operate safely
thank you.

BTCUSD Bybit Chart Analysis March 17
Hello.
“Make it simple, make profit”
It’s BitcoinGuide.
Don’t forget to
“Follow” me and press “Likes”.
If you "follow" press,
Only 30 Min chart ,
In real time, you can check major sections and move,
Real-time "update I dea" can be checked.
I will begin BTCUSD Bybit Bitcoin Chart Analysis for March 17.
This is the move after the final finish on March 16th.
More details are provided in the comments.
Black finger check for major sections.
I didn't know there was a US interest rate announcement at 3 in the morning.
According to the Nasdaq rising pattern, Bitcoin is also There was move.
Without departing from the marked sky blue support line
upward finish.
In the arrow moving path, if you accurately count only the entry section,
1) $39088 long / $1307.5 profit section
2) $40416.5 short / $456 profit section
3) 39992 long / $1502 profit section
I think it would be around $3200 round trip.
Unfortunately, Perfect failed.
Following the Nasdaq, it closed upwards.
I'll take a look at it in its entirety.
4 hour chart
Today's approximate Top and Bottom prices are displayed.
around the green support line
Check the red up/light blue down movement path
I made today's trading strategy.
This is a 30-minute chart neutral strategy.
Based on Nasdaq, MACD deck gain up to 1 hour chart
Because the pattern is somewhat broken
After the correction, a rebound / upward trend is expected.
Even if it raises strongly, because of the BB 12 hour resistance level
Adjustments seem to come out strongly,
We put Bitcoin into the Nasdaq movement.
* When the light blue finger moves
Long -> Short -> Long Switching Strategy
1. 40373.5 USD Long position entry section / Stop loss price when the purple support line is broken
(If it is pushed to the purple support line, the bottom section is the final match, and the green support line is the final match.)
2. $41255.5 short position entry section / Stop loss when the red resistance line is broken
3. 40158.5 USD long position switching section / Stop loss when the purple support line is broken
4. Hold short or long positions depending on the $41570.5 long position target and Nasdaq movement
(In general, if you come up here, it is correct to maintain a long position)
Also, if it is the biggest variable of the day,
If it is strongly raised to near the top section before 9 am tomorrow
Be careful as it is a whip-saw condition.
I was nervous until the end of this week, so it would be nice to get a good position.
Don't forget to buy in principle / stop loss is essential
thank you.

BTCUSD Bybit Chart Analysis March 16
Hello.
“Make it simple, make profit”
It’s BitcoinGuide.
Don’t forget to
“Follow” me and press “Likes”.
If you "follow" press,
Only 30 Min chart ,
In real time, you can check major sections and move,
Real-time "update I dea" can be checked.
I will begin BTCUSD Bybit Bitcoin Chart Analysis for March 16.
It is a movement after the final finish.
I linked the video and uploaded the perfect video.
And marked the main sections with black fingers.
As the Nasdaq rebounded without correction,
Bitcoin has also made good moves.
I was pushed down one beat
Arrow movement path / along the blue support line
30-minute chart without touching support line,
$38733.5 Long position entry / $2412 profit section up to the top price.
It seems that there are some people who are maintaining long positions.
You seem to be getting used to Nasu Chicken?
(NASDAQ -> daq = Korea same Chicken)
It looks like there will be some interesting moves today.
Take a good look at the whole
See you in the analysis article.
Nasdaq 30-minute chart
Two analyzes are performed each morning.
Please watch it for fun.
From the next analysis, we will only upload Bitcoin.
Because of the time zone pattern, save it without modification
Start analyzing bitcoin
4 hour chart
Today's approximate Top/Bottom price is displayed.
Red up / sky blue down movement path check
I made today's trading strategy.
(Due to the lack of color, support lines 1 and 2 at the bottom are unified in pink.)
This is a 30-minute chart one-way long position strategy.
According to the Nasdaq movement, we have prepared the perfect details in detail.
There is an indicator announcement at 9:30, just like yesterday.
Rather than making a big move, I think it might be a role that gives strength to the sideways movement.
* When the red arrow moves
Long -> Short -> Long Switching Strategy
I think it would be good to run short positions in the middle.
It seems important whether or not the sky blue support line is broken at the beginning.
watch over me,
only in the main section
1) $40416.5 short / Stop loss when the pink resistance line is broken
2) $39114.5 long position switching section / Stop loss when the green support line is broken / Marked without a price because it looks messy
3) 41707.5 $ 41707.5 short position entry section / Stop loss when the red resistance line is broken
4) 40416.5 long position switching section / Stop loss when breaking off the sky blue support line
The final target is the 4,3025.5 Top section that we marked.
If the strategy is successful
Remember the move this morning?
43035.5 is an overshooting zone when breaking through.
If it rises strongly, timing it, just like the movement this morning
It is good to catch a short position from the upper tail after shooting.
It is important not to follow the chart, but to prepare in advance and lead it in front.
Even in a difficult field, if you hit your hand loss well
I don't think there will be any problems
Principle trading / Stop loss is essential. Don't forget, fighting today.
thank you.

BTCUSD Bybit Chart Analysis March 15
Hello.
“Make it simple, make profit”
It’s BitcoinGuide.
Don’t forget to
“Follow” me and press “Likes”.
If you "follow" press,
Only 30 Min chart ,
In real time, you can check major sections and move,
Real-time "update I dea" can be checked.
I will begin BTCUSD Bybit Bitcoin Chart Analysis for March 15.
After Bitcoin's last comment, it's a move.
More details are in the comments.
Please check.
Check the main section with a black finger.
Marked , light blue finger $38653.5 long position entry section
It is a profit section of up to $869.5 from the top price.
Breaking the blue support line
Because the danger zone was open up to the purple support line at the bottom
It wasn't my favorite move.
After a strong rebound,
Following the Nasdaq movement, back in place.
Because the Nasdaq is in a situation where the previous low was broken due to yesterday's movement.
We are open to the next support line.
For the time being, depending on the situation, short-term trading seems advantageous.
I'll take a closer look at the whole thing.
Nasdaq US100 4-hour chart
(The last 6 hours support line was touched, and the downside was open.
Just before the downtrend.)
Today's approximate Top and Bottom prices are displayed.
Based on the purple support line / After the indicator release at 9:30 pm
Red up / sky blue down movement path check
Today's direction seems to be decided.
The bottom section at the bottom is based on the main bar chart.
After a downtrend, this is the lower tail section.
If you look at the purple support line section as the major support lines 1 and 2,
I think it would be good
4 hour chart.
Today was very difficult.
There is no proper support line on the Nasdaq.
It's on the verge of a downtrend, so I don't know where to focus on Bitcoin.
I was worried.
Today's approximate Top and Bottom prices are displayed.
around the green support line
Check the red up/light blue down movement path
If you fall all the way to the bottom today
This is a major support line. (Section 1)
In the case of the sky blue support line, it will be a downward-right / ambiguous spot.
Created a trading strategy.
This is a 30-minute chart one-way neutral strategy.
It is a strategy that focuses on the announcement of the indicator at 9:30.
* When the red arrow moves
Long -> short -> long switching strategy.
holding a long position,
Looking at the Nasdaq flow, the possibility of an upward trend is high,
Including conditions that can be raised strongly in Bitcoin,
I started with the first long position.
1) Starting with a long position at $38795
2) Because it is a short 40167.5 dollar, there is not a lot of space to eat.
$39611.5 Long position entry section / Stop loss price when the purple support line is broken
3) $41136.5 long position target and short position entry section / Stop loss when the red resistance line is broken
4) $38642.5 long position switching / Stop loss when the green support line is broken
After that, check the Nasdaq movement, and if the rebound is strong
Maintaining long positions / switching to short positions in case of a clumsy rebound
In the current situation, I do not want to recommend a spot exchange.
In this case, while operating tight stop loss
It's not bad for short-term trading.
Depending on the strategy, only when entering the long position
Minor Alt -> Major Alt Switching Highest point to cash
I think you can try running it.
Principle trading / Stop loss is essential, I hope you operate safely.
thank you.

BTCUSD Bybit Chart Analysis March 14
Hello.
“Make it simple, make profit”
It’s BitcoinGuide.
Don’t forget to
“Follow” me and press “Likes”.
If you "follow" press,
Only 30 Min chart ,
In real time, you can check major sections and move,
Real-time "update I dea" can be checked.
I will begin BTCUSD Bybit Bitcoin Chart Analysis for March 14.
After writing the analysis on March 11th, there is no movement.
More details are provided in the comments.
I marked the main sections with black fingers.
Same as the final Nasdaq
It was an upward one-way strategy.
After a strong rebound, as the Nasdaq fell,
Bitcoin also fell sideways after falling at the same time.
sideway move after breaking away from the purple support line.
According to the Nasdaq movement, I have organized it
Personally, I proceeded with manual liquidation.
The final danger zone has reached the green support line.
The peculiar part is
Nasdaq has a gap in the lower section
Bitcoin has a gap section at the top.
Following the Nasdaq move
All stock markets around the world are following.
What kind of movement will come out today?
Let's take a closer look at the whole thing.
Nasdaq US100 4 hour chart.
Today's approximate Top and Bottom prices are displayed.
Gap reversal complete.
The blue support line is
Today's main section in education content
In case of Break away,
At the bottom, purple 1 and 2 are in a big trend.
This is the support line.
Bitcoin 4 hour chart.
Today's Top and Bottom prices are displayed.
Gap return section check
red top / sky blue bottom
We created today's trading strategy around the purple support line.
(Maximum red resistance line / green support line sideways)
This is a one-way long position on the 30-minute chart.
Nasdaq strong rebound potential + 2 full candles + Gap retracement + Monday's strong trend weighted.
If the strategy is successful today, up to 12 hours chart MACD Golden Cross
The daily chart may move after tomorrow.
4 6 12 Golden Cross, a strategy for a strong rebound.
* When the red arrow moves,
1) 38781 USD short position entry section / Stop loss when the red resistance line is broken
2) $38323 long position switching section / Stop loss when the purple support line is broken
3) The final target is $39514, and after that, it is possible to maintain short or long positions.
Today, I focused on a strong rebound from the major support line.
Those who are maintaining a long position
You just need to pay attention to the return timing/adjustment of the long position entry.
Depending on the Nasdaq movement today, the bottom section may be decided.
I think it would be good to prepare for the long-term trend with major altcoins at the spot exchange.
(Stop loss correction)
Here's today's strategy.
Principle trading / Stop loss is essential, I hope you operate safely.
thank you.

BTCUSD Bybit Chart Analysis March 11
Hello.
“Make it simple, make profit”
It’s BitcoinGuide.
Don’t forget to
“Follow” me and press “Likes”.
If you "follow" press,
Only 30 Min chart ,
In real time, you can check major sections and move,
Real-time "update I dea" can be checked.
I will begin BTCUSD Bybit Bitcoin Chart Analysis for March 11.
After writing the Bitcoin analysis on March 10th, this is a movement.
Same as Nasdaq at 10:30,
There is a movement that touches up and down
I marked , 39894, touch
Successful support at the purple support line
Up to the purple long-position switching spot support line,
Short position $1318 profit section
Unfortunately, with a difference of about 80 bucks,
Arrow Point section marked 38346 without touching
It ended after about a rebound from the purple support level.
The strategy was a great success, but
On the Nasdaq, the correction continued to without a rebound.
As it coupled with the Nasdaq, it ended in a sideways move.
I'll take a look at it in its entirety.
4 hour chart.
There was an error in the analysis.
It was a little twisted.
Please forgive me if it's a little messy.
Today's approximate top price, bottom price
around the green support line
Check the red up/light blue down movement path
I made today's trading strategy.
In the lower right corner, No. 1 and No. 2 are the ones I waited for 2 weeks ago.
This is a major support line.
It took a long time because today's analysis was twisted.
This is a 30-minute chart one-way long position strategy.
In general, all danger signs were engraved
Because the main support line is alive,
We focused on long positions based on Nasdaq movements.
* When the red arrow moves
Short -> Long -> Short -> Long Switching Strategy
1) $38910.5 short position entry section / Stop loss when the purple resistance line is broken
2) $37696 long position switching section / Stop loss when the green support line is broken
3) 40504.5 long position target and short position switching section / Long position can be maintained depending on the situation
In the spot exchange, from the timing of entering a long position, minor alt -> major alt switching
I think you can proceed.
If it breaks the green support line today
You have to be careful as it can be pushed from the bottom to the 2nd section at the bottom.
Don't forget to buy in principle / stop loss is essential
I hope you operate safely.
Have a good weekend
thank you.

BTCUSD Bybit Chart Analysis March 10
Hello.
“Make it simple, make profit”
It’s BitcoinGuide.
Don’t forget to
“Follow” me and press “Likes”.
If you "follow" press,
Only 30 Min chart ,
In real time, you can check major sections and move,
Real-time "update I dea" can be checked.
I will begin BTCUSD Bybit Bitcoin Chart Analysis for March 10.
This is the movement after writing the analysis on March 8th.
Some of you may not have seen it,
At the bottom, I have linked the private analysis article,
Be sure to check the add comments.
I marked the main sections with fingers.
The move that should have come on Tuesday, March 8
It came out on Wednesday.
While pretending to try to break out to the green support line danger zone,
Support, up to a strong rise.
Achieving a profit section of up to $3902 from the existing $38677 long.
Following the Nasdaq, it closed sideways on Tuesday, but
As an additional daily pay is created on Wednesday,
All conditions for a strong ascent are met.
There was a strong overshooting.
It's not Tuesday, it's Wednesday
In the Top section, it is pushed further upwards.
After that, the standard short position explained on the right
After touching 1 2 3, until a strong fall.
In a strange place, I strongly rolled it up
As it was coupled with the NASDAQ, it eventually returned to its original position.
Touch the Ilbong Central Line,
If you look at the 4 hour chart, you can see the thin Redcloude.
Securing a place to with a short position -> A strong decline.
The trend these days is the Nasdaq movement.
If you put it in a strange place, It goes right down.
I'll take a look at it in its entirety.
Nasdaq US100 analysis.
There is an important indicator announcement today at 10:30.
I focused here
It's been a long time since I didn't do a marine analysis,
It is not easy to predict the movement of the indicator announcement.
I'm dying to proceed with two analysis articles haha
I have marked the main sections, so please take a look.
4 hour chart
Today's approximate Top and Bottom prices are displayed.
MACD dead cross on the 4 hour chart today
How will it proceed and how will it be affected by the Nasdaq?
It seems important.
around the purple support line
Check the red up/light blue down movement path
Numbers 1 and 2 at the bottom are the mid- to long-term final support lines.
I marked
I made today's trading strategy.
This is a 30-minute chart one-way long position strategy.
Based on the light sky blue parallel line
(Overshooting section when breaking through resistance line)
From the current position, depending on the downward touch and the upward touch
Today's direction seems to be decided.
Upside, purple support
In the case of a downside, the game is won at the green support line.
I applied the Nasdaq analysis to the Bitcoin movement.
* When the light blue finger moves
1. 38346 long position entry section / Stop loss price when the pink support line is broken
(When touching up, the pink resistance line is short -> the purple support line is 38346 long wait)
2. $39894 short position entry section / Stop loss when the pink resistance line is broken
3. $37558.5 long position switching section / Stop loss when breaking the green support line
The final target will be $40972,
If the Nasdaq attempts to break through the red resistance level today and succeeds
Today's long position entry section could be the bottom section of the long-term trend.
It looks important overall, so I think you should focus on it.
Don't forget to buy in principle / stop loss is essential
Thanks for reading.

BTCUSD Bybit Chart Analysis March 7
Hello.
“Make it simple, make profit”
It’s BitcoinGuide.
Don’t forget to
“Follow” me and press “Likes”.
If you "follow" press,
Only 30 Min chart ,
In real time, you can check major sections and move,
Real-time "update I dea" can be checked.
I will begin BTCUSD Bybit Bitcoin Chart Analysis for March 7.
This is the movement after the analysis was written on March 4th.
More details are in the comments.
hold up well
BB 1 hour, 2 touches on the center line, then a downward wave
Finished off with a sky blue support line.
Near the final bottom, break out to the sky blue support line
There was no separate entry point.
Because I was personally maintaining a long position.
I have processed a stop loss / The strategy has been canceled
Existing BB 1 hour center + 4 hour support -> 4 hour support + 6 hour center
I was pushed as the pattern was broken in succession.
I've finally reached the danger zone.
While rebounding and falling in strange places
The long-position strategy was carried out as a psychological warfare.
It's a strategy failure.
Recently, it has been heavily influenced by the Nasdaq.
Regardless of the Bitcoin chart movement
It is connected to the main section.
I tried to ignore the Nasdaq move, but
Globally, it is true that it is affected.
It won't be the same movement over and over again.
Because it's important to keep up with the flow until you calm down
For the time being, we plan to focus on the Nasdaq movement.
I marked the gap between the pink gaps at the top.
Let's look at it as a whole.
4 hour chart
Today's approximate Top and Bottom prices are displayed.
Look at the black finger at the bottom.
I waited for you in the last suspicious rebound
Dark blue support line -> Pink support line is the bottom section
Based on the gap return section at the top
It's important to know what kind of movement you make.
Red up/light blue down movement path check
I made today's trading strategy.
This is a 30-minute chart one-way neutral strategy.
As explained above, I made a strategy centered on the Nasdaq.
To be precise, it is a long -> short switching strategy.
It is a strategy for Gap retracement common to Bitcoin and Nasdaq,
Lately, the Bitcoin time zone hasn't been right, either.
It seems to have been heavily influenced by the Nasdaq.
For the time being, let's proceed with the strategy while looking at the Nasdaq movement.
(In the rebound on the 28th, Bitcoin
Because it was good luck, a stronger rebound than the Nasdaq / Today is a dangerous section
There is not a high chance of a strong shot like last time)
* When the red arrow moves
Short -> Long -> Short -> Long Switching Strategy
Today at $38454 for the first short section
If the down wave is not connected and breaks through the red resistance line,
The biggest risk factor for long positions disappears.
1) $37990.5 long position entry section / Stop loss price when the purple support line is broken
2) $39,280 long position target and / short position operation section
3) $37907.5 long position switching section / Stop loss when the purple support line is broken
In case of long position or spot exchange operation
I recommend short-term trading with major altcoins just like Bitcoin.
For the time being, compared to the Nasdaq movement following today's retracement,
It is advantageous to operate
Don't forget to buy in principle / stop loss is essential
Thanks for reading
