RENDER TECHNICAL ANALYSIS - WEEKLY🗣️The #render Network has shown significant price movement, reflecting both the volatile nature of #cryptocurrencies and specific developments within its ecosystem.
👉As of the latest updates, the price of RENDER is around $4.50 USD, with a 24-hour trading volume hovering around $64 million.
❣️Here's a brief #Chart overview based on recent data
Crypto market

what is pcr and how to use it in trading ?### What is PCR (Put-Call Ratio)?
The **Put-Call Ratio (PCR)** is a popular market sentiment indicator used in options trading. It is calculated by dividing the total open interest (OI) of **puts** by the total open interest of **calls**. It helps traders understand whether the market sentiment is bullish, bearish, or neutral, based on the relative buying activity in put and call options.
#### **Formula**:
\
- **Put options**: Give the right to sell an asset at a specified price within a set time frame.
- **Call options**: Give the right to buy an asset at a specified price within a set time frame.
### How to Interpret PCR?
1. **PCR > 1**: This suggests there are more puts than calls. It generally indicates **bearish** sentiment, meaning traders expect the market to go down. A high PCR can signal that traders are hedging against a market decline or speculating that the market will drop.
2. **PCR < 1**: This suggests there are more calls than puts, which typically indicates **bullish** sentiment. Traders are expecting the market to rise, as there is more demand for buying options (calls) than for selling options (puts).
3. **PCR = 1**: This suggests a neutral market sentiment, where the number of put and call options is the same. The market could be in a balanced state with no strong bias in either direction.
4. **Extremely High PCR**: If the PCR value is very high (e.g., 1.5 or above), it could indicate that the market is **overly bearish**, and a market reversal might be imminent. This can signal a potential buying opportunity.
5. **Extremely Low PCR**: If the PCR is very low (e.g., below 0.5), it could indicate that the market is **overly bullish**, and there may be a correction or pullback ahead.
---
### How to Use PCR in Trading
#### 1. **Sentiment Indicator**:
- **Bullish Signal**: If the PCR is low (e.g., below 0.5), it indicates that more traders are betting on a market rise (via calls). It’s often used as a signal that the market might be in an overbought condition and could correct soon.
- **Bearish Signal**: If the PCR is high (e.g., above 1), it suggests that more traders are betting on a market decline (via puts). This could indicate an oversold market and a potential for a rebound or upward movement in the market.
#### 2. **Contrarian Indicator**:
- **Extremely High PCR**: When the PCR rises too much (indicating too many put options), it could mean the market is too bearish, and a **contrarian approach** might be useful. Traders might interpret this as a signal that the market is oversold and due for a reversal.
- **Extremely Low PCR**: When the PCR falls too low (indicating too many call options), it may signal over-optimism in the market, which could be a warning that a **correction** is coming soon.
#### 3. **Confirmation Tool**:
- **Use with other indicators**: PCR alone should not be relied upon for making trading decisions. It works best when combined with other technical or fundamental analysis indicators (e.g., moving averages, RSI, MACD). For instance, if you see a high PCR and the market is oversold according to technical indicators, it could confirm that a reversal is likely.
#### 4. **Market Extremes**:
- **Overbought/Oversold Conditions**: A **very low PCR** (more call buying than put buying) suggests market optimism and can be seen as overbought. A **very high PCR** suggests market pessimism and can be seen as oversold. In these cases, a reversal or a price correction could be expected.
#### Example of Trading Strategy Using PCR:
- **Bullish Setup**: PCR rises significantly, signaling excessive bearish sentiment. Technical indicators show oversold conditions (e.g., RSI below 30). You could consider buying calls or entering long positions with a higher probability of a market reversal.
- **Bearish Setup**: PCR is low, indicating excessive bullish sentiment, while technical indicators like RSI suggest the market is overbought. You could consider selling calls, buying puts, or entering short positions in anticipation of a market correction.
### Example of PCR Calculation:
Let’s say you are analyzing a stock option market:
- Total Open Interest in Puts = 200,000 contracts
- Total Open Interest in Calls = 500,000 contracts
PCR would be:
\
This low PCR (below 1) indicates a **bullish** sentiment in the market, with more traders expecting the market to rise.
---
### Key Points to Remember:
- **PCR is a sentiment tool**, not a direct price predictor.
- A **PCR above 1** typically indicates **bearish** sentiment, while **below 1** indicates **bullish** sentiment.
- An **extremely high or low PCR** might suggest market **extremes**, potentially indicating an upcoming reversal.
- **Use PCR in combination** with other technical and fundamental indicators to enhance decision-making.
In short, PCR provides a snapshot of market sentiment, and when used correctly, it can help traders make better-informed decisions, especially for understanding broader market trends or finding contrarian trading opportunities.

What is adx use in technical analysis ?The ADX quantifies trend strength by measuring directional movement over a given time frame. It provides traders with specific numbers (from 0 to 100) that represent strong or weak price trends. Traders can simply refer to the numbers to quickly assess the strength of a trend.
Traders could utilise the ADX to help them determine entry or exit points for a trade. The ADX could be used to identify potential overbought or oversold levels in the market.
Key takeaways. Average directional index (ADX) is a short-term chart indicator. It can be used to help you evaluate the market or an investment's strength. ADX currently suggests the short-term momentum behind stocks may be strong, with a caveat.

update BTC priceas I said in the previous post. We finished the first 4 candles. Now We're looking for 120k in Apr-2025.

This is what is going to happenBitcoin is about to copy its path. Are you ready to take the next move, which is inevitable.
#Hodlder 💪💪
#DiamondHands💎💎

BTC#16: Price reaction has changed positively.BTC break out SW?💎 💎 💎 In recent days, although important data information has been released, BTC is still in the Sideway zone and there are some positive signs. We continue to plan the next 💎 💎 💎
1️⃣ **Fundamental analysis:**
📊 Financial report, Fed Logan said that if the labor market remains strong, better inflation data does not necessarily mean the Fed can cut interest rates. Inflation data in the next few months will be very important; also pay attention to changes in geopolitics and policies; the impact of these factors on the economy is being closely monitored.
🚀 GameStop is considering investing in Bitcoin and other cryptocurrencies.
Three sources said GameStop is exploring investing in alternative assets, including cryptocurrencies, especially Bitcoin. GameStop shares rose nearly 20% in after-hours trading following the news.
2️⃣ **Technical analysis:**
🔹 **D Frame**: We can see that although the price has not yet escaped the Sideway zone, the continuous appearance of higher lows is a positive signal to pay attention to.
🔹 **H4 Frame**: After the price reaction at 94x, although the 97x zone has not been penetrated, the price reaction in this area is giving positive signals
🔹 **H1 Frame**: The price structure has a change from bearish to bullish. If the trendline area continues to hold, there is a high possibility that the bulls will continue to dominate next week.
3️⃣ **Trading plan:*
⛔ The economic data released last week brought many fluctuations to the US dollar, but the price of BTC still did not have any significant changes. However, with the current price reaction, we should not apply the trading strategy in the SW price zone anymore. The 2 price zones have been tested quite a lot. This is a sign of an upcoming strong fluctuation
✅ The short-term price structure is in favor of the bulls. We can consider looking for a position if the price structure shows signs.
💪 **Good luck trading!**

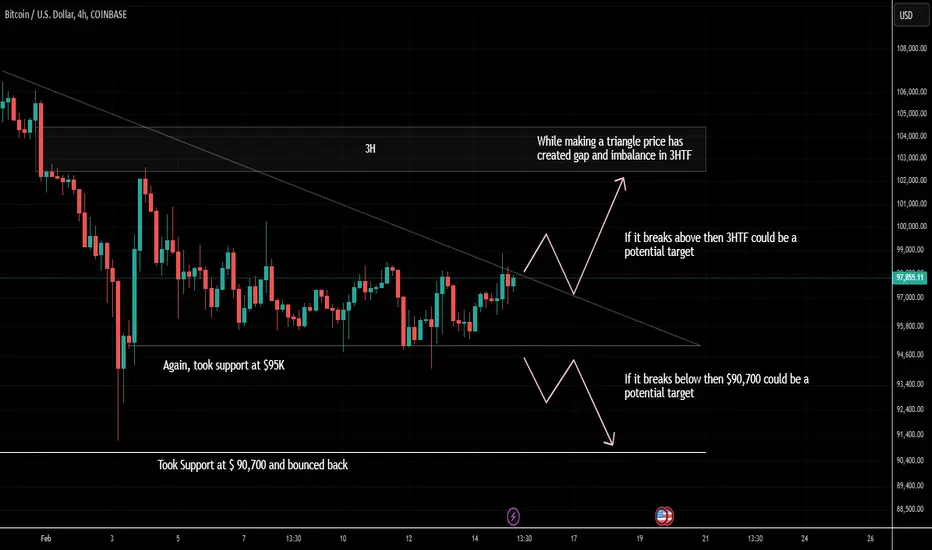
A Potential move in Bitcoin!Everything has been explained in the chart above.
BITSTAMP:BTCUSD
NOTE - JUST AN ANALYSIS!
what is Algo-trading and how to do it ?For instance, the algorithm would buy Microsoft (MSFT) shares if the current price is lower than the 20-day moving average and sell if the price exceeds the 20-day moving average. Algorithmic trading strategies can be as simple as this example, or they can be much more complex.
So, is algo trading profitable? Yes, it is possible, but there's a price attached that doesn't involve money! You must have all the knowledge to work with. It includes a fail-proof plan and risk management to protect against dangers.
How do I start trading in Algo?
How to Get Started with Algo Trading: A Step-by-Step Guide ...
Step 1: Understand the Basics. ...
Step 2: Choose Your Asset Class. ...
Step 3: Select a Trading Platform. ...
Step 4: Learn Programming. ...
Step 5: Develop Your Trading Strategy. ...
Step 6: Backtest Your Strategy. ...
Step 7: Go Live. ...
Step 8: Continuous Monitoring and Optimisation.

Ethereum at a Critical Turning Point: Head & Shoulder PatternEthereum Technical Chart Study
Ethereum is showing some interesting price action. It recently took resistance from its resistance zone and is now forming a classic Head & Shoulder pattern—a structure often signaling potential reversals.
Currently, the price is sitting right at the neckline of the Head & Shoulder pattern. If this neckline breaks, it could lead to further downside movement.
Looking below, there’s some key support to watch:
1. The 2800 resistance zone, which Ethereum broke out of earlier, hasn’t been tested yet. This zone might now act as a strong support if the price moves downward.
2. There’s also a trendline support in play, adding another layer of potential price stability.
So, what’s next?
If Ethereum breaks the neckline, we could see the price fall towards the 2800 zone or possibly to the trendline support. These are the levels to keep an eye on for the next big move.

Ethereum TechnicalEthereum has been pivotal in the blockchain space, not just for its cryptocurrency but for its platform capabilities. Its evolution continues to be watched closely by both enthusiasts and skeptics, given its impact on blockchain technology and decentralized systems. I
chart for your reference

Support sustain 190 And up side move Bullish Trends Stick follow with stoploss and
190 Level Multiple time touch and sustainability that level and bounce so Upside move Confirmed

advanced pcr tradingHowever, no PCR can be considered ideal, but usually, a PCR below 0.7 is typically viewed as a strong bullish sentiment while a PCR more than 1 is usually considered as a strong bearish sentiment.
The Put-Call Ratio (PCR) is a popular technical indicator used by investors to assess market sentiment. It is calculated by dividing the volume or open interest of put options by call options over a specific time period. A higher PCR suggests bearish sentiment, while a lower PCR indicates bullish sentiment.
It can additionally be used for individual securities by looking at the volume of puts and calls on a security over a determined time period. A high PCR is indicative of bearish sentiment while a low PCR is indicative of bullish sentiment.

Bitcoin Bybit chart analysis February 13
Hello
It's a Bitcoinguide.
If you have a "follower"
You can receive comment notifications on real-time travel routes and major sections.
If my analysis is helpful,
Please would like one booster button at the bottom.
This is the Bitcoin 30-minute chart.
There will be a Nasdaq indicator announcement at 10:30 in a little while.
Nasdaq touched the resistance line of the 4-hour Bollinger Band chart,
but Bitcoin failed to touch the resistance line,
so the adjustment is coming out stronger.
There are Nasdaq variables, and the pattern is broken, so today's analysis was also very difficult.
It's complicated, but I made the strategy as simple as possible.
There are many key contents, so please check the analysis article carefully.
*Red finger movement path
One-way long position strategy
1. 95338.5 dollars long position entry section / stop loss price when blue support line is broken
2. 97967 dollars long position 1st target -> Top 2nd target
(After reaching the top section, long position liquidation, until short position switching)
The purple finger section at the top 96.6K is
The best short position and vertical decline section.
If the orange resistance line is broken, you can operate a self-short based on the stop loss price. (Today is the first 15-minute resistance line touch section)
The probability of the strategy succeeding increases when purple finger short -> purple support line is broken.
The first section at the top is the final short position operation section for today + if it doesn't break through, it's a sideways section.
If it comes down right before the purple finger touches,
the bottom section becomes the long position waiting section.
If you look closely at the sky blue support line, you'll see a gray trend line.
This section is a mid-term upward trend line,
and if it doesn't break out,
the upward trend can continue,
so I set the stop loss price a little loosely.
From the 93.5K deviation shown below,
it touches the Bollinger Band daily chart support line section from the third section,
so a downward trend can be connected, so those who are operating long positions
should be careful.
There may be variables in Nasdaq, so please check the Nasdaq analysis article I left.
I explained it in detail today because the participation rate was high,
but I don't know if you're satisfied.
Up to this point, I ask that you simply use my analysis for reference and use only.
I hope that you operate safely with the principle of trading and cut-off price.
Thank you.

What is option trading and how it can be done profitably ?Options traders can profit by being option buyers or option writers. Options allow for potential profit during volatile times, regardless of which direction the market is moving. This is possible because you can use an options trading platform to trade in anticipation of market appreciation or depreciation
Also called the 1-3-2 butterfly spread, it is a common variation if the butterfly spread involving buying one option at a lower strike, selling three at a middle strike, and buying two at a higher strike. This advanced options trading strategy offers more flexibility.
If you think the stock price will stay stable: sell a call option or sell a put option. If you think the stock price will go down: buy a put option, sell a call option. Frederick says to think of options like an insurance policy: You don't get car insurance hoping that you crash your car.

Next bull leg for BitcoinThe vertical line time zone has been working well for Bitcoin, whenever Bitcoin enters the time cycle zone an upmove is seen. Bitcoin is also currently supported by a moving average hence entering Bitcoin with a small stoploss of the current swing low could set a good trade.

What is the use of ADX in trading and why it is important ?The ADX quantifies trend strength by measuring directional movement over a given time frame. It provides traders with specific numbers (from 0 to 100) that represent strong or weak price trends. Traders can simply refer to the numbers to quickly assess the strength of a trend.
The ADX identifies a strong trend when the ADX is over 25 and a weak trend when the ADX is below 20. Crossovers of the -DI and +DI lines can be used to generate trade signals. For example, if the +DI line crosses above the -DI line and the ADX is above 20, or ideally above 25, then that is a potential signal to buy.
The ADX Indicator actually works best when combined with other technical indicators. One of the best combinations is with the Relative Strength Index, or RSI. Because the ADX measures the intensity of the trend the RSI can help with entries and exits by giving a time based component to the trend

What is database trading and it is been done ?Reset restore all settings to the default values Done. Close Modal Dialog. End of dialog window. 3. Database trading, often referred to as *algorithmic trading* or *quantitative trading*, involves using computer algorithms to make automated trading decisions based on a large amount of data
A database is an electronically stored, systematic collection of data. It can contain any type of data, including words, numbers, images, videos, and files. You can use software called a database management system (DBMS) to store, retrieve, and edit data.
Databases are used to store and manage large amounts of structured and unstructured data, and they can be used to support a wide range of activities, including data storage, data analysis, and data management. They are used in a variety of settings, including business, scientific, and government organizations.

what is support and resistance and how to use it ?The support and resistance (S&R) are specific price points on a chart expected to attract the maximum amount of either buying or selling. The support price is a price at which one can expect more buyers than sellers. Likewise, the resistance price is a price at which one can expect more sellers than buyers.
Using Support and Resistance After a Breakout
Old Resistance Becomes New Support – If the price breaks above resistance, that resistance level may now act as support.
Old Support Becomes New Resistance – If the price breaks below support, that support level may now act as resistance.
Support and resistance are key concepts in technical analysis. They refer to price levels acting as barriers, guiding market direction. These levels help traders make informed decisions on entry/exit points.

adaADA-USDT
Cup and handle model, we expect to enter $0.8100 and enter buy 🟢
the goal
$0.9550
loss loss
$0.7570


How to become a succesfull trader ?Become a successful trader
Risk management
Develop a trading plan
Choose your trading style
Protect your trading capital
Review your trades
Risk only what you can afford
Understand trading psychology
Always use a stop loss
Choose a trading strategy
Comparing brokerage firms
Keep a trading journal
Stay disciplined
Develop trading techniques
Developing a risk reward ratio
Emotional control
Find the right pairs to trade
Find your market
Adapt to the market
Be flexible
Cut losses with limit orders
Gain trading experience
Patience
Set goals
Study the markets

BTC/USD Long Opportunity: Bullish SetupYour long idea on BTC/USD is based on a breakout above the key resistance level of 96,497.07. The entry is positioned around the current market price of 96,148.17, with a stop loss placed at 95,678.49 to manage risk. The take profit target is set at 96,843.00, aiming for a favorable risk-to-reward ratio!
