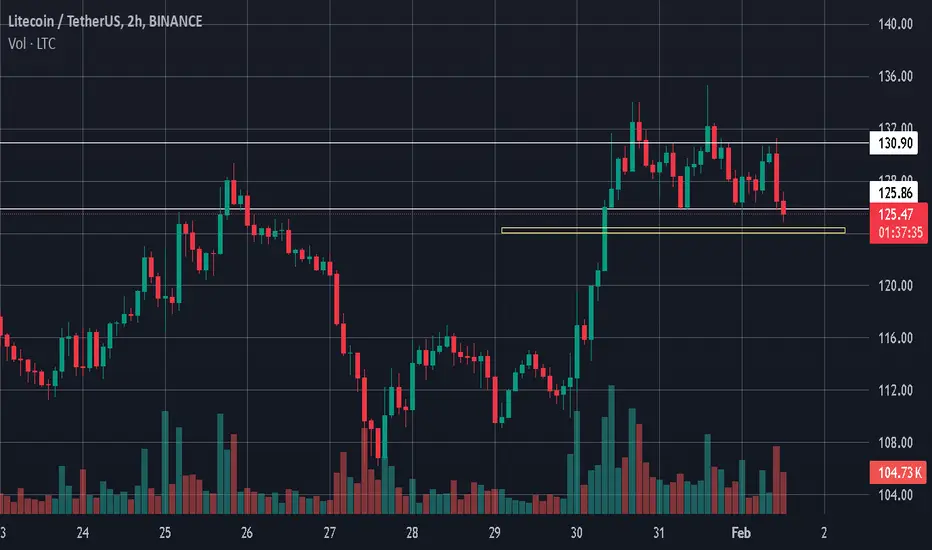
LTCUSDT, TRADE WISELY.Don't go blind for short following this head & shoulder pattern.
Mkt can take support from the level drawn
Crypto market
BTC TRADE IDEA how btc chart works in Coming some time but BTC Bulish in consolidated zone. monday btc revesre in bullish trend

Melania - BuyIn chart there is slight RSI Divergence now indicating Buy side which could push price up in coming days along with BTC trend. In my view melania and trump coins are not completely shit coins since they are in power now so their coins will be used to pay get job done or it could be used in big circles related to us govt and etc etc. so as the new govt complete months and years they will be approving new projects, and these two coins could be used to pay commission etc

Bitcoin (BTC/USDT) Symmetrical Triangle Analysis: Next Move?Bitcoin (BTC/USDT) 4H Chart Analysis
Key Observations:
1. Symmetrical Triangle Pattern:
The chart shows a symmetrical triangle formation, characterized by converging trendlines.
This pattern typically signals a breakout, but the direction (up or down) depends on market momentum.
2. Current Price Action:
BTC is trading around $102,979.98 at the time of the chart.
It is above the 200 EMA ($100,003.64), indicating bullish strength.
The price recently bounced off support and is moving towards resistance.
3. Support and Resistance Levels:
Support: Around $97,785.55 (blue line).
Resistance: Around $109,636.60 (blue line).
4. Potential Scenarios:
Bullish Breakout:
If BTC breaks above the upper trendline, it may rally towards $109,636.60 or higher.
A confirmed breakout could push BTC to $112,500+.
Bearish Breakdown:
If BTC rejects at resistance and breaks downward, it could retest the $100,000 level or lower.
A breakdown could target $97,785.55 or even $95,000.
Final Thoughts:
Watch for a breakout or breakdown from the triangle pattern.
Volume is crucial—a high-volume breakout confirms strength, while low volume can indicate a fakeout.
If BTC stays above $100,000 (200 EMA support), the bullish bias remains intact.

WHAT DOES BITCOIN'S DOMINANCE TELL US?CRYPTOCAP:BTC.D 1D
1. From the point of view of technical analysis, the classic double top has formed
2. From the point of view of volume patterns, the downward movement of dominance will confirm the pattern highlighted by the red arc
EXPECTATIONS: Given the stable inflows into the ETHERIUM of ETF, which is the driver of the altseason and the main factor in reducing dominance, I expect a drop to 56.75% in the next 2-3 months, correction and further drop to 55.2%
(pleasant aroma of the altseason in the air)


MACD Divergence TradingMoving average convergence/divergence (MACD) is a technical indicator to help investors identify entry points for buying or selling. The MACD line is calculated by subtracting the 26-period exponential moving average (EMA) from the 12-period EMA. The signal line is a nine-period EMA of the MACD line.
The indicator is calculated by subtracting a 26-period Exponential Moving Average from the 12-period moving average. There is also a histogram available on the indicator which can also be used as a divergence indicator. As a result, you will then see the MACD line, which shows as an indicator below the price chart.

(Lunar New Year Special) Bitcoin Bybit chart analysis january 24Hello
It's a Bitcoinguide.
If you have a "follower"
You can receive comment notifications on real-time travel routes and major sections.
If my analysis is helpful,
Please would like one booster button at the bottom.
Bitcoin 4-hour chart
This is the main drawing section.
It seems to have taken about 2 and a half hours just to draw it.
The section where the flag is marked is the section where the daily chart is created,
and the last flag is January 31st, when the holiday ends.
This week, there has been absurd and bizarre repetition of
unasked rises and unasked falls.
The reason is that after the report was updated,
as I explained in detail in the last video,
it is right before the bitcoin price skyrockets.
Based on the Bollinger Band weekly chart, it is important to see whether the resistance line is touched first
(a major rise)
and whether the MACD dead cross on the weekly chart
will occur first,
and adjustments and sideways movements will occur.
Based on that, if you look at the high and low points on the right,
I have indicated the prices.
At the very top, 117,182 dollars touches the weekly chart resistance line,
moving towards a mid-term upward trend
If 99,703 dollars at the bottom is broken first,
it will be the place where the weekly candle low is broken.
It would be bad if the two light-colored sky-blue support lines I drew were broken.
Because it is the place where the sideways movement and support line are broken,
I calculated the main section, so
I think it would be good to refer to it.
This is a 30-minute chart of Tether Dominance moving in the opposite direction of the beat.
Today, in terms of the pattern,
it touched the 5-minute and 15-minute resistance lines,
and the 30-minute chart resistance line section order.
I carried out a short position strategy in the sky blue finger section/strong downward section.
In the case of Tether Dominance,
the 6-hour chart and 12-hour chart MACD dead cross are currently in progress.
I applied it to Bitcoin as is.
Here is the Bitcoin 30-minute chart.
There is a Nasdaq indicator announcement at 12 o'clock tonight.
The Nasdaq is in the process of a 6-hour MACD dead cross,
and I judged that this section is not very dangerous.
The short-term pattern is still alive,
and the MACD golden cross is imprinted on the weekly chart,
and even if there is a strong adjustment in Nasdaq,
since the 1+4 rising pattern is waiting,
I focused on the rise and proceeded with the strategy.
*One-way long position strategy when the red finger moves
1. $104,740 long position entry section / stop loss price when the green support line is broken
2. $109,231.5 long position 1st target -> target price in order from the top
Based on the Tether dominance movement and the Bitcoin pattern,
I focused on the rebound from the 30+1 pattern.
Up to the first section, it is a sideways movement, and from the top section, it is a new record, and if it reaches this point, it will continue to rise significantly.
In preparation for a strong adjustment in Nasdaq,
I maintained the stop loss price for the 30-minute support + 1-hour support of the second section, which is marked as the final long position waiting section.
If it touches the bottom section today,
It is not good because the daily chart low is broken.
If it falls to 101.4K at the very bottom,
Pay attention to the 6+12 pattern that was not recovered yesterday.
Basically, if it comes down to this section,
It is not good because the center line of the 12-hour Bollinger Band chart has been touched several times,
and the support line of the 6-hour chart is also open.
Please refer to the final support line explained at the mid-term point at the top.
Today, I explained it in detail for the first time in a while,
and I did my best to analyze a week's worth,
I hope it was helpful for your actual trading.
Up to this point, I ask that you simply use my analysis for reference and use only
and I hope that you operate safely with principle trading and stop loss prices.
Since it's a long holiday,
don't just look at the charts,
and I hope all my followers have a good time with their families next week on Lunar New Year.
Happy New Year.
Thank you always.


Bitcoin buy active from 99300 ,still no sell signal buy dipHow to take trades using Harmonic pattern projection Trade setup is explained below :-
To take Fresh trade : EARLY etry willl be above/ below 13.5% level . Safe traders can enter above or below 27.3% level
Targets :
Target T1 is 27.3% if you are taken entry from 13.5% if taken entry from 27.3 then Target T1: 38.2 % level is our 1st Target
( 38.2% if also a reversal zone so if price reverse then we can make fresh entry also).
T2: 50% level is our 2nd Target
T3: 61.8% to 65 % is our 3rd Target
( This is also reversal zone so we have to book profit at this area and if break then take fresh entry with SL of 2nd Target 50% .)
Next Targets are 78.6 % , 88.9 % 100% , 113.5 % , 127.2% , 141.5% and 161.8% to 165%.
161.8 to 165% if profit booking area so book full profit and wait for reversal.
How to take reversal trade :
If price going upside/ downside then then buy or sell levels appear on Chart ( Automatically show when price reach any reversal zone of harmonic projection pattern based .
After showing reversal levels wait for confirmation until 13.5 % or 27 .6 % level not break if break then exit from current buy / sell trade and take fresh reverse trade buy/ sell .
Trailing SL:
After reach 1st Target trail SL to just above or below cost ( for example we are holding sell trade from 100 1st Target 110 hit then move trailing sl to 104-105 and move SL as price move upside or Downside)
Blue Line is 1st support/ Resistance
Green line is 2nd support/ resistance
Red line is 3rd Support/ resistance

XCN Bullish Hoping to reach a new high. February 3 will tell. Broke out the .025 level and holding strong.

BTC#8: Read BTC price line and trading plan
💎 💎 💎 Did you make a profit in the previous post #7? Like and follow the channel to follow the earliest trading plan. 💎 💎 💎
🔥 Let's plan for the next BINANCE:BTCUSD BINANCE:BTCUSDT 🔥
1️⃣ **Fundamental analysis:**
📊The Federal Reserve keeps interest rates unchanged
🚀Today is the expiration date of BTC futures
📌 US Senator Cynthia Lummis: will hold a public hearing on strategic Bitcoin reserves. This is important information. If BTC is accepted as a reserve asset. The cash flow into BTC will be huge in the near future.
2️⃣ **Technical analysis:**
🔹 **Frame D**: Once again, the price reacted in the 106xxx area. This test gives a weaker price reaction than the previous one.
🔹 **H4 frame**: The price has not surpassed 107xxx so it is not certain that BTC will break the peak.
🔹 **H1 frame**: The short-term price structure is still increasing. It is highly likely that the price will find the support zone below.
3️⃣ **Trading plan:**
⛔The price line has not completely escaped the SW zone, so if you participate in trading in this area, you must stick to the price structure.
✅ In my personal opinion, BTC will likely have another correction before it can break through the old peak. For the time being, we will wait for the price reaction at important support zones.
💪 **Wish you successful trading!**
📌 For any questions, please contact us directly. I am ready to answer you for free

popcat longgood risk to reward ratio ..with small leverage can be one of the best trade for bull market..
#btc #eth #popcat

Has BLACKROCK's PUMP for ONDO begun?BYBIT:ONDOUSDT 1D
1. From January 9 to 29, the coin price was in a narrow range of re-accumulation, as evidenced by the pattern on the OBV chart marked with a purple rectangle.
2. A similar re-accumulation can be seen on the holy chart in the purple rectangle.
3. The volume engulfing sales pattern marked with a red arc was a good entry point for longs with targets at the top of the range.
EXPECTATIONS :
1. The price moves beyond the upper range to the liquidity area at 1.91 and a false breakout and subsequent correction (during which you can look for an entry point for a short-term long)
2. Smooth further movement with a renewal of historical highs in the next 2-3 months

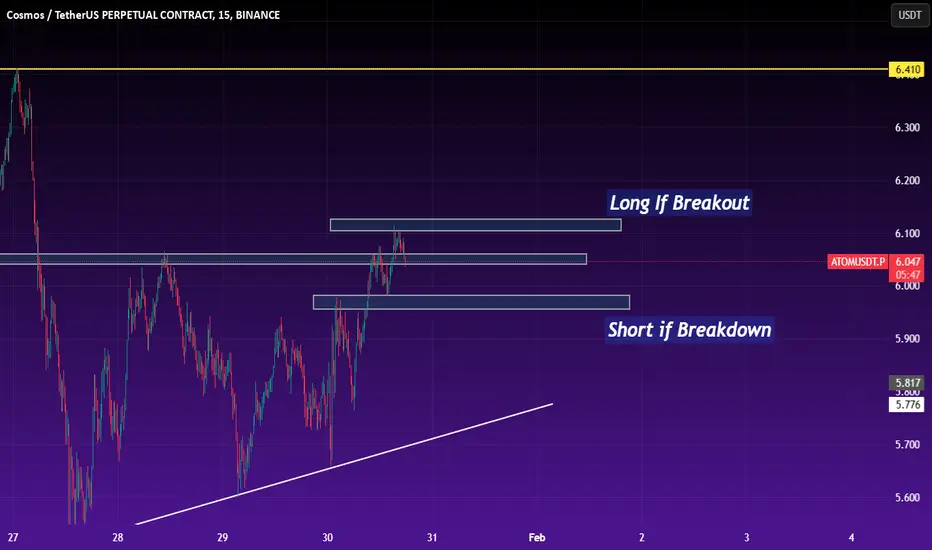
ATOM Spot & Swing Trade SetupI have created two zone
One Long & One Short
If Price breaks one of the zone, It will go accordingly Up/Down.
So you can follow these zones for big profit.
Breakout soon in ETH?Descending Triangle Breakout Setup
Bounce from strong support
RSI reversal in daily chart
Enter after confirmation
Disc: for study only, not a recommendation

BTCUSD 15 MIN ANALYSIS As we can see BTCUSD is trading in sideways in 15 min tf recently it gives break down breaking the downside range here according to my analysis short position is better with more than 1:2 RR set up. This is my own analysis I reserve the right to be wrong. This is just for education purpose only.

Trx offering good opportunity to grab.Tron chart showing clear breakdown in 4hr candle and have a 10% upside potential.

SOLUSD ANALYSISSolana (SOL/USD) is in a consolidation phase within a range on the H4 timeframe, repeatedly taking support from its 200 EMA. This suggests a potential breakout scenario. 🚀
Possible Trade Setups:
Breakout Above the Box (Bullish Scenario)
If SOL/USD breaks the resistance of the consolidation range with strong volume, it could trigger an upward momentum.
Targets: Measure the height of the box and project it upwards.
Confirmation: Look for a candle close above the range + increased volume.
Breakdown Below the Box (Bearish Scenario)
If SOL/USD breaks below the support of the box and the 200 EMA, it may lead to strong downward movement.
Targets: Similar to the bullish scenario, measure the box’s height and project it downward.
Confirmation: A candle close below the range with strong volume.
Key Things to Watch:
✅ Volume increase on breakout.
✅ Retest of the breakout level (flip of support/resistance).
✅ Market sentiment and BTC movement (as SOL is correlated).

bitcoin morning tradethis is a morning trade of bitcoin has anyone taken this morning trade if not then join us and see our analysis whether it is profitable or loss making #clean and #clear #analysis #bitcoin #forexgold #banknifty
follow form more

ETHUSDT next move programmed on 5th Feb 2025
ETHUSDT on higher time frames has completed Wave 2 pull back. I am looking at 5th Feb 2025 has final reversal to next Gann Fann Levels.
If this is true then we will be in 3rd wave (internal) that will be very fast and towards 4100 and higher.

BTC ew updateBTC USD completed THE WXY PATTERN, and now forming a pattern with 5 wave upside on first leg, which opens up more than one opportunity, like ABC- zigzag, LD first wave 1-3 have formed under this, it can be LD as well, it can 1-1-1 ew combination as well, it will interesting to see what folds out.
Now the sturcture based on counts looks like DIANGONAL
1- LD- first wave complete,third is also complete, 1st wave is long, 3rd wave is less than 161,
4th is done and 5th is going,
Structurewise it fits in LD, it has not broken any trendlines.
Fib wise it also fits in this criteria and 5th wave is also reached 61.8 which complete another criteria.
3- 1-2,1-2,1-2 sequence of bullish pattern can also be possible, first sequence is done, 2nd is also done, 3rd impulse in underway.
structure looks ok
lines looks ok
fibs looks ok.
Lets see how it turnsout.

A wise person will stop CRYPTO Soon after the oath of the so good person Mr Trump...crypto has gone out of control. Stay away from CRYPTO. Not only every person,every institution but even every country. Stay away. It is a scam. Save ur money. Listen to me. These bastards playing unfairly will be taken down someday,but till then stay away and use ur money for u
