Crypto market

Btc dominance Btc dominance showing Abcd pattern if btc dominance down Alt session start so keep on eyes chart

Bitcoin Bearish View Bitcoin Going On Trend HL LH
If Break 92000 Level Its Going Down Somthing 88000

4 hr support4hr support... So... Wait conform one candle in postive... Than buy sl set. Happy trade.

Bitcoin ready for fall 85900-85700 , if break 85000 then 78800 Bitcoin sell given near 97000 , 86000 and 78900 will come in upcoming days
Bitcoin ready for fall 85900-85700 , if break 85000 then 78800 will come
Disclaimer -
This information is only for educational purposes, this is not for any buy or sell recommendations .
On Our Harmonic pattern indicator
based trade setup take trade as explained below :-
ENTRY -
When price breaks Trailing SL (SL 27.2 % )retracement Which is SL points then take Entry on Buy or Sell Trade
SL -
D points Which is recent High / Low mentioned in Chart is our SL
TARGET -
Target 1- (T1 : 38.2)
Target 2- (T2 : 50 %)
Target 3- (T3 : 61.8%)
Target 4- (T4 : 78.6%)
Please note:-
It's working on news based and volitile market very well so exit if SL hit

TON/USDT Bullish Breakout Alert – Could $TON Hit $50?🔥 TON/USDT Bullish Breakout Alert – Could CRYPTOCAP:TON Hit $50?
CRYPTOCAP:TON is heating up! A bull flag pattern is forming on the HTF, and all signs point to a potential massive breakout. If you're looking for your next big trade, this could be it!
Here's the must-know breakdown:
Top Levels to Watch:
🔹Buy Zone: $5.50–$4 (perfect accumulation area in the bull market)
🔹 Critical Support: $4 (below this, it’s bearish territory)
🔹 Breakout Point: $7 (above this, expect fireworks 🚀).
Pro Insights:
🔹 Watch for a quick wick below $4—it might be a golden entry opportunity.
🔹 A confirmed breakout above $7 could kickstart a rally toward $50, making it a long-term gem.
Why It Matters:
🔹 CRYPTOCAP:TON ’s weekly structure is screaming bullish potential! Don’t miss this opportunity to ride the wave.
🛑 Disclaimer: This is not financial advice. Always do your research and avoid following any influencer blindly. Stay informed and manage risk like a pro.
Tag & Share: Think CRYPTOCAP:TON will hit $50? Share your thoughts!
Let’s make this post viral—like the bull run we’re waiting for!

A support strong for bitcoinBitcoin is testing the support many times. if it sustains big movement for long

bitcoin is Chart Analysis:
There’s a descending triangle pattern forming at the current price level, indicated by a flat support zone (horizontal purple line) and a descending resistance (diagonal purple line).
The price action is consolidating within this range, which is often a bearish signal for continuation in a downtrend.
Support and Resistance:
Resistance levels:
Around ₹95,300–₹95,500 (upper purple trendline or shaded red zone).
Support levels:
Around ₹94,400 (flat purple line below).
Indicators:
Supertrend:
Red zones suggest the current trend is bearish.
EMA (Exponential Moving Average):
The price is hovering below the EMA, reinforcing a potential bearish sentiment.
Bearish Rejection:
Multiple candles show rejection from the resistance zone, which strengthens the likelihood of a downside breakout.
Expectations:
If the price breaks the horizontal support line around ₹94,400, further downside movement can occur.
The next possible support after a breakdown might be around ₹93,300–₹93,500, as visible on earlier price action.
Caution:
Consolidation in a tight range could also lead to a fake-out (a false breakout in either direction), so waiting for confirmation is critical.
Monitor volumes; a breakdown with high volume increases the probability of a genuine move.

BTCUSD SHOWING A GOOD DOWN MOVE WITH 1:7 RISK REWARDBTCUSD SHOWING A GOOD DOWN MOVE WITH 1:7 RISK REWARD
DUE TO THESE REASON
A. its following a rectangle pattern that stocked the market
which preventing the market to move any one direction now it trying to break the strong resistant lable
B. after the break of this rectangle it will boost the market potential for break
C. also its resisting from a strong neckline the neckline also got weeker ald the price is ready to break in the outer region
all of these reason are indicating the same thing its ready for breakout BREAKOUT trading are follws good risk reward
please dont use more than one percentage of your capitalfollow risk reward and tradeing rules
that will help you to to become a bettertrader
thank you

ETH pullback before next bull runEth is building a new bullish pattern for logn run and consolidating in the biggest pattern

BTC is accumulating momentum, how should long and short position
BTC has recently fallen from a high level. The price turned and fell from the high point of 108340 to 92542 to stop falling and adjust. So far, BTC has entered a short-term decline.
The price on the hourly line rebounded to the support of 92542 and rose. The price failed to hit the integer of 100,000 for the second time, forming a double top decline structure. The current trend fell back to 93500 and entered a narrow horizontal consolidation stage. The resistance of 96000 above is under pressure. If this position breaks, the hourly line descending channel will be broken. In the short term, the price will test the 100000 line above. The support of 93500 below, if this position breaks, the short-term rebound trend will end and test the 92542 line below.
On the whole, BTC entered the accumulation stage after the short-term double top fell. In terms of trend, the price also reached the top of the hourly channel. However, there are many resistance levels above. Even if the downward channel is broken later, the trend will enter the horizontal range structure. But if the trend breaks down, there is more room for the price to continue to fall.
In terms of operation, I personally think that BTC will continue to rebound and short before the channel breaks up.
Long orders will be involved after the price breaks through the 100,000 line.

Bitcoin Analysis Yesterday, we didn’t get a clear breakout and the market remains stuck between two level like forming red green pattern.
This chart shows the Bitcoin-to-USD (BTC/USD) price action, likely on the 1-hour timeframe, with indications of a potential bearish movement. Here’s a quick analysis based on the provided image:
Key Observations:
1. Current Price: The price is around $94,921, showing a slight decline (-0.23%).
2. Ascending Channel: The chart indicates a rising channel (black trendlines) that is nearing its upper boundary, suggesting potential exhaustion of the upward momentum.
3. Resistance Zone: A purple rectangle marks a resistance area where the price has struggled to break through.
4. Bearish Rejection and Projection:
• The price appears to be consolidating near the upper trendline but lacks strong bullish momentum.
• An arrow indicates a potential breakdown from the channel, aiming toward lower levels around $93,000.
5. CCI Indicator:
• The Commodity Channel Index (CCI) shows a decline from overbought territory (above 100), indicating bearish momentum could be building.
Potential Scenario:
• Bearish Breakdown: If the price breaks below the ascending channel, it could test the $93,000 level or even lower to the $92,000 support zone.
• Invalidation: If the price breaks above the resistance zone and holds, the bearish outlook would be invalidated, leading to further upward movement.
Trading Suggestion:
(Don’t follow me blindly as I am not a certified trader)
• Consider short positions if the price breaks below the channel and confirms with volume or candlestick patterns.
• Monitor support zones near $93,000 and $92,000 for potential profit-taking or reversal signals.
• Place a stop-loss above the resistance zone to manage risk.

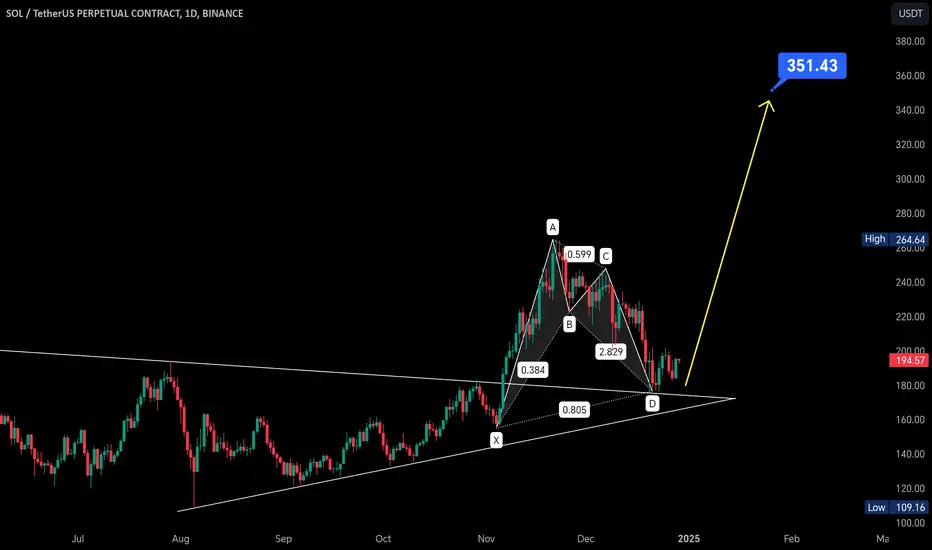
$SOL Price Analysis: $350 and $400 Targets in SightSolana has clearly retested the previous symmetrical triangle and has now formed a bullish Shark pattern. Additionally, it is consistently forming higher lows on the daily chart. The RSI has also bounced back from the oversold region, further supporting a bullish outlook. All these indicators suggest that Solana is poised for a strong upward movement. My price targets for this potential rally are $350 and $400.
LUCID TRAFFIC SIGNALThe "LUCID TRAFFIC SIGNAL" indicator is designed to provide a clear visual representation of market trends and potential price zones. By analyzing multiple timeframes, it highlights significant levels that can guide traders in identifying bullish, bearish, and neutral market conditions. The indicator uses color-coded lines to mark key price levels for different timeframes, helping traders make more informed decisions with ease.
This tool is ideal for those who want a straightforward, visually appealing way to monitor market dynamics and align their strategies with prevailing trends. Whether you're a day trader or a long-term investor, the "LUCID TRAFFIC SIGNAL" ensures you're equipped to navigate the markets confidently.

since now USDT is not compliant, lets go with BTC/USDC"All past movements" means that the last bullish or bearish trends are over, from 2020 till the past November run-up.
The price must be retraced before reaching the new targets, and the liquidity left behind must be recovered. There are too many signs to suggest selling rather than buying. Any bullish movement won't be strong enough to bring the price over the last ATH and create a new BOS, which would be significant for the long position analysis.
From a fundamental perspective, the new taxes and norms in action this 31st December led the small investors to wait for the end of the year before investing. The Institutional investors, on the other hand, will wait for the price to drop before buying, and at this point, they will also wait for the year's closure to purchase new coins since the balances must be generally closed by that time.
This is the fact, as a 5-year trader, the BCT volatility index is getting closer to the normal % every month.
Thus, the price must follow a few new rules.
We are still waiting for the big bullish shot post-halving, which has not arrived yet, even if the 100K were a high psychological winning, the rally is not over yet.
There are millions of liquidations waiting for around 93K. If the price goes around 91K, it is more likely to drop rapidly to 81K-78K.
Will it drop? If we're lucky, yes. Just enough to create a correction, probably a new pennant as chart shape and price action pattern
So, it's better to have solid growth with slower growth. In the past time, we have seen even more range situations where the price was somehow consolidating itself (a bit for the institutional action, a bit for fundamental reasons). We don't need to care about why but about what we are doing. The volatility and rapid response that BTC gave are now over. We have a more solid asset that is not a pure speculative coin as before, but it has created a new market and economic system.
124000$ new target
81000$ strong support and liquidation spot
78500$ significant for technical analysis but now actually relevant to the liquid one
71000$ last retracement level and resistance
If we reach 71K, the bullish will be sharp. The drawdown will create a good buying situation and will lead to higher volumes and capital to reach the next target.

Bitcoin: Massive Breakout Loading – ATH Incoming!🚀 Bitcoin is heating up, and all signs point to a massive breakout on the horizon. With the market coiling tightly, BTC could be gearing up for its next all-time high (ATH) run.
🔍 Why BTC is Set to Explode:
• Strong accumulation at current levels = Big players loading up
• Momentum building as resistance zones weaken
• Historical patterns: Major consolidations often lead to ATH rallies
💡 The Big Question:
Will BTC shatter the ceiling and rewrite history with a new ATH? It’s looking unstoppable—are you ready for the ride? 🚀
What’s your target? Drop your thoughts below!

Price Action Analysis for BTCUSDT - 15-Minute ChartShort-Term Consolidation with Bearish Bias.
Observations:
Moving Averages:
Price is trading below the 200-period SMA (red line), indicating bearish dominance.
Hovering near the 50-period SMA (green line), suggesting short-term support around $94,677.93.
RSI (14):
RSI at 58.95, approaching overbought territory but not extreme, signaling potential short-term resistance.
Volume:
Recent volume spikes indicate active trading interest but lack follow-through, suggesting uncertainty.
Pattern:
Slight ascending triangle formation with resistance near $95,200 and support near $94,400.
Signal:
Buy Range: $94,500–$95,000 (on breakout above resistance).
Target: $95,800–$96,200.
Stop Loss: $94,200 (below trendline support).
Risk Management:
Risk-to-Reward Ratio: Maintain 1:2 or better.
Volume Confirmation: Look for a breakout candle with increased volume above $95,200 for validation.

Daily Chart (1D) Analysis Trend: Bullish but weakening momentum.Observations:
Price is above the 200-period SMA (green line), indicating long-term bullishness.
Recently tested the 50-period SMA (red line) as support but is hovering near it.
RSI: Neutral zone (45–53), indicating no strong momentum in either direction.
Signal:
Buy range: $93,000–$94,500
Target: $99,000–$102,000
Stop Loss: $91,000

BitcoinHi friends, Its a channel formation. Closing below 93500 will take it to 92000 and below. Closing above 95500 can take it 98000 level. Happy Trading,

$BTC Price Forecast: $75K, $85K, or $108K?Currently, I see three potential scenarios for BTC:
1. BTC is forming lower highs and may retest the previous resistance around the $108,000 level. After that, it could pull back to the $100,000 area before making a new all-time high.
2. BTC might retest the $90,000 level and then move upward. Alternatively, if it loses support at $90,000, it could drop to $85,000 before starting an upward trend.
3. In a worst-case scenario, BTC could undergo a significant correction, dropping as low as $75,000.

ETH will significantly outperform BTC through 2025ETH/BTC is at a crucial inflection point and may be about to reverse, giving ETH an opportunity to outperform BTC significantly from now through end 2025.
Points to support this argument from the weekly ETH/BTC Chart:
1. Support line since Jan 2020 is being tested (pink). If this holds, a bounce and reversal is possible
2. The impulse wave that started in Jan 2020 topped in December 2021 (orange 1 on chart) and has been in a correction Wave 2 since then. This Wave 2 has been a clean ABC correction (end points labeled in blue).
3. The Wave 2 pullback is currently between the 0.618 and 0.786 Fib level and this may be a confluence with the Support Line since Jan 2020 (see point 1), offering a confirmation of a reversal
4. It is way below the 200 DMA (yellow line) and the 200 WMA (orange line) and reversion to mean may be next
Taken together, these build a solid case for a reversal of the ETH/BTC trend. If this reversal occurs, completing Wave 3 means ETH will significantly outperform BTC through end of 2025. Only if this pink support line since Jan 2020 is converted to support first. Interesting times.

I just spot bough 100% SOLBanana Zone commence?
Interest rates will lower next year.
I just could not be in stables right now. It just did not seem right.
I don't have the time to be day trading, although I have recognized set ups that I may take the time to trade during trending days. Pullbacks end with small bodied candles which provide tight SL scalp opportunities. Impulsive days may have 3 or 4 pullbacks and breakout setups before the price action does wide shakeout, double bottom patterns. Solana in the intraday also tends to end trends with diagonals, up or down. Break out and retests are very common especially at the beginning of trends. I have noticed I also tend to have a bearish bias at all times, and my eyes have been trained more for bearish setups. The bullish retests tend to be more volatile, I have noticed.
Perhaps I will spot sell at a future date. In a couple weeks even. I do not expect the next month to see parabolic action. I anticipate consolidation, but that is my bearish mindset talking. I am not bullish enough?
The boxes set context to the chart. Its a copy paste of the current pullback.

Bitcoin analysisWait for a breakout confirmation. Then, we might see a retest after that the market may fall to the level suggested in last post.
Check it out now!
