Commodity Currencies (AUD, CAD, NZD)Commodity Currencies Overview
Commodity currencies are national currencies of countries that rely heavily on the export of natural resources or commodities. These currencies are sensitive to global commodity prices because their economies are closely tied to the demand and supply of commodities such as metals, energy products, and agricultural goods. Among the most prominent commodity currencies in the world are the Australian Dollar (AUD), Canadian Dollar (CAD), and New Zealand Dollar (NZD). Each of these currencies reflects the underlying economic health and export performance of their respective nations.
1. Australian Dollar (AUD)
Economic Background:
Australia is rich in natural resources, including iron ore, coal, natural gas, and gold. The Australian economy is heavily reliant on the export of these commodities, particularly to Asian markets like China, Japan, and South Korea. Roughly 60–70% of Australia’s total exports are commodities, making the AUD highly sensitive to global commodity prices.
Relationship with Commodity Prices:
Iron Ore: Australia is the world’s largest exporter of iron ore, and changes in iron ore prices strongly affect the AUD. Rising demand from industrial powerhouses like China often strengthens the AUD.
Coal and Natural Gas: Australia is a leading exporter of thermal and metallurgical coal, as well as liquefied natural gas (LNG). Increases in global energy prices often lead to appreciation of the AUD.
Monetary Policy and Interest Rates:
The Reserve Bank of Australia (RBA) plays a critical role in influencing AUD value. Historically, the AUD has been considered a “high-yielding” currency because Australia has often maintained interest rates above other developed nations. Traders often engage in carry trades using the AUD, borrowing in low-interest currencies like JPY to invest in AUD for higher returns.
Trading Characteristics:
The AUD is highly liquid and traded against major currencies such as USD (AUD/USD), JPY (AUD/JPY), and EUR (AUD/EUR).
It is often considered a risk-on currency, meaning it appreciates when global risk sentiment is positive and depreciates in risk-off scenarios.
Market Influences:
Global Growth: Strong global economic activity increases demand for Australian exports, supporting AUD.
China’s Economy: Since China is Australia’s largest trading partner, Chinese GDP growth, industrial production, and infrastructure spending heavily influence AUD movements.
Commodity Prices: Fluctuations in iron ore, coal, and gold prices can trigger significant AUD volatility.
2. Canadian Dollar (CAD)
Economic Background:
Canada’s economy is resource-rich, with significant production of crude oil, natural gas, lumber, and metals. Oil exports, in particular, dominate Canada’s trade, making the CAD closely correlated with crude oil prices. Canada is one of the top global producers of crude oil, mainly from Alberta’s oil sands.
Relationship with Commodity Prices:
Oil: Approximately 40% of Canada’s total exports are energy products. The CAD is often referred to as a “petro-currency” because oil price movements have a direct effect on its value. Rising oil prices strengthen the CAD, while falling prices weaken it.
Natural Resources: Lumber, natural gas, and metals also contribute to CAD volatility, though oil remains the dominant factor.
Monetary Policy and Interest Rates:
The Bank of Canada (BoC) manages the nation’s monetary policy, influencing CAD through interest rate decisions. Similar to the AUD, the CAD has historically offered relatively higher interest rates compared to some developed economies, making it attractive for carry trades.
Trading Characteristics:
The CAD is highly liquid and traded against the USD (USD/CAD), EUR, and JPY.
USD/CAD is particularly sensitive to both oil price fluctuations and U.S. economic performance, as the U.S. is Canada’s largest trading partner.
CAD also responds to global risk sentiment but less strongly than the AUD, given its more defensive economic ties to energy markets.
Market Influences:
Oil Prices: A surge in crude oil prices tends to boost the CAD, as higher energy revenues improve Canada’s trade balance.
Global Risk Appetite: Risk-on environments moderately strengthen CAD, while risk-off events may weaken it.
U.S. Economy: Given the close trade relationship, strong U.S. growth can positively affect CAD.
3. New Zealand Dollar (NZD)
Economic Background:
New Zealand’s economy is smaller than Australia’s and Canada’s but highly dependent on commodity exports. Agricultural products—such as dairy, meat, wool, and fruit—form the backbone of its export sector. Approximately 50–60% of New Zealand’s exports are commodities, making the NZD sensitive to global agricultural demand.
Relationship with Commodity Prices:
Dairy Prices: Dairy products are the largest export category, especially to Asian markets. Global milk and dairy prices influence NZD significantly.
Meat and Forestry Products: Meat and wood product exports also impact the currency, though to a lesser degree than dairy.
Monetary Policy and Interest Rates:
The Reserve Bank of New Zealand (RBNZ) regulates interest rates, which historically have been relatively high compared to other developed nations. This has made the NZD a preferred currency for carry trades.
Trading Characteristics:
The NZD is traded primarily against the USD (NZD/USD), AUD (NZD/AUD), and JPY (NZD/JPY).
It behaves as a risk-on currency, often moving in tandem with global investor sentiment.
The NZD has high volatility relative to other major currencies, reflecting its dependence on agricultural commodity markets.
Market Influences:
Global Dairy Demand: Changes in Chinese and Asian demand for dairy exports strongly influence the NZD.
Commodity Prices: Milk, meat, and forestry prices can drive short-term NZD fluctuations.
Risk Sentiment: Like the AUD, NZD tends to appreciate during periods of global economic optimism.
Shared Characteristics of Commodity Currencies
Commodity Correlation:
All three currencies are closely linked to global commodity markets. AUD is linked to metals and energy, CAD to crude oil, and NZD to agricultural products.
Risk Sensitivity:
They are considered risk-on currencies, appreciating when global markets are bullish and depreciating during risk-off periods.
Interest Rate Differentials:
These currencies often offer higher interest rates relative to low-yielding currencies such as JPY or CHF, making them attractive in carry trades.
Export Dependency:
Their economies are export-driven, and changes in demand from major trading partners directly affect currency value.
Volatility:
Commodity currencies exhibit higher volatility than non-commodity currencies because commodity prices themselves are highly volatile, influenced by global supply-demand shifts, geopolitical events, and economic cycles.
Trading Strategies for Commodity Currencies
Commodity-Based Trading:
Traders often correlate currency movements with relevant commodity prices. For instance, rising oil prices could signal CAD strength.
Risk Sentiment Trading:
Since AUD and NZD are risk-on currencies, traders monitor global market risk appetite to anticipate currency moves.
Interest Rate and Carry Trades:
These currencies are favored in carry trades where investors borrow low-yielding currencies like JPY to invest in higher-yielding currencies such as AUD or NZD.
Fundamental Analysis:
Monitoring trade balances, GDP growth, and economic data releases from Australia, Canada, and New Zealand is essential for predicting currency strength.
Technical Analysis:
Due to their volatility, technical indicators like moving averages, support/resistance levels, and trend analysis are widely used in short- and medium-term trading.
Conclusion
The AUD, CAD, and NZD are quintessential examples of commodity currencies, with their values intrinsically tied to the performance of key export commodities and global economic trends. While the AUD and NZD are sensitive to metals, energy, and agricultural products and exhibit risk-on behavior, the CAD is strongly influenced by crude oil prices and trade relations with the U.S.
Investors and traders closely monitor commodity price movements, global economic growth, and central bank policies when trading these currencies. Their higher interest rates and sensitivity to risk sentiment make them attractive in both fundamental and technical trading strategies, but also inherently more volatile than non-commodity currencies like the USD or EUR.
Understanding these dynamics is crucial for anyone looking to trade, hedge, or invest in commodity currencies, as their fortunes rise and fall with the ebb and flow of global commodities and investor sentiment.
Crypto market
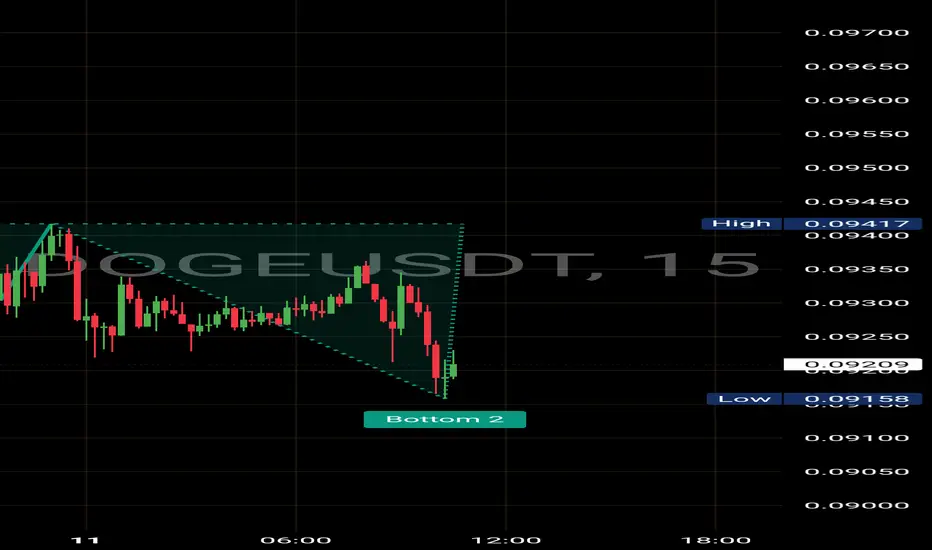
$DOGE on the 15mins chart is shaping a potential double bottom CRYPTOCAP:DOGE on the 15mins chart is shaping a potential double bottom around 0.0915–0.0920. After a steady intraday downtrend, price swept the prior low (Bottom 1) and printed a similar reaction at Bottom 2. That tells us buyers are at least attempting to defend this zone.
Momentum is still cautious. The structure inside the highlighted range shows lower highs, meaning bulls need confirmation — not anticipation. A reclaim of the 0.0940 intraday resistance would shift short-term pressure and open the door for a squeeze back toward the top of the range.
If support fails cleanly below 0.0915, the breakdown could accelerate toward the 0.0900 liquidity pocket, where stops likely sit.
Support: 0.0915 / 0.0900
Resistance: 0.0940
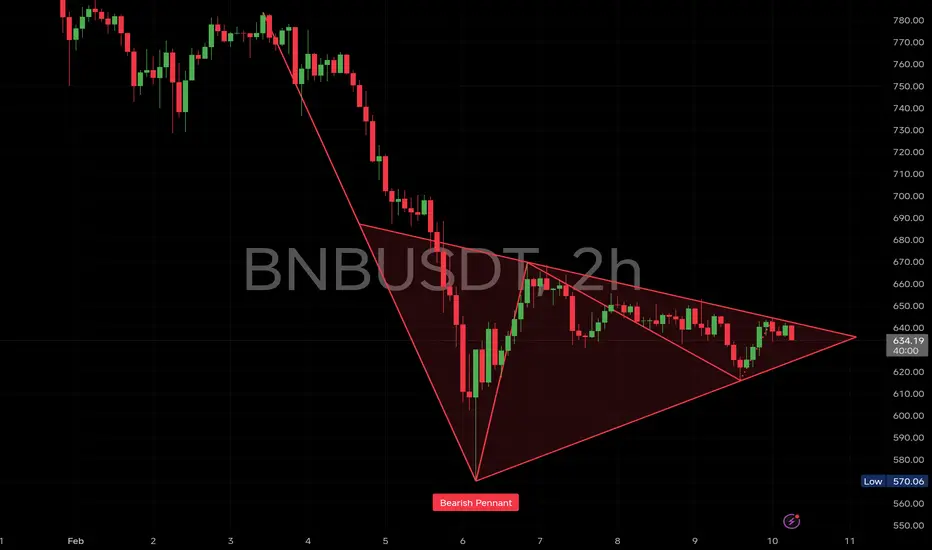
$BNB has officially broken down from the bearish pennant CRYPTOCAP:BNB has officially broken down from the bearish pennant — and price has now tapped the first downside objective.
As discussed, this structure was a continuation pattern, not a reversal. The impulsive leg from ~760 → 580 formed the flagpole, and the compression inside 660–630 built the pennant.
Once price lost 630–625 support with acceptance, acceleration kicked in — exactly as expected.
Now we’re sitting inside the first liquidity pocket (610–600).
If this zone fails to hold, next downside levels remain:
➡️ 585–570 (previous swing low zone)
➡️ 540–520 (full measured move of pennant)
Only a strong reclaim above 660–670 would invalidate this bearish structure.

$ZRO Dropped 84% But What's Coming Next Could Shock Everyone CSE:ZRO Dropped 84% But What's Coming Next Could Shock Everyone 🚀
#ZRO Has Corrected ~84% Inside A Multi-Month Descending Channel Since 2024, Now Testing The HTF Breakout Level.
Price Is Compressing At Channel Resistance With Strong Accumulation Around $1.50–$1.20 👇
✅ Strong HTF Demand: $1.50–$1.20
✅ Breakout Trigger: HTF Close Above Channel $2.50
✅ Structure Turns Bullish On Acceptance Above $2.50
✅ Possible Retracement Before Next Expansion Leg
✅ $1.80 = Good Entry Level 1 If Price Pulls Back
✅ $1.50–$1.20 = Major Accumulation Zone (Best Long-Term Entry)
⚠️ Close Below $1.20 = HTF Structure Weakens
Upside Targets If Breakout Confirms: $6.83 ➔ $13.00 ➔ $25.00 (Full Measured Move ~1,500%+)
Why I’m Bullish Long Term On CSE:ZRO 👇
→ Tether Made A Strategic Investment In LayerZero Labs
→ USDT0 Has Processed $70B+ In Cross-Chain Volume
→ Backed By Citadel, Ark Invest, Google Cloud & DTCC
→ Infrastructure Layer For Cross-Chain Finance + AI Economy
→ Price Already Reacted +35% On Institutional News
HTF Compression + Real Adoption + Institutional Backing = Asymmetric Setup.
Pure TA + Narrative Confluence | Not Financial Advice | Always Do Your Own Research
What's Your Target For CSE:ZRO ? Let Me Know 👇
Like + Share if You Found This Useful!

BE READY!! ETH FALL. If ETH breaks down 1996-1992 support level with a strong red candle. It will give a strong selling.

ETHUSD: Potential Major Bottom Around $1600 | Time Window 16–21 Market View:
ETH is currently in a deep corrective structure after a sharp sell-off. Price is approaching a key demand zone near $1600, which aligns with historical liquidity and previous reaction areas.
Why it matters:
Strong structural support around $1600
Oversold price behavior after extended down move
Time-based alignment suggesting exhaustion of selling pressure
Time Expectation:
I expect a potential bottom formation between 16–21 February 2026, followed by a relief bounce or consolidation base.
Trading plan (optional line):
Look for confirmation via lower timeframe structure or bullish reversal signals before committing to longs.

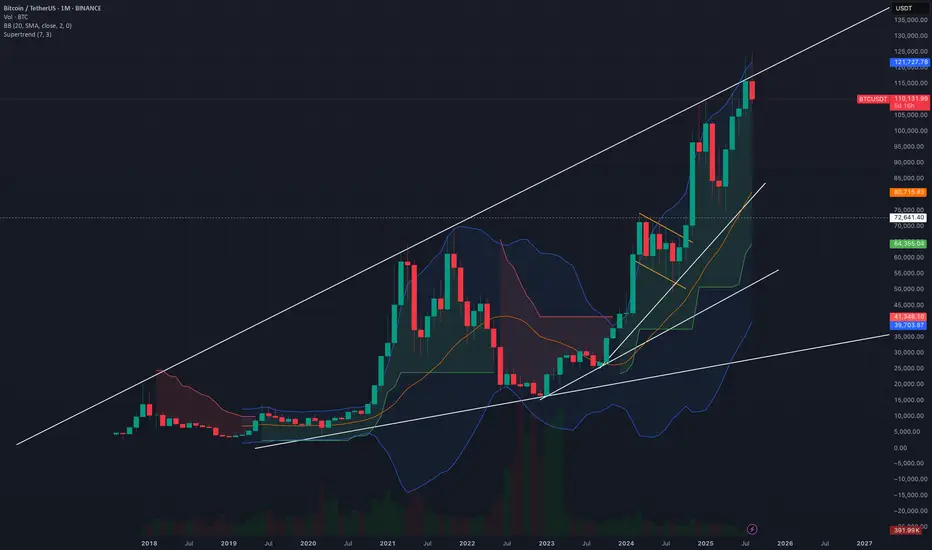
BitCoin? a bit down or big downBitcoin is loosing it fizz now and rally may be about to end.
as per chart reading i can see that it is on the resistance levels
and as now world economies are also settling it should be possible that crypto frenzy get no hype and for that Bitcoin may see a down pludge
Possibly for next 2-2.5 Years Bitcoin won't cross the recent highs and may be retesting 72K level or more downside.
Up move will only continue after breaking and closing above this trendline.
Will $ONDO Potential to hit $5?#ONDO Has Been In A Brutal ~90% Drawdown From Its ATH ($2.15) Over The Last 14 Months But This Is Where Generational Entries Are Made.
Price Is Sitting At A HTF Fibonacci Demand Zone With Strong Accumulation Structure Forming 👇
✅ ATH: $2.15 (14 Months Ago) & Current ~90% From ATH
✅ Price Sitting Inside Strong Bullish OB: $0.19–$0.24
✅ Deeper Demand / 0 Fib Retracement: $0.171
✅ HTF Market Structure Valid Above $0.170
✅ Turn Fully Bullish Above $0.47 (Structure Flip Zone)
✅ Classic Wyckoff Accumulation Phase In Play
⚠️ Breakdown Below $0.171 = Final Support Invalidated
Upside Targets (If Structure Flips Bullish): $1.00 (5x) ➔ $2.15 (ATH 10x) ➔ $5.00+ Full Cycle Expansion (2500%+)
Pro Positive Point:
Do You Know Trump’s World Liberty Financial (WLFI) Bought LSE:ONDO At $1.374 And You’re Getting It Around $0.20, Which Is ~85% Down From Trump’s Entry.
WLFI Holdings: $470,000 Invested For ~342,000 ONDO Tokens.
Thesis:
RWA Narrative Leader Trading At A High-Confluence Demand Zone – Fibonacci + Bullish OB + HTF Support All Stacking.
If Structure Flips Above $0.47, This Sets Up For A Multi-Leg Parabolic Move.
IMO: LSE:ONDO Is Currently On Sale With A ~90% Discount.
TA Only | NFA | Always DYOR
💬 Your LSE:ONDO Target? 👇
❤️ Like + RT + Bookmark

BTC 1H🧠 Market Context
Bitcoin has just completed a liquidity sweep after an extended move, tapping into a high-timeframe supply/demand reaction zone. Price action is currently compressing, signaling that we’re approaching a decision point where momentum traders and HTF participants collide.
The recent impulse leg shows aggressive positioning, but follow-through volume is starting to fade — typically a precursor to either consolidation or a sharp expansion move.
🔑 Key Levels To Watch
Major Resistance / Supply: Previous breakdown region + liquidity cluster
Mid-Range Pivot: Intraday structure flip area
Primary Support: Demand zone aligned with prior consolidation base
Invalidation Level: Clean break + acceptance beyond HTF structure
These zones are not just horizontal levels — they represent orderflow interest areas where reactions are statistically more likely.
📈 Bullish Scenario
If price holds above the mid-range structure and builds higher lows:
Expect continuation toward equal highs / resting liquidity
Break-and-retest of resistance could trigger expansion
Momentum confirmation: strong candle closes + increasing volume
Bias shifts bullish on structure confirmation, not anticipation.
📉 Bearish Scenario
Failure to reclaim reclaimed structure could signal:
Distribution inside resistance
Sweep-and-reverse pattern
Rotation back into lower demand zones
A clean breakdown below support with acceptance likely opens a fast-move liquidity vacuum.
⚠️ Trading Strategy
Avoid chasing mid-range noise
Let price come into levels
Focus on confirmations:
Structure breaks
Volume expansion
Reaction speed at zones
Remember: Location > Prediction.
🧭 Final Thoughts
Bitcoin is sitting at a high-probability reaction area. The next expansion move will likely come after liquidity is fully engineered around current consolidation.
Stay patient, trade the reaction — not the emotion.


Bitcoin Bybit chart analysis FEBURARY 9Hello
It's a Bitcoin Guide.
If you "follow"
You can receive real-time movement paths and comment notifications on major sections.
If my analysis was helpful,
Please click the booster button at the bottom.
This is a Bitcoin 30-minute chart.
There are no separate Nasdaq indicators.
When the red finger moves,
*This is a one-way long position strategy.
1. $66,268.1 is the entry point for a long position. / Stop-loss price is set when the green support line is broken.
2. $69,531.5 is the first target for a long position.
-> $71,221 is the second target. -> Target prices are set at Top and Good in that order.
Points 1 and 2 in the middle are used to re-enter a long position.
If the price touches 69.5K at the top first,
it could end in a sideways market within the purple support line of point 1. From the breakout of the green support line, the price remains open to a maximum of $61,222.5, so please be cautious.
Up to this point, please use my analysis for reference only.
Please operate safely, following the rules and setting stop-loss orders.
Thank you.

BTCUSDT Technical Analysis (1H Timeframe)BTCUSDT is showing a bearish structure on the 1H timeframe, with price rejecting strongly from the 71,300–71,800 supply zone and forming lower highs. The recent upside move looks corrective, and price is failing to hold above previous demand, signaling weak bullish momentum.
The key area to watch is 68,888. A breakdown below this level confirms continuation to the downside, with liquidity resting below recent lows. The next major demand zone sits between 68,000 and 67,200, aligning with prior reactions and imbalance.
Trade Setup:
Sell below 68,888 | TP1: 68,000 | TP2: 67,222 | SL: 70,222
Bias remains bearish below 70,200; bullish control only above 71,800.
Disclaimer:
This analysis is for educational purposes only and does not constitute financial advice. Cryptocurrency trading involves significant risk, and losses may exceed your investment. Always do your own research and manage risk properly before entering any trade.

BTCUSD ANALYSIS OVER H1 CHARTMonitoring BTCUSD for a potential short-term sell setup as price reacts around key resistance and structure.
Waiting for confirmation to define precise entry, targets, and risk levels.
Looking for a selling opportunity in BTC

Population of Three Major Emerging Markets in 2025🌍 Population Overview of the Emerging Markets
In the global demographic landscape of 2025, the human population is estimated to be around 8.2 billion people. Even with declines in some regions, overall numbers continue to expand due to higher fertility in developing countries and improvements in health and longevity.
Among the most populous nations — especially those considered emerging markets — India, Indonesia, and Brazil stand out for their large populations and their role in shaping future global trends. These three aren’t just big markets; they represent important demographic and economic engines with distinct characteristics and challenges.
🇮🇳 India – World’s Most Populous Country in 2025
Population Size
As of 2025, India is the most populous country on Earth, with a population of approximately 1.46 billion people. That’s nearly 18% of the entire global population in just one nation.
Historically, India’s demographic growth stems from high birth rates in the mid-20th century followed by gradual declines in mortality due to healthcare improvements. However, the pace of population growth has been slowing as fertility rates fall.
Why India’s Population Matters
India’s sheer size gives it massive potential in labor force growth, market demand, and long-term economic output. A large working-age population can be a huge asset — economists call this a demographic dividend — boosting productivity if jobs and education keep pace with demand.
Yet, this large population also creates challenges:
Urbanization pressures: Rapid growth in cities has led to infrastructure stress — housing, transport, water, and sanitation need constant expansion.
Healthcare and education demand: Providing quality services to such a vast population remains a top policy priority.
Falling fertility rates: Interestingly, India’s fertility rate has dropped below the replacement level in some regions, which could eventually slow total population growth and reshape future age structures.
Despite slowing fertility, India’s population will continue to increase into the next few decades before stabilizing or slowly declining in the very long term — a pattern seen in many countries undergoing demographic transition.
🇮🇩 Indonesia – Southeast Asia’s Giant
Population Size
Indonesia is the fourth-most populous country in the world in 2025, with around 285–286 million people.
As an archipelagic nation spanning thousands of islands, Indonesia’s population is distributed unevenly — Java, for example, is one of the densest populated places on the planet, while eastern provinces are much less crowded.
Growth Trends
Indonesia’s population continues to grow but at a moderate pace compared to past decades. Fertility rates have declined from high levels in the 20th century due to improvements in education, especially for women, and better access to reproductive health services. Its growth rate is neither explosive nor stagnating, placing Indonesia in a demographic sweet spot relative to many developed and developing countries.
Economic and Social Significance
Like India, Indonesia’s size brings economic advantage:
Huge domestic market: With nearly 300 million consumers, it’s a key destination for businesses and a core component of the ASEAN economic bloc.
Labor force dynamics: A large and relatively young workforce offers potential economic advantage if job creation and skill development keep pace.
Urbanization and infrastructure needs: Cities like Jakarta — which alone had tens of millions of residents by 2025 — face congestion, environmental stress, and housing shortages.
Indonesia’s demographic path will have a direct impact on Southeast Asia’s economy — especially as it navigates urban growth, technology adoption, and education-to-employment transitions.
🇧🇷 Brazil – Latin America’s Largest Population
Population Size
In 2025, Brazil — the largest country in South America — has an estimated population of about 212–213 million people. While smaller than India and Indonesia, Brazil remains a demographic heavyweight in the Western Hemisphere.
Demographic Context
Brazil’s population growth has slowed significantly compared to earlier decades. Fertility rates fell steeply from the late 20th century onward, as urbanization increased, women's education levels rose, and access to family planning expanded. As a result, Brazil is now in the demographic transition phase typical of middle-income countries — where births and deaths both are relatively low.
This slower growth means Brazil’s population is aging faster than some of its emerging-market peers. While this creates challenges — especially for pensions and healthcare — it also means fewer pressures on infrastructure compared to nations with younger, faster-growing populations.
The Role of Population in Brazil’s Growth
Domestic market size: With over 200 million consumers, Brazil remains a major internal market for goods and services.
Regional influence: Brazil’s demographics, combined with resource wealth and a diverse economy, make it a central player in Latin America’s development.
Human capital and labor: Slower population growth can be beneficial if it’s paired with improved skill levels and innovation — Brazil invests heavily in education and technology relative to many emerging peers.
📊 Comparative Highlights
Country Approx. Population 2025 Global Rank (Population) Growth Trend Key Demographic Feature
India ~1,460 million (1.46 B) #1 Growing Young population; demographic dividend potential.
Indonesia ~285 million #4 Moderate growth Largest in Southeast Asia; demographic poised for economic expansion.
Brazil ~212 million ~#7 Slow growth Aging faster; large middle-income population.
📌 Why These Populations Matter for Economic Growth
Population size affects economies in multiple ways:
1. Workforce and Productivity
Large working-age populations can boost economic output if there are jobs, education, and training. India and Indonesia still have growing youth populations, while Brazil’s is more stabilized.
2. Consumer Markets
Consumers drive demand for products ranging from basic goods to technology, housing, healthcare, and services. Big populations mean large markets — attractive to domestic and foreign businesses.
3. Urbanization
All three countries are experiencing rising urban populations. Urbanization brings economic opportunities — innovation hubs, services, and productivity gains — but also strains housing, transport and pollution controls.
4. Social Services and Infrastructure
Governments must balance investments in education, healthcare, water, sanitation, and transportation to support their populations. The challenge is especially acute in rapidly growing nations where infrastructure often lags population growth.
5. Global Influence
Demographically large nations wield political and cultural influence. India’s role in global affairs is partly rooted in its demographic weight, just as Indonesia’s represents ASEAN’s demographic core, and Brazil anchors South America in international forums.
📅 What Lies Ahead?
Looking beyond 2025:
India’s population may continue rising into the 2030s, eventually stabilizing or declining as fertility rates stay low and urbanization deepens.
Indonesia will keep growing slowly, with population shifts depending on urban development and economic opportunities.
Brazil may see its population plateau or even decline later in the century, reflective of broader trends in middle-income countries.
Each of these demographic paths will shape economic opportunities, policy debates, and global influence — making population not just a statistic, but a central factor in future world trends.

$BNB is compressing inside a clean bearish pennantCRYPTOCAP:BNB is compressing inside a clean bearish pennant after a sharp impulsive drop.
This structure usually acts as a continuation pattern, not a reversal — meaning direction matters, and right now momentum is still tilted to the downside.
Price is currently hovering around ~638, right at the apex of the pattern, where decisions happen fast.
🔴 Bearish Breakdown Scenario (Primary Bias)
If #BNB breaks and closes below the lower pennant support (~630–625) with volume:
Downside targets
610 – 600 → first liquidity sweep
585 – 570 → previous swing low (high probability)
540 – 520 → full measured move of the pennant
This aligns perfectly with the prior impulsive leg that formed the pennant.
🟢 Bullish Invalidity Scenario
Bearish structure fails only if price:
Reclaims 660–670 decisively
Breaks above the upper pennant trendline
Upside levels (relief bounce only)
670 – 690
710 – 730
Unless this reclaim happens, upside moves remain corrective, not trend-changing.
Key Takeaways
Pattern: Bearish Pennant
Market state: Compression → Expansion coming
Below 630 = acceleration
Above 670 = structure invalidation
$ETH is forming a clear triple-top rejection on the 1Hr Chart CRYPTOCAP:ETH is printing a clear triple-top style rejection on the 1H timeframe.
Marked as Top 1 → Top 2 → Top 3, price keeps failing to hold above the same supply zone, which tells us buyers are losing strength on every push.
At the same time, price is holding a horizontal base around ~2000–2020, which is acting as short-term demand. This creates a compression structure — range is tightening, and directional expansion is coming.
If #ETH loses the base (~2000–2020) with a strong close:
Downside targets
1980 – 1950 (first reaction zone)
1900 – 1850 (previous impulse base)
1800 – 1750 (major HTF demand / liquidation zone)
This aligns with past breakdown behavior after multiple top rejections.
🟢 Bullish Scenario (needs confirmation)
Only valid if #ETHEREUM reclaims and holds above 2140–2160 with volume:
Upside targets
2200 – 2250
2320 – 2350 (range high / liquidity sweep)
Without a clean reclaim, upside moves are likely to be sell-the-rip.

#BTCUSD🚀 Bitcoin Technical Update 📊
After hitting a low of $60K on Feb 7, Bitcoin completed its A-wave correction, retracing around the 38.2% Fibonacci level. This structure suggests a classic zig-zag correction.
🔮 Now, we’re likely entering the C-wave, with potential upside targets in the $77K–$81K range over the next 1–2 days.
👉 What’s your take—are we about to see Bitcoin break new highs, or will resistance hold strong?
💬 Drop your thoughts below ⬇️ — let’s spark a discussion!
#Bitcoin #CryptoTrading #TechnicalAnalysis #ElliottWave #CryptoCommunity

BTCUSDT Weekly: Ichimoku Tenkan Rejection Defines the CeilingOn the weekly chart , BTCUSDT remains in post-Kumo breakdown regime , with price rejected at Tenkan-sen , which continues to act as dynamic resistance. A weekly close above 79,360 is required to invalidate this rejection.
On the monthly , price has closed below Kijun equilibrium for a second consecutive month , reinforcing that this is not a short-term dislocation but a broader loss of balance .
Until short-term resistance is reclaimed and monthly equilibrium is restored, price discovery remains skewed to the downside

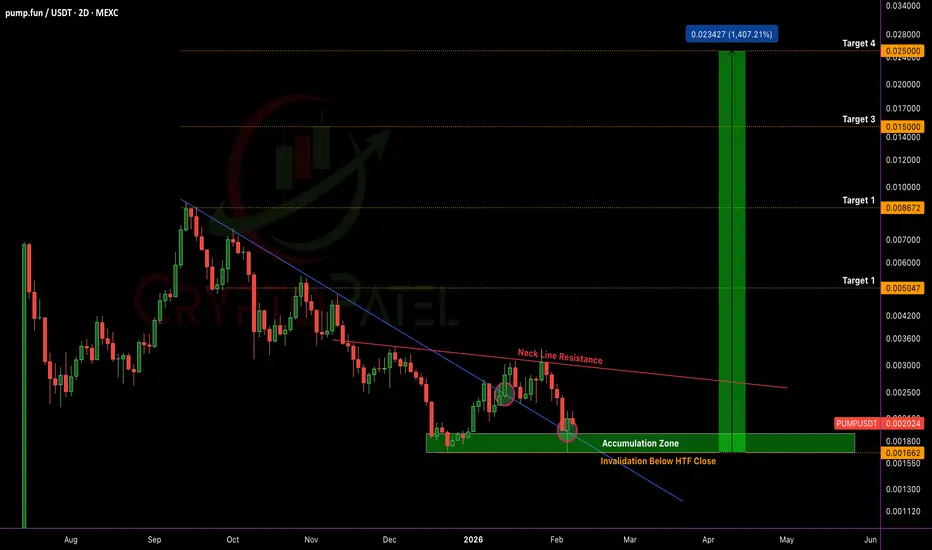
$PUMP PRICE PREDICTION | 15x UPSIDE POTENTIAL IF HTF BASE HOLDSNYSE:PUMP PRICE PREDICTION | 1,500% UPSIDE POTENTIAL IF HTF BASE HOLDS
#PUMP is trading inside a HTF Accumulation Zone after completing a long-term descending wedge, signaling a potential macro trend reversal.
Technical Structure Overview:
✅ Multi-month descending wedge breakout confirmed on 13th January 2026
✅ Breakout and Retest successfully completed ($0.0025 → $0.0017)
✅ Current retest zone aligns with HTF demand, offering a favorable entry area as per the chart
✅ Strong Accumulation holding Above $0.0015
✅ Structure Remains Bullish above $0.0015 Support (HTF hold)
✅ Sustained acceptance above Accumulation = Continuation
CryptoPatel Expansion Targets: $0.00504 → $0.00867 → $0.01500 → $0.02297+
Altseason Confirmation: A decisive break and hold above $0.0030 would confirm strength and mark real Alt Season Entry for NYSE:PUMP
Upside Potential:
If price holds above $0.0015 support, PUMP/USDT Carries 1,500%+ upside potential in the near future based on HTF expansion.
❌ Invalidation:
HTF close below $0.0015 invalidates the reversal structure and opens downside risk.
TA only. Not financial advice. ALWAYS DYOR.
Weekly Analysis with buy/Sell scenarios in BTCAnother selling week. Price made low of 59977 and closed above ~70K. Overall BTC is still bearish and we may see further downfall after some pullback. ~74500 is critical level for pullback. ~55K is critical next level. We may witness a consolidation and reversals on 50K – 55K zone.
Price will remain bearish till delivery changes at 4-hour time frame. Currently price has formed double top in 4H time frame which is a good signal for further downside move.
Weeks back we analyzed down fall toward 65K and further ~50K and price made the low of 60K so far. So our overall analysis is still stands good.
Critical Points
1. Price has created double top in 4H TF and targeting further low.
2. Price may hit the zone of 50K-55K and show the delivery change.
3. Next POI is second quadrant of weekly time frame.
4. Price may consolidate at this level and form MSS at this POI and possibly reverse for further highs.
5. Most probably price will take liquidity of FVG/RDRB level and create MSS/CISD/TS/iFVG in LTF.
6. Price should show rejection/reversal in respective LTF (4H/1H) at Key Level/FVG zone.
7. Take the trade only once clear entry model i.e. turtle soup. iFVG break, CDS or MSS happens on LTF.
All these combinations are signalling a high probability and high reward trade scenario.
Note – if you liked this analysis, please boost the idea so that other can also get benefit of it.
Also follow me for notification for incoming ideas.
Also Feel free to comment if you have any input to share.
Disclaimer: This analysis is for educational purposes only and does not constitute investment advice. Please do your own research (DYOR) and check with your financial advisor before making any trading decisions.

Bitcoin BEARISHThe Bitcoin run looks cooked for now. Despite all the hype around $150k–$200k, sellers are in control and momentum has flipped bearish. I’m expecting further downside into year-end, a choppy ranging market through 2027, and the next real bullish phase starting in 2028. Just my read of the market.

BTC/USD : Weekly Head & Shoulders Breakdown Bitcoin has completed a clear Head & Shoulders distribution structure on the weekly timeframe , followed by a decisive breakdown below the neckline. Price is now trading into a key higher-timeframe demand zone , where long-term market intent will be revealed.
This area is critical for understanding whether the move is true bearish continuation or a liquidity-driven reset before expansion .
🔍 What the Weekly Chart Is Showing
➤ Well-defined Left Shoulder, Head, and Right Shoulder structure
➤ Clear rejection from the head region, signaling distribution
➤ Breakdown below neckline confirming structural weakness
➤ Price approaching a major historical demand zone
📊 Price Action & Market Psychology
➤ Head & Shoulders on higher timeframe often signals trend exhaustion
➤ Breakdown candles show strong institutional selling pressure
➤ Current zone may act as a liquidity grab for weak longs
➤ Long wicks and reactions here will be crucial for next cycle bias
🎯 Key Scenarios to Watch
➤ Strong reaction from demand → range formation & accumulation
➤ Liquidity sweep below demand → smart money absorption
➤ Clean reclaim of S/R interchange → bullish structure rebuilding
➤ Failure to hold zone → extended bearish continuation
⚠ Execution & Risk Notes
➤ This is a higher-timeframe zone, not a scalping area
➤ Avoid emotional bias based on single weekly candles
➤ Let structure confirm before committing capital
➤ Patience is the real edge on HTF charts
📌 This analysis is based on weekly market structure, liquidity behavior, and price action.
📚 Higher timeframes define direction — lower timeframes define execution.
Disclaimer:
This analysis is provided for educational and informational purposes only. It does not constitute financial advice or a recommendation to buy or sell any financial instrument. Cryptocurrency markets are highly volatile. Always do your own research and manage risk responsibly. The author is not responsible for any trading losses.

BTC Forms Bearish Pennant, 67-65K Zone Next?"BTC Forms Bearish Pennant, 67-65K Zone Next?"
- The primary trend in Bitcoin remains bearish, and on the 4H chart the prices are forming a bearish pennant.
- Any breakout below the pennant will drive the prices lower towards 67390 given the immediate support at 69677 is breached.
The Bollinger band is trending lower and prices with the breach of the pennant might also breach the middle band. RSI is also taking resistance of the mid-50 neutral level and stays in the selling zone.
