Will Bitcoin going toward $65000 ?#Bitcoin Following Perfectly 🔻
Strong Resistance: $95000 ( Bullish Above )
Strong Support: $70000
CRYPTOCAP:BTC
Crypto market

BTC broke down the important trendlineBTC broke from the important trendline and headed to $78k.
Momentum looks good and might pick up. Present 4hr candle should be considered

BTC Showing A big down moveWait for weekly candle closing
If close maintain stoploss
Do not use high leverage in this type of market

You need to be a simple invstorThe most effective way to find the dip is...following my updates for long term view. I told you guys to f*king bought the dip in 2022, but you did not listen. NOW you come back and ask me is it ok to buy now at 100k range? THAT'S SO REDICULOUS!

BTCUSD SHOWING A GOOD DOWN MOVE WITH 1:10 RISK REWARD BTCUSD SHOWING A GOOD DOWN MOVE WITH 1:10 RISK REWARD
DUE TO THESE REASON
A. its following a rectangle pattern that stocked the market
which preventing the market to move any one direction now it trying to break the strong resistant lable
B. after the break of this rectangle it will boost the market potential for break
C. also its resisting from a strong neckline the neckline also got weeker ald the price is ready to break in the outer region
all of these reason are indicating the same thing its ready for breakout BREAKOUT trading are follws good risk reward
please dont use more than one percentage of your capitalfollow risk reward and tradeing rules
that will help you to to become a bettertrader
thank you

Forex Weekly Analysis DXY, BTC, Gold, Eurusd, Nifty50, JORTOW Forex Weekly Analysis DXY, BTC, Gold, Eurusd, Nifty50, (09/03/2025 to 15/03/2025)
In this week’s Forex analysis, we dive deep into the market trends and price movements Join us as we explore:
BTC (Bitcoin)
Key levels and potential breakout points.
DXY (US Dollar Index):
Key levels and potential breakout points.
Gold:
Analysis of gold’s performance and future price predictions.
EUR/USD:
Detailed examination of the Euro vs. US Dollar pair.
GBP/USD:
Insights into the British Pound vs. US Dollar pair.
And much more!

Raoul Pal’s Investment Edge: The Art of Predicting Market ShiftHello Traders! First of all, no, this is not about me! 😆 I am Rahul Pal , and this is about Raoul Pal , the legendary macro investor! But don’t worry— my time will come too! Until then, let’s take this opportunity to learn from one of the best in the game and explore his key investment principles and strategies that have made him a market icon.
Raoul Pal is not just another investor—he is a master of macro trends who has successfully predicted major shifts in financial markets, global liquidity cycles, and the rise of digital assets. From his early bets on Bitcoin and Ethereum to his deep understanding of monetary policies and their impact on financial markets , his approach has helped thousands of traders and investors navigate volatile conditions and stay ahead of the curve.
So, let’s break down his top investing lessons and see how we can apply them to build wealth, manage risks, and seize big market opportunities!
Raoul Pal’s Key Investment Strategies
Macro Investing Approach – Pal focuses on big-picture economic trends, analyzing global debt cycles, interest rates, and monetary policies to predict major market movements.
Early Crypto Adoption – He was one of the early institutional investors to bet big on Bitcoin and Ethereum, predicting their rise as alternative financial systems.
Liquidity Matters More Than Fundamentals – Pal believes that liquidity in financial markets drives asset prices more than just company fundamentals.
Bet on Big Trends Early – He identified major shifts in technology, crypto, and decentralized finance (DeFi) before mainstream adoption.
Understanding Market Cycles – He studies boom-and-bust cycles to anticipate major economic shifts and position himself accordingly.
Diversification with a Focus on Asymmetry – Pal emphasizes investments with high potential upside and limited downside risks, such as Bitcoin and tech stocks.
Raoul Pal’s Bold Market Predictions
Bitcoin to Reach $1M? – Pal has predicted massive upside potential for Bitcoin, citing global money printing and institutional adoption.
The Rise of Digital Assets – He believes that crypto, NFTs, and tokenized assets will be a major part of the financial future.
US Dollar Liquidity Crisis – Pal has warned about potential economic instability caused by excessive debt and monetary easing.
What Traders Can Learn from Raoul Pal
Follow the Macro Trends – Pay attention to global interest rates, central bank policies, and economic cycles to position yourself ahead of big moves.
Be Open to New Asset Classes – Consider crypto, technology, and emerging financial innovations for long-term wealth creation.
Risk Management is Key – Even with bold predictions, Pal manages risk and focuses on asymmetrical returns.
Adopt a Long-Term Perspective – Major trends don’t happen overnight, so patience is crucial when investing in macro shifts.
Conclusion
Raoul Pal’s macro investing strategies provide valuable insights into navigating global markets, identifying emerging trends, and managing risk effectively. His focus on big-picture thinking has helped him stay ahead of market shifts, making him a legend in the world of investing.
Do you follow macro trends in your trading? Let me know in the comments! 👇

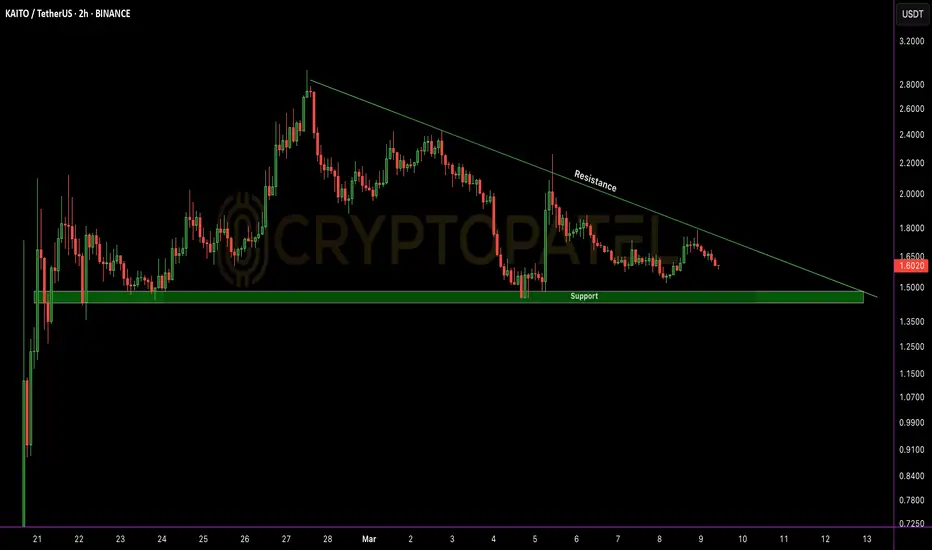
Will $KAITO go down -50% downside move?$KAITO Price Action Update
$KAITO is currently trading at $1.58, holding strong above the key $1.45 support level.
🔹 Key Levels to Watch:
✅ Support: $1.45 – Holding above this level could trigger a strong upside rally, targeting the $1.75 resistance and beyond.
❌ Break Below Support: If $1.45 fails, a 30-50% downside move is possible.
🚀 A decisive move above $1.75 could open doors for further gains. Keep a close watch on these levels for potential opportunities.
🔍 Stay informed, manage risk, and trade wisely.
📢 DYOR – This is not financial advice!
#KAITO #CryptoTrading #MarketUpdate #TechnicalAnalysis
btcusd in a rangestock has a consolidation zone both side is chance high chance is lower side because making lower high
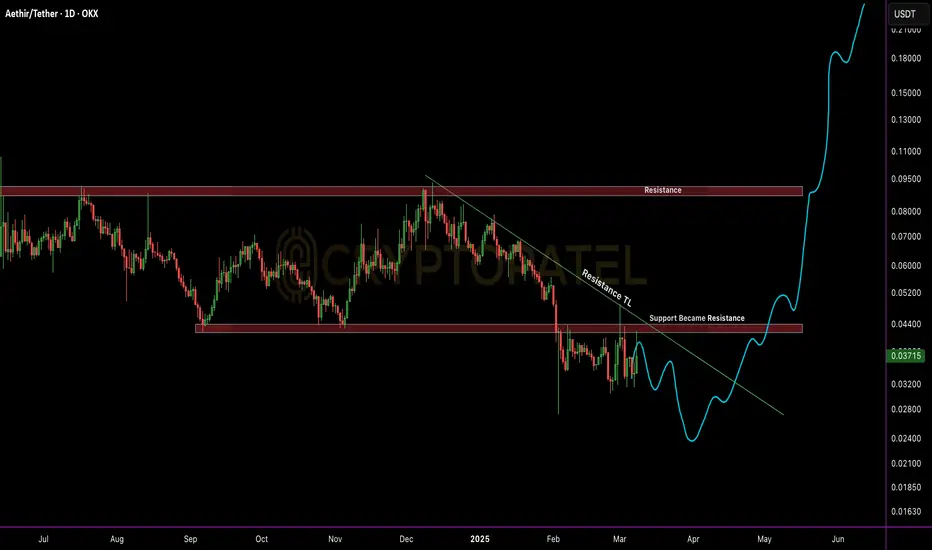
$ATH Technical Outlook: Accumulation Opportunity? TSX:ATH Technical Outlook: Accumulation Opportunity? 🚀
#ATH is trading at $0.037, below key resistance at $0.045 – bearish unless it breaks above. A breakout could push it to $0.09 and beyond.
🔹 Accumulation Zone: $0.037 – $0.020
🔹 Targets: $0.1 / $0.3 / $0.5 / $1
Solid project, good dip-buying opportunity. Watch key levels & manage risk!
Not Financial Advice – DYOR! 🚀
#aethir #Alts
Will $SUI hit $10 in Current Bull Market?Will CRYPTOCAP:SUI hit $10 in Current Bull Market?
Key support zone: $2.50-$2 – Holding this level is crucial for a potential breakout toward $10.
Price action suggests a strong bounce from this demand zone, making it a strategic re-accumulation area for high-R:R setups.
#SUI #Altcoins

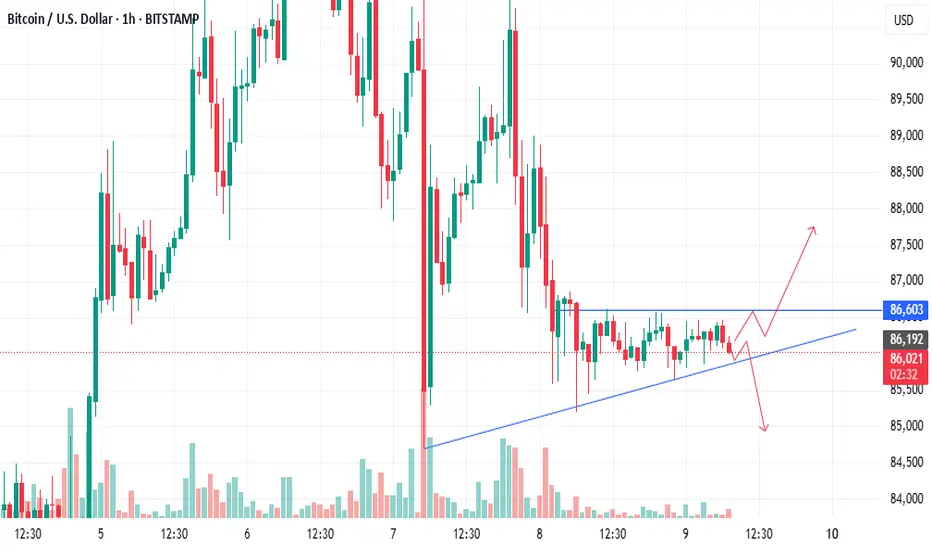
BitcoinBitcoin rising from $85,189 to $88,000 today implies an anticipated increase of about 3.3%. Given the current market conditions and recent price movements, such a rise is within the realm of possibility, though it would require a reversal of the current downward trend.
It's important to note that Bitcoin's price has experienced significant fluctuations recently. Following President Donald Trump's announcement of a U.S. strategic crypto reserve, Bitcoin's value surged by over 11%, reaching a high of $95,136. However, it remains below its record high of $109,135 achieved in January 2025.

BTC#20: BTC Analysis: Price SW In Triangle – Next Direction?💎 💎 💎As analyzed in the previous article, BINANCE:BTCUSDT gave a bad price reaction when touching the old resistance area of 95~96x. The current price is SW in the triangle. Let's analyze the next plan BINANCE:BTCUSD : 💎 💎 💎
1️⃣ **Fundamental analysis:**
📊President Donald Trump signed an executive order to establish a Strategic Cryptocurrency Reserve that includes 200,000 BTC seized in criminal or civil cases. It will be held as a reserve asset and not sold. In addition, the Government will not purchase additional assets for the reserve.
🚀The Treasury and Commerce Departments may consider budget-neutral Bitcoin purchases. Agencies must provide full accounting books of digital assets to the Ministry of Finance. Regulatory crackdowns on crypto assets are ended
📌 From the above information, it can be seen that BTC and the top 5 coins in the market have been officially recognized as an asset. The legal framework will take time to complete. However, BTC will receive more attention and attention when the US government makes any purchase moves to hoard. This will lead to a huge demand for BTC in the near future.
2️⃣ **Technical analysis:**
🔹 **D Frame**: The price structure is still bearish, we have had a recovery phase to retest the resistance area and give a bad price reaction. It is entirely possible that BTC will go down to the support zone below
🔹 **H4 Frame**: We can see the price reaction more clearly. The continuous reaction of lower peaks in this area shows that the market sentiment is still dominated by the bears even though BTC has been recognized as a reserve asset.
🔹 **H1 frame**: The price is still SW in the triangle area in recent days. The price range is gradually narrowing as shown on the chart
3️⃣ **Trading plan:*
⛔ At the present time, it is no longer suitable to wait for a BUY position. The price has tested the resistance area and reacted badly, so there is a high possibility that there will be a correction below the support area below at any time.
✅ The top priority is to trade in accordance with the main trend in the SELL direction. Although the information about the Reserve Fund has given a positive response, the government not buying more assets for the reserve is also a sign that short-term cash flow will be difficult to push into BTC, especially when tariff policies are giving negative reactions to the economy.
💪 **Wishing you success in achieving profits!**

Will Ethereum Fall below $1500 or Ready to $8000 ?#Ethereum Fresh Weekly Analysis
🔹 Current Trend: CRYPTOCAP:ETH has dropped -51% in the last 3 months, signaling a major retracement.
🔹 Key Support Zone: Trading above $2000-$1900, a crucial accumulation zone for this bull market.
🔹 Upside Targets: If #ETH holds this support, we could see $6000 / $8000 / $10,000 in the coming months.
🔹 Risk Factor: If ETH fails to hold $2000, expect a potential dip towards $1500—a key level for long-term accumulation.
Smart Strategy:
✅ Accumulate ETH on dips instead of chasing tops.
✅ Wealth is built by buying in bear markets and selling in bull cycles.
✅ Long-term holders should focus on accumulation, not panic selling.
IMO ETH/USDT has strong potential in this bull cycle—buy smart, hold strong!
Note: Not Financial Advice so DYOR

BTC/USD TECHNICAL ANALYSIS – WHAT’S NEXT?📌 Timeframe: 2H
BTC/USD is currently trading within a symmetrical triangle pattern, signaling a phase of accumulation before a potential major breakout.
📈 TREND ANALYSIS & KEY PRICE LEVELS
1️⃣ Current Trend
BTC is trading around $86,301, moving within a narrowing price channel.
Price is caught between the ascending trendline support and the key resistance zone at $90,000 - $92,000.
A breakout above this zone could trigger a strong bullish move towards $98,000+.
Conversely, a failure to hold support may push BTC down to $82,764, with further downside potential towards $78,000 - $80,000.
2️⃣ Key Levels to Watch
🔺 Major Resistance Levels:
$90,000 - $92,000: Strong resistance; a breakout here could lead to a rally.
$98,000: The next target if BTC successfully breaks above resistance.
🔻 Major Support Levels:
$82,764: Closest support; a breakdown could trigger further downside.
$78,000 - $80,000: A strong demand zone that could provide a solid bounce if BTC dips further.
📉 POTENTIAL TRADING SCENARIOS
📌 Scenario 1 – Bullish Breakout 🟢
If BTC breaks above $90,000 - $92,000, it could confirm a bullish trend continuation toward $98,000+.
Watch for strong volume confirmation and a clear close above resistance.
📌 Scenario 2 – Bearish Rejection 🔴
If BTC fails to break $90,000 - $92,000, it could retrace to $82,764.
A further break below this level could send BTC down to $78,000 - $80,000 before finding strong support.
⏳ CONCLUSION – PREPARE FOR A BIG MOVE!
📊 BTC is in a critical accumulation phase, setting up for a major breakout soon.
📈 If BTC clears $90,000 resistance, the bullish trend will likely continue toward $98,000+.
📉 If BTC rejects and drops below $82,764, a deeper correction to $78,000 is possible.
⚠ Traders should wait for a clear breakout signal & manage risk carefully ahead of the big move!
📢 Do you think BTC will break out or correct further? Share your thoughts below! 🚀🔥

BTC - Support and Resistance as on 7th marchIn cart green and red lines indicating support and resistance. US President clearly said Do not Sell your Bitcoin. Even though he didnt mention how much will be purchased etc but we have a new Govt going to form a strategic reserve with spending tax money so it could be slow to see banana spikes but I think its going to be Bullish for BTC

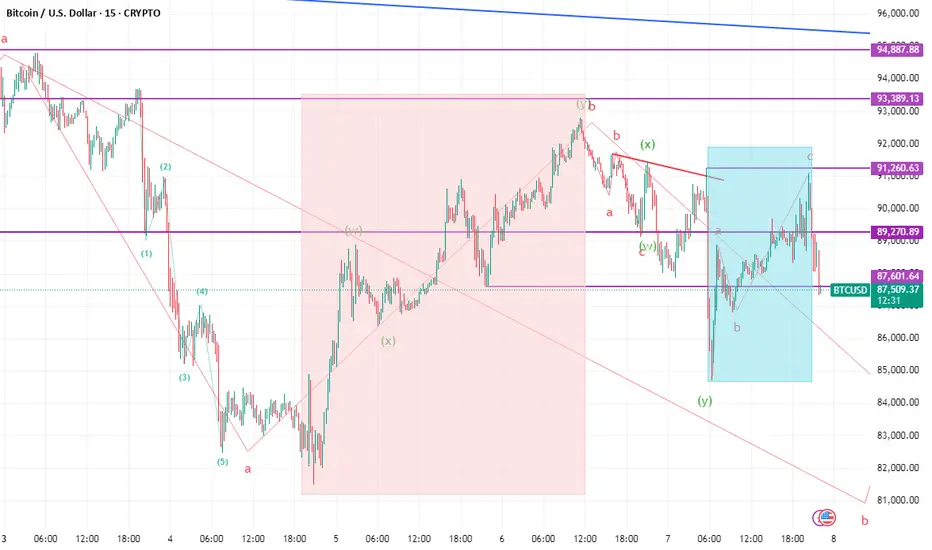
BTC market fractal example on live chartWe can see a beautiful pattern of market fractal.
We can see in pink a move after big fall( Quick rise and than 3 wave corrective)
See in latest today pattern in blue.
Big fast fall and same quick rise and corrective pattern.
TIME FOR (TRUMP)Hey there! It looks like you might be referring to a “demand zone.” This term can have different meanings depending on the context. In financial markets, for example, a demand zone is an area on a price chart where there has been significant buying activity in the past, and it’s likely that buyers will step in again if the price reaches that area.

DEMAND ZONE (GALA )Hey there! It looks like you might be referring to a “demand zone.” This term can have different meanings depending on the context. In financial markets, for example, a demand zone is an area on a price chart where there has been significant buying activity in the past, and it’s likely that buyers will step in again if the price reaches that area.

BTCSymmetrical triangle formed. Breakout out on either side can take it to 12000 point up or down. Draw it on your chart. Will help you to trade better.

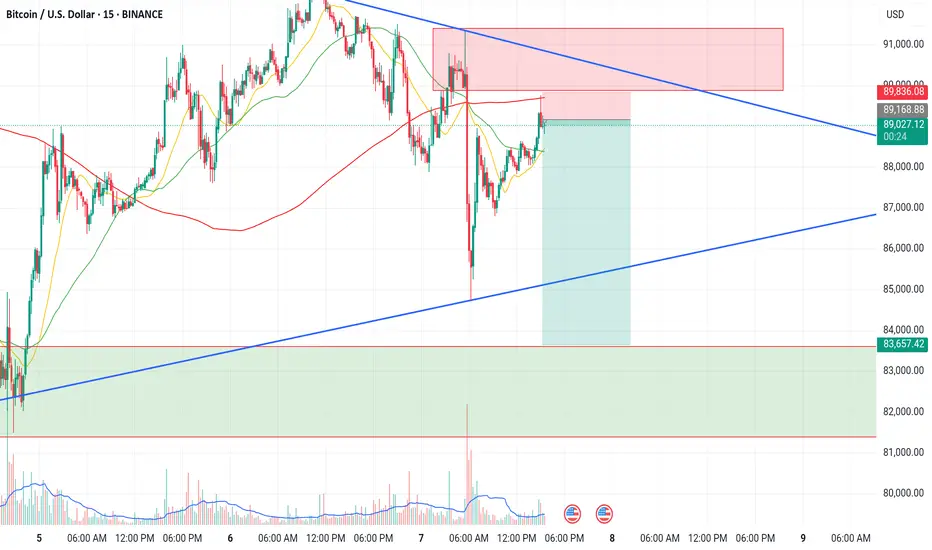
Very good shorting opportunity in BTC. Trade setup explainedBtc is getting rejection from 1hour supply zone. We can short btc with sl of 89840. We can target level of 83650. Risk reward ratio of the trade is very good i.e 1:8. Below at 83000 levels We have a demand zone which will be our target for the trade.
Bitcoin Bybit chart analysis March 6Hello
It's a Bitcoinguide.
If you have a "follower"
You can receive comment notifications on real-time travel routes and major sections.
If my analysis is helpful,
Please would like one booster button at the bottom.
This is the Bitcoin 30-minute chart.
There will be a Nasdaq index announcement at 10:30 in a little while.
At the bottom left is the long position entry point on March 5th.
The purple finger is connected to $88,407.
*Red finger movement path
One-way long position strategy
First wave check in section 1 at the top
1. Long position entry section of $90,698 / Stop loss price when purple support line is broken
2. Long position 1st target of $94,236.5 -> Gap8 2nd target
(Today's 4-hour chart, 12-hour chart resistance line section is $94,236.5
Since we don't know how much the adjustment will come out, it's okay to use a short position.)
3. After long profit cut, section 1, $91,884.5 long position utilization section
After that, long position target price in order of Top -> Good section.
Section 1 at the top
If there is an adjustment after the touch, a short->long movement will occur in NASDAQ
and it is more advantageous to wait for a long than a short,
and Section 2 at the bottom is a safe long position entry section where a short-term pattern is maintained.
From Section 3, there may be an additional decline,
so it would be good to check Bottom -> $83449.5 as indicated.
My waist and shoulders are not so good
I will enter early here today
Please use my analysis article as a reference only
Don't forget the 6 principles of trading and the essential stop loss price
and operate safely
Thank you.

Bitcoin showing weakness. It may test 76076Bitcoin chart is weak now. weakly RSI below 60 MACD also negative. Double top pattern form and correction showing. As per chart it may test 76076 soon. It can short on any bounce up to 92000.
These is Neckline place near 76076 of Inverse H&S pattern. It would be retest of neckline.
