IS TRUMPUSDT A PHOENIXFrom the high of 78.28 this meme coin has steadily fallen in what i presume to be a clear a,b and c formation to complete correction that ended at wave c low. from there on there is bullish movement in daily timeframe . i think waves 1,2 3 and 4 are complete with wave 4 minute degree as an expanded flat.(other two are regular and running flats).now if fifth wave forms either as an impulse or ending diagonal, then wave 1 minor degree completes that paves the way for further bullish moves. only time and price action will confirm or repute this analysis.no analysis is perfect.it is only probability not certainity. wave analysis helps us to know where we are in the developing wave pattern or structure.
Crypto market

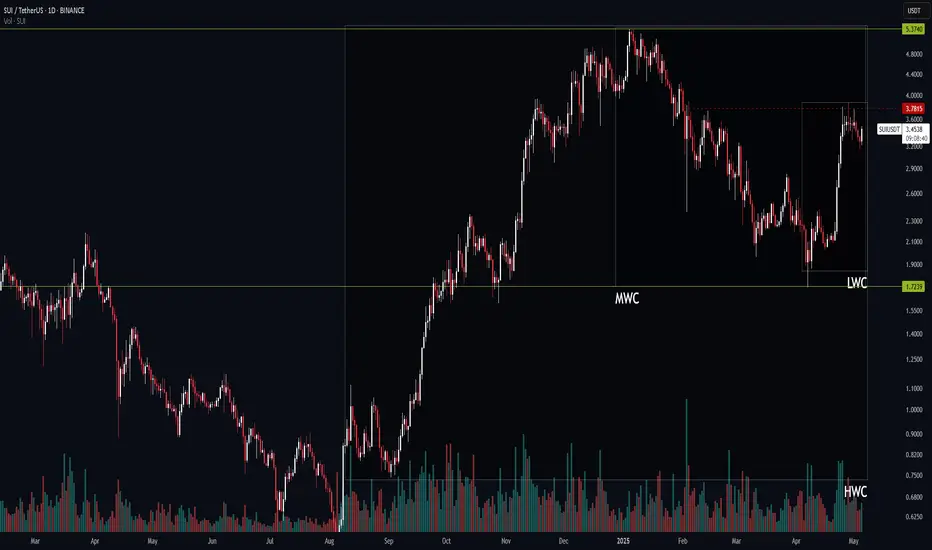
SUI Daily Timeframe – A Big Move Is Loading!BINANCE:SUIUSDT
🧠 Market Cycle Overview:
HWC (High Wave Cycle – Higher timeframe): Bullish 🔼
MWC (Medium Wave Cycle – Medium timeframe): Bearish 🔽
LWC (Low Wave Cycle – Lower timeframe): Bullish 🔼
When the higher and lower timeframe cycles are bullish but the mid-term is bearish, it usually means the market is in a resting phase. This kind of setup can often give us a golden long opportunity! 🎯
📊 Price Action & Volume:
For the past 12 days, SUI has been ranging with decreasing volume. This drop in volume is often a sign that a big move is near. Just be careful — in this phase, the market might make small fakeouts to hit stop-losses.
🔻 Short Setup:
Right now, I’m not opening any short positions until I see the next clear leg.
I wouldn’t recommend shorting either, since it’s going against the main cycles.
But as always, stick to your own plan — this is just my view, not a signal. 👀
🔺 Long Setup:
The $3.7815 level was the last point where price reacted and dropped.
If we get a strong breakout above that, it’s a valid long entry. 🚀
✳️ Since we’re analyzing on the daily timeframe, the confirmation candle for any breakout should close on at least the 1H (1-hour) or preferably the 4H (4-hour) timeframe to be considered reliable.
🎯 Summary:
The market is in a correction, but the primary direction is still bullish.
Long setups are more favorable — just wait for breakout confirmation and manage your entry with patience.
"⚠️ Without proper risk management, you're just a ticking time bomb!"
— PXA 📊
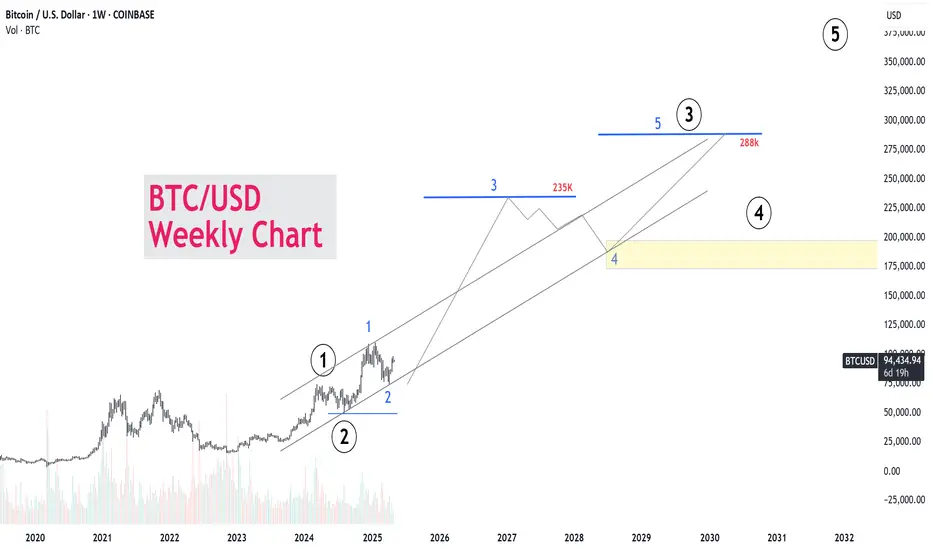
“Bitcoin Weekly Elliott Wave Analysis: Wave 3 Targeting $235K”📈 BTC/USD Weekly Elliott Wave Outlook
🗓️ Chart Published: May 5, 2025
💰 Current Price: $94,359
🚨 Wave 3 Has Begun — Long-Term Bullish Outlook
According to the Elliott Wave count on this weekly chart:
1️⃣ Wave 1 (2023–2024) is complete.
2️⃣ Wave 2 (a deep correction) successfully held support at the channel base.
3️⃣ Wave 3 is now unfolding and could reach between $235K and $288K — potentially a +215% rally from the current price.
4️⃣ Wave 4 correction expected in the $175K–$200K zone around 2029.
5️⃣ Wave 5 could take BTC beyond $300K+ in early 2030s.
📊 This is a macro impulse structure, where Wave 3 is historically the strongest. Price is trending well within the long-term ascending channel, giving confidence in a multi-year bull trend.
📍 Key Levels to Watch:
Wave 3 targets: $235,000–$288,000
Wave 4 correction zone: $175,000–$200,000
Final wave 5: To be projected post-Wave 4
📚 "Patience is profit." We're early in Wave 3 — the biggest opportunity for high R:R setups.
📎 #Bitcoin #ElliottWave #BTCUSD #CryptoForecast #TechnicalAnalysis #Wave3 #MacroTrend #BTCto250K #CryptoBullRun #TradingView #BTC2030

(BTC/USD) 1H Trade Setup – Key Entry, Stop Loss & Dual TargetEntry Point: 95,431
Stop Loss: 95,264
Target Points:
Upside (Target 1): 100,674 (Potential gain: +5.36%)
Downside (Target 2): 86,614 (Potential loss: -7.57%)
Trade Setup:
Risk-Reward Ratio:
Approx. 1:0.7 (Not ideal; the reward is smaller than the potential loss)
Support Zones:
Highlighted in purple beneath the entry zone — this indicates a historically strong support area.
Resistance Zones:
The upper purple zone marks the next significant resistance around 100,000–100,795.
Technical Indicators:
50 EMA (Blue Line): Indicates mid-term trend support, currently holding price action.
Price Action: BTC appears to be retracing toward support after a bullish rally.
Interpretation:
The setup implies a long (buy) position with a very tight stop loss.
The price is nearing a support zone, and if it holds, there's potential for an upward move to the target at 100,674.
However, if price breaks below 95,264, a sharp drop to 86,614 is anticipated.

Bitcoin many times buy recommended near 82500 ,101k -105k TargetHow to take trades using Harmonic pattern projection Trade setup is explained below :-
Entry : 1st SL point : 0% is recent top or bottom.
Trailing D: 15.1% is work as trailing SL of buy or sell trade if hit then we have to book profit
.If price goes below 2nd D 22.5% to 24.5% range then early traders can make fresh reversals trade after breaking 1st D 15.1% safe traders can reversal trade after breaking Point D 22.5.4% to 24.5% range
Targets :
Target T1 : 36.1% to 38.3%
Target T3 : 49.1% to 52.5%
T3: 60.9% to 64.8% is our 3rd Target since this is reversal zone so must book profit if break then take fresh trade again
Target T4 : 76.4% to 79.7%
Next Targets are 100% , 127.2% ,141.4% and final Target 161.8%.
How to take reversal trade :
If price going upside/ downside then then buy or sell levels appear on Chart ( Automatically show when price reach any reversal zone of harmonic projection ).
Trailing SL:
After reach 1st Target trail SL to just above or below cost ( for example we are holding sell trade from 100 1st Target 110 hit then move trailing sl to 104-105 and move SL as price move upside or Downside)
Re- Entry :
For Re-entry in any pull back Point D ( 15.1% ) is used for re-entry then SL recent high or low Point SL ( 0% ) .
Blue Line is 1st support/ Resistance
Green line is 2nd support/ resistance
Red line is 3rd Support/ resistance

LITECOIN $500 Potential In Current Bull: Detail AnalysisLITECOIN MACRO BREAKOUT – NEXT LEG INCOMING?
NYSE:LTC confirmed a breakout above its multi-year resistance line after holding the Best Accumulation Zone for months!
🔸 Support Held: ~$65
🔸 Accumulation Zone: ~$85-$65
🔸 Short-Term Target: $255/$500
🔸 Long-Term Target: $1000/$1458+
Same pattern. Same zone. Same breakout.
🔥 I’m super bullish on #Litecoin.
Yes, it has tested our patience… but one strong day in this bull market and it could smash $500.
Let’s not forget — our initial entry was around $50, and it’s still a great range to accumulate.
While $1000–$1500 may not happen this bull run, I personally believe it’s possible in the near future.
⚠️ Of course, this is not financial advice — just my personal view. Always DYOR before investing in any coin.

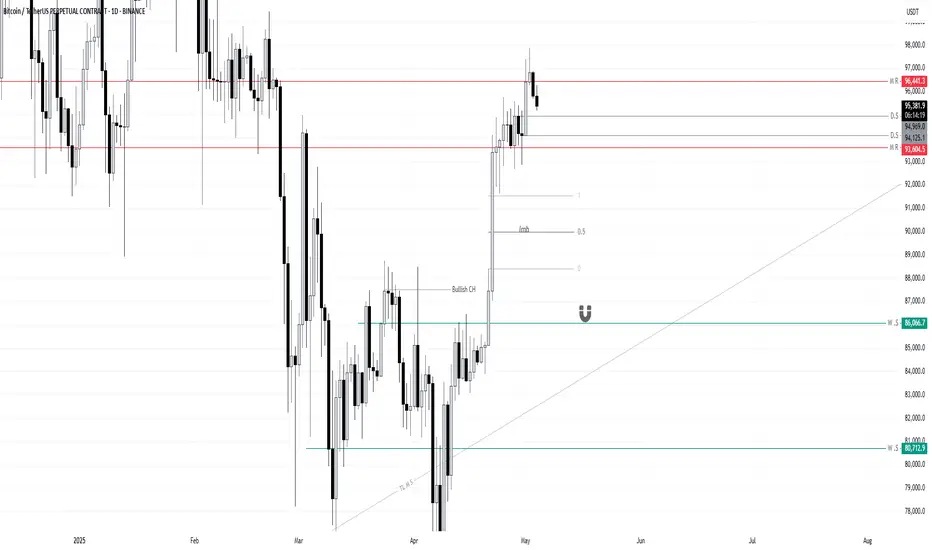
Bitcoin OutLook for Next Week BTCUSDT.pMarket Outlook (BTC/USD):
I’m currently observing the ₹94,125 level on the daily timeframe. A daily candle close below this level would significantly increase the probability of Bitcoin retracing toward the imbalance zone around ₹90,000.
However, there is a key demand zone near ₹86,000, which could act as a strong support and potentially push the market back upward. This area will be crucial in determining whether the bearish momentum continues or a reversal is triggered.
Let’s see how the market reacts around the ₹94,125 level. I’ll post the next update after Monday’s daily candle closes.
Thank you for your continued support — it's truly appreciated.
PLAN BUY ETH NEW WEEK✅ Scenario 1 – Buy at 1830 (Current Price):
Reason to Buy:
Price is close to the EMA 20 and EMA 33 levels – acting as dynamic support.
The 1830–1845 area has been tested multiple times without a clear breakdown.
The upward trendline from the 1720 low is still being respected.
The market may be forming a tight consolidation, preparing for a breakout.
Trading Plan:
Buy Entry: 1,830 USDT
Stop Loss (SL): below 1,800 (around 1,790–1,795)
Take Profit (TP): 1,980 – 2,150 (previous highs and major resistance zone)
Risk/Reward Ratio: Approximately 1:2.5 to 1:4 (excellent if breakout confirms)
⚠️ Scenario 2 – Buy at 1,740 (If Current Trendline Fails):
Reason to Buy:
The 1,740–1,760 zone is a strong support from the longer-term ascending trendline (black line).
Coincides with the EMA 200 on the 4H timeframe – a typical retracement zone during pullbacks.
Potential for a double-bottom pattern if price reacts positively here → forming a higher low.
Trading Plan:
Buy Entry: 1,740 USDT
Stop Loss (SL): below 1,700 (around 1,695)
Take Profit (TP): 1,920 – 2,000 – 2,150
Risk/Reward Ratio: Greater than 1:3 if ETH maintains its higher-low structure
🧠 Strategy Notes:
In both scenarios, ETH must break through the psychological resistance of 1,850–1,880 to confirm bullish momentum.
Volume during the current accumulation phase is relatively low, signaling a potential breakout waiting to happen – watch for large-volume candles on H4/H1.
The long red candle near 1,800 might have been a “bear trap” if the price doesn’t break below recent lows.

BTC/USD) bullish trend analysis Read The ChaptianSMC Trading point update
Technical(BTC/USDT) analysis outlines a bullish outlook with key technical levels and scenarios. Here's a breakdown of the idea:
Key Observations:
1. Trend Break and CHoCH (Change of Character):
The chart shows a clear break of the downtrend, confirmed by the CHoCH label — a common Smart Money Concept (SMC) signal indicating a potential trend reversal from bearish to bullish.
2. Key Zones Highlighted:
EVC-Buying Zone: Around 86,000 – 88,000 (aligned with EMA 200), marked as a strong accumulation area.
New Support Level: Around 92,000 – 93,000, potentially forming a bullish support after the recent rally.
Resistance Levels: Two major resistance zones near:
99,600 (intermediate resistance and target)
106,400 (final target)
3. RSI Indicator:
RSI is near 64, indicating strong momentum but not yet overbought — a potential sign of further upside.
4. Two Bullish Scenarios:
Scenario 1 (Aggressive Bullish): BTC continues upward from the current level and breaks above resistance toward the 106,447 target.
Scenario 2 (Retracement Bullish): BTC dips to the new support or even into the buying zone (86–88k), then rebounds to reach the same targets.
Mr SMC Trading point
---
Idea Summary:
The chart suggests bullish continuation, with potential pullbacks into strong demand zones. It supports both breakout and retracement entries, with targets at 99,632 and 106,447. If price holds above EMA 200 and RSI remains supportive, the upside thesis remains valid.
Pales support boost 🚀 analysis follow)


BTC next 24 hours Important Zones are we heading to $100K Yes/NoHello Guys,
Follow up to our Morning Post, DELTAIN:BTCUSD.P responds exactly to the support base of 95000 Zone and
roaming around those.
What to expect now, if we cross the Supply Zone 1 mentioned in the chart, the next target is
It will test Supply Zone 2, till we are comfortably close above this and trade strongly, doors for Historic $100k will open after that level only, btw you know Target for Bitcoin was predicted by our 10x Bulls Team in year 2021.
An vice versa not holding the 95000 demand zones, will make this difficult for bulls.
Plan your trade with risk properly managed.
-10x Bulls
Courtesy: 10x Bulls (An educational helpdesk platform for investors and traders to find the best investment decisions, faculty trained by ex-fund managers, from Top Finance Institutions such as JP Morgan Chase and Goldman Sachs)

BTC SHORT 3/5/2025Price initially attempted to respect the order block, but failed to sustain bullish momentum or close above the previous high.
A bearish move followed, resulting in a break of the recent low—indicating a shift in market structure.
We then waited for a retracement back to a minor order block or fair value gap (FVG) for a potential entry.
A strong bearish engulfing candle confirmed selling pressure, providing a high-probability entry signal.
Entry was taken at this point, with targets set at previously identified liquidity levels below.
🔔 Like, follow, and comment for more market insights and trade breakdowns.

BTC 97800, Red Balloon Area, Buy Above this onlySince 24 hours after breakout of 95700 zone BTC is struggling to get more attraction and halted near 97800 for a time being where weekly chart is showing higher high candles but in daily chart last 24 hours red candle is obstructing the further uprally for time being, some shorts has been built near 97800, and fresh longs only once these liquidity is squeezed else will watch this BTC Ping Pong show, downside 95000 is crucial support bed, any breach of either zone will decide the fate for next week.
Happy Trading and Investing
~10x Bulls
Courtesy: 10x Bulls (An educational platform for investors and traders to find the best investment decisions, faculty trained by ex-fund managers, such as JP Morgan Chase and Goldman Sachs)
Classic Forecast:
COINBASE:BTCUSD
$15000 to $100000 in 2021 completed in 2024.

Elliott Wave Analysis: Long Position Sushi about to go parabolicElliott Wave Analysis: Long Position
Entry Point: 8any were at buy zone as mentioned on chart
Stop Loss: 0.440
Target Price: 13$
Based on the Elliott Wave theory, the chart indicates a potential long position. The entry point is set at Buy zone, with a stop loss at 0.440 to manage risk. The target price is projected at 13$, suggesting a significant upside potential. This setup aligns with the wave patterns, indicating a bullish trend will be in next 6 or 8 months.

Trap trading strategy This is my Trap trading Strategy where i enter in position before break out level and exit after break out when Retailers gets trap


BTC/USD 4H Chart Setup – Bullish Breakout Targeting $104K1. Trend Direction
⬆️ Uptrend Detected
* Price is forming higher highs and higher lows
* Trading inside a bullish channel
* Breakout potential above the top trendline.
2. Key Zones
🟦 Support Zone: $95,252.31
* Labeled as RBS + RBR ZONE
* Strong buy area → previous resistance turned support
* Perfect area to catch a bounce
📏 Support Line & Trendline
* Trendline keeps price supported along the climb
* Acts as a launch pad for the next move.
3. EMA 70 (📉 Red Line)
* Current value: $93,636.88
* Price is above EMA, showing strong bullish pressure
* EMA acts as dynamic support.
4. Trade Setup
🎯 Target Point: $104,000
🟦 Target Zone: $103,918.60 – $104,747.91
🔥 Entry Zone: $95,252.31 (marked blue box)
⚠️ Stop Loss: $94,091.28
* Positioned safely below support
* Good Risk/Reward Ratio.
5. Extra Cues
📅 Economic event icons near May 3–6 → Potential volatility ahead
⚡ Pullback in progress → May offer a buying opportunity.
Conclusion
🚀 Bullish Setup!
* Watch for a bounce from the blue demand zone
* Targeting $104K breakout
* Strong support + momentum = solid long opportunity.

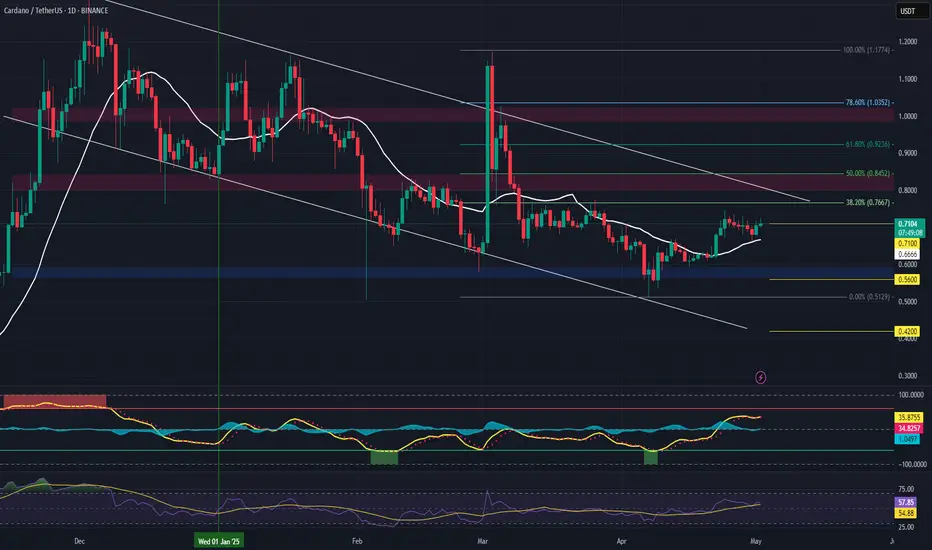
ADA (Cardano) Short Setup – Rejection from Major ResistanceADA is approaching a key resistance zone around the $0.84 level, which aligns with the 50% Fibonacci retracement and yearly open, showing signs of buyer exhaustion and weak momentum.
🔹 Entry:
$0.84 zone (watch for rejection w/ bearish confirmation candle or failed breakout)
🎯 Take Profit Targets:
🥇 $0.71
🥈 $0.56
🥉 $0.42
🛑 Stop Loss:
$0.92 (above key resistance/invalidates setup)
Bitcoin Bybit chart analysis April 30Hello
It's a Bitcoinguide.
If you have a "follower"
You can receive comment notifications on real-time travel routes and major sections.
If my analysis is helpful,
Please would like one booster button at the bottom.
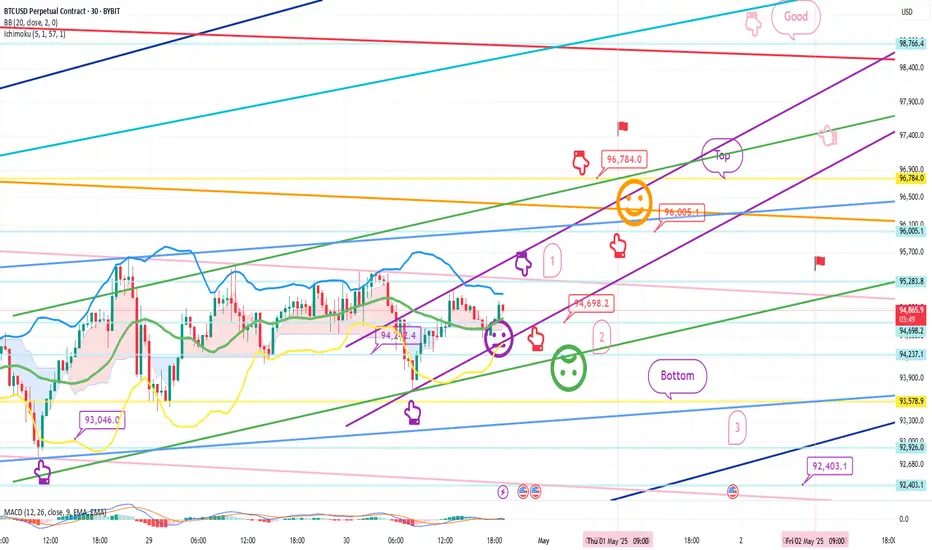
Here is the Bitcoin 30-minute chart.
There will be two Nasdaq indicator announcements at 9:30 and 11:00.
On the lower left, I marked the long position entry section that I entered on the 25th and 29th,
and created today's strategy based on the Nasdaq movement.
*Red finger movement path
Long position strategy
1. 94,698.2 dollar long position entry section / cut-off price when the green support line is broken
2. 95,784 dollar long position 1st target -> Good 2nd target
The 1st and 2nd sections at the top are sideways.
After the 1st touch, in the rising wave, if you enter a 94.6K long position,
the probability of the strategy succeeding increases.
If it comes down right away without touching the 1st section,
The final long position is waiting in the 2nd section, and the stop loss price is the same when the green support line is broken.
When the top section is touched, the long position re-entry utilization section and
I left a simulation with a pink finger on the upper right.
The bottom touch is a downward sideways movement
The 3rd section is the 6+12 support line where the mid-term pattern is restored.
Also, tomorrow is Labor Day,
So all countries around the world, including the US, are closed.
I also have work to do, so I will take a day off tomorrow.
I intentionally left the analysis article on the right until May 2nd.
Up to this point, please just refer to and use my analysis article,
And I hope you operate safely with the principle trading and stop loss price.
Thank you.
Bitcoin Wyckoff Distribution pattern Disclaimer: This is not financial advice. The following is for educational and informational purposes only.
Based on the current 1-hour timeframe, Bitcoin appears to be forming a potential Wyckoff Distribution pattern. If we see a liquidity sweep towards the upside—particularly around the 95,580 to 95,763 levels—and a subsequent bearish confirmation pattern forms on the same timeframe, we could anticipate a possible move down towards the 93,000 support zone.
Should the price fail to hold at that level, a deeper correction towards the 86,000 area could play out in the coming sessions. However, it is important to note that this scenario is valid only if a clear bearish structure forms post-liquidity sweep on the 1-hour chart.
No strategy guarantees 100% accuracy, and market conditions can change rapidly. This is merely a technical outlook and should not be construed as an investment or trading recommendation.

ETHUSDTMultiple confirmations aligning on ETH — already in profit, but this setup has massive potential ahead.
The structure, the momentum, the zones — everything is pointing toward a high-probability move.
I’m already riding this wave, but it looks like it’s just getting started.
Let’s see how far ETH can go from here!
#ETHUSD #CryptoTrading #Ethereum #PriceAction #WizardTrader #SmartMoneyConcepts #TradingSetup #CryptoAnalysis #TechnicalAnalysis #BreakoutTrade #TrendFollowing

Ethereum buy recommended at 1590 ,2360 to 2420 Target How to take trades using Harmonic pattern projection Trade setup is explained below :-
Entry : 1st SL point : 0% is recent top or bottom.
Trailing D: 15.1% is work as trailing SL of buy or sell trade if hit then we have to book profit
.If price goes below 2nd D 22.5% to 24.5% range then early traders can make fresh reversals trade after breaking 1st D 15.1% safe traders can reversal trade after breaking Point D 22.5.4% to 24.5% range
Targets :
Target T1 : 36.1% to 38.3%
Target T3 : 49.1% to 52.5%
T3: 60.9% to 64.8% is our 3rd Target since this is reversal zone so must book profit if break then take fresh trade again
Target T4 : 76.4% to 79.7%
Next Targets are 100% , 127.2% ,141.4% and final Target 161.8%.
How to take reversal trade :
If price going upside/ downside then then buy or sell levels appear on Chart ( Automatically show when price reach any reversal zone of harmonic projection ).
Trailing SL:
After reach 1st Target trail SL to just above or below cost ( for example we are holding sell trade from 100 1st Target 110 hit then move trailing sl to 104-105 and move SL as price move upside or Downside)
Re- Entry :
For Re-entry in any pull back Point D ( 15.1% ) is used for re-entry then SL recent high or low Point SL ( 0% ) .
Blue Line is 1st support/ Resistance
Green line is 2nd support/ resistance
Red line is 3rd Support/ resistance
