Investing:Nifty IT is looking good for long term accumulation!If you have been following the tech related news lately, it has been about the new AI "revolutionary" tool named Anthropic.
And the same is visible on charts of Nifty IT.
TCS is available at a price at which it was trading in December 2020.
Infy has just broke a crucial support.
Wipro has always b
ETF market
iT Crash !! What Next ??💡 Liked the idea?
Then don’t forget to Boost 🚀 it!
Comments are Most Welcome
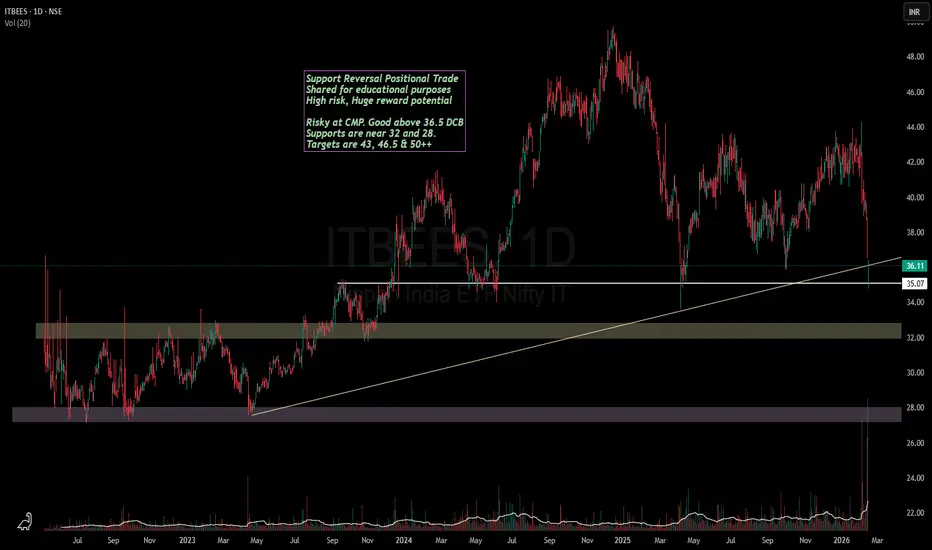
iT Bees
CMP 35.90
Add on Dips till 32.00
SL CLB 28
Tgt upto 49
Maintain TSL & Keeping Booking/Churning as per Moves
For more insights & trade ideas,
📲 Visit my profile and hit Follow
Warm regards,
Naresh G
SEBI Re

TATA GOLD Next StepGold and gold-linked ETFs can be sensitive to:
📉 Short-Term Risks
Profit booking after strong rallies (can cause dips).
Global macro data (e.g., US rate news, dollar strength) affecting gold prices.
Market corrections can continue before new trend emerges.
📈 Short-Term Positives
Safe-haven dem

Eurostoxx remains constructive with bullish consolidation1 Price moved higher first and then shifted into bullish consolidations rather than breaking down
2 Each consolidation formed at a higher level, showing controlled digestion of gains
3 The current phase around 58 to 60 looks calm and orderly, with no visible distribution
4 Silent Flow does not confi

Gold Continues to Shine in the Eyes of Investors
India’s gold exchange-traded funds (ETFs) saw net inflows of $2.49 billion in January 2026, up 98% from December's $1.25 billion, marking the eighth consecutive month of growth.
In 2025, total inflows reached $4.68 billion, a 262% increase from $1.29 billion in 2024; inflows were $310 million in

Semiconductor ETF Ending Diagonal Warning !NASDAQ:SMH Daily Chart is showing an Ending Diagona Pattern🐻⚠️
(which can also become a Head and Shoulders Top)
Semiconductor industry is at risk if the AI Bubble bursts as it would lead to Overcapacity
I wonder what happens then...
all Supercycles end like this don't they📉🩸
Invalidation above

SPY Weekly levels ( 2 Feb - 7 Feb 2026)
Here’s weekly levels for SPY —
1) Bull Case — “Acceptance above equilibrium → reclaim upper rail”
Trigger: Hold above 692.18–692.28, then reclaim and accept above 698.48–698.68.
Targets: 704.98
Stretch (only if momentum persists): 711.28
Notes: The 698.5–698.7 zone is the “decision ceiling.” Clea

ICICI SILVER ETF View for wealth generateIn global market silver is not very right position. So many retailer are entering into the commodity market .
Basically buy on dip for 1-2 years. Technical expectation price will be react 100 in next 3-5 years.
It's a good time to invest.

Silver becomes volatileBull trend ( up-trend) is intact, but we can see Stochastic dip below 50 ( neutral) levels for for the first time since Nov end, indicating loss of strong momentum. MACD shows volatility but up-trend is intact.

SPY | Daily: Buying Volume Moderates Near Resistance, Support-1 Description
Price has recently moved into a resistance zone, where buying volume appears to be moderating, indicating a lack of strong upside follow-through.
Price is currently hovering near Support-1, making this a key level to monitor in the near term.
Technical Observations
Buying volume has

See all popular ideas
Community trends
SymbolPrice & chgNAV total return 1Y
SymbolNAV total return 1Y / Price
SymbolPrice & chgDividend yield FWD
SymbolDividend yield FWD / Price
ETF collections
LargestHighest AUM growthHighest returnsBiggest losersEquityBitcoinEthereumGoldFixed incomeReal estateTotal marketCommoditiesAsset allocationInverseLeveragedMost tradedLargest inflowsLargest outflowsHighest discount to NAVHighest premium to NAVHighest yieldDividendMonthly distributionsHighest diversificationActively managedSectorHighest betaLowest betaNegative betaHighest expense ratioAll-time highAll-time low52-week high52-week lowETFs of the USAETFs of CanadaETFs of the United KingdomETFs of GermanyETFs of JapanETFs of AustraliaSee all