Gold mcx we are holding buy from 113700 ,1600 points profit runnWe are holding buy trade from 113700 from Friday closing , upside target 3855,3910 on comex
How My Harmonic pattern projection Indicator work is explained below :
Recent High or Low :
D-0% is our recent low or high
Profit booking zone ( Early / Risky entry) : D 12.3% -D 16.1 % is
range if break them profit booking start on uptrend or downtrend but only profit booking, trend not changed
SL reversal zone (Safe entry ) : SL 23.1% and SL 25.5% is reversal zone if break then trend reverse and we can take reverse trade
Target : T1, T2, T3, T4 and .
Are our Target zone
Any Upside or downside level will activate only if break 1st level then 2nd will be active if break 2nd then 3rd will be active.
Total we have 7 important level which are support and resistance area
Until , 16% not break uptrend will continue if break then profit booking will start.
If break 25% then fresh downtrend will start then T1, T2,T3 will activate
1,3,5,10,15,20 minutes are short term levels.
30 minutes 60 minutes , 2 hours,3 hours, ... 1 day and 1 week chart positional and long term levels
Futures market

Gold holding buy trade from 3760 , upside target 3855,3910We are holding buy trade from 3760 , upside target 3855,3910
Levels on chart
How My Harmonic pattern projection Indicator work is explained below :
Recent High or Low :
D-0% is our recent low or high
Profit booking zone ( Early / Risky entry) : D 12.3% -D 16.1 % is
range if break them profit booking start on uptrend or downtrend but only profit booking, trend not changed
SL reversal zone (Safe entry ) : SL 23.1% and SL 25.5% is reversal zone if break then trend reverse and we can take reverse trade
Target : T1, T2, T3, T4 and .
Are our Target zone
Any Upside or downside level will activate only if break 1st level then 2nd will be active if break 2nd then 3rd will be active.
Total we have 7 important level which are support and resistance area
Until , 16% not break uptrend will continue if break then profit booking will start.
If break 25% then fresh downtrend will start then T1, T2,T3 will activate
1,3,5,10,15,20 minutes are short term levels.
30 minutes 60 minutes , 2 hours,3 hours, ... 1 day and 1 week chart positional and long term levels

Copper holding buy trade from 946 , 11 points profit running,Copper holding buy trade from 946 ,next target 960,975
Levels provided on chart
How My Harmonic pattern projection Indicator work is explained below :
Recent High or Low :
D-0% is our recent low or high
Profit booking zone ( Early / Risky entry) : D 12.3% -D 16.1 % is
range if break them profit booking start on uptrend or downtrend but only profit booking, trend not changed
SL reversal zone (Safe entry ) : SL 23.1% and SL 25.5% is reversal zone if break then trend reverse and we can take reverse trade
Target : T1, T2, T3, T4 and .
Are our Target zone
Any Upside or downside level will activate only if break 1st level then 2nd will be active if break 2nd then 3rd will be active.
Total we have 7 important level which are support and resistance area
Until , 16% not break uptrend will continue if break then profit booking will start.
If break 25% then fresh downtrend will start then T1, T2,T3 will activate
1,3,5,10,15,20 minutes are short term levels.
30 minutes 60 minutes , 2 hours,3 hours, ... 1 day and 1 week chart positional and long term levels

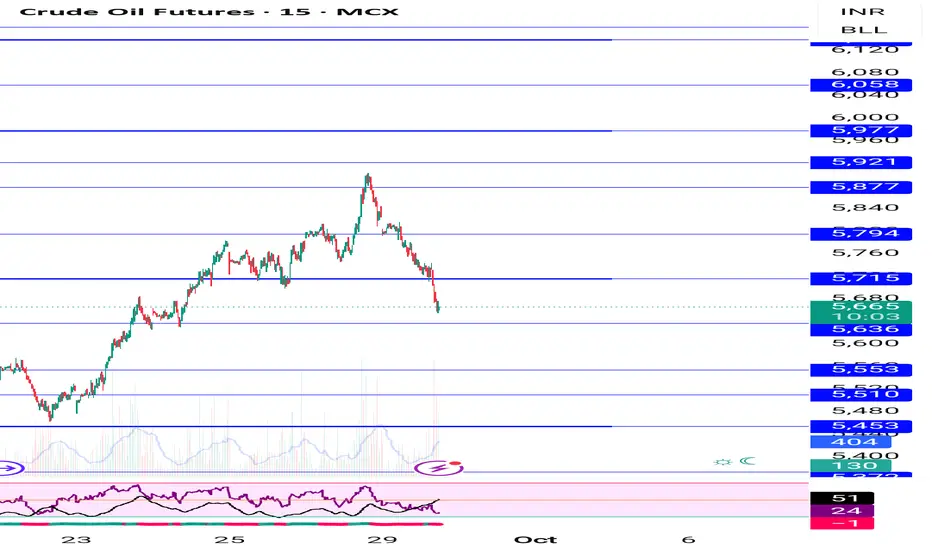
Crude sell Trade given at 5780 5630-5560 next target Crude sell given at 5780 holding sell trade, downside target 5630,5560
How My Harmonic pattern projection Indicator work is explained below :
Recent High or Low :
D-0% is our recent low or high
Profit booking zone ( Early / Risky entry) : D 12.3% -D 16.1 % is
range if break them profit booking start on uptrend or downtrend but only profit booking, trend not changed
SL reversal zone (Safe entry ) : SL 23.1% and SL 25.5% is reversal zone if break then trend reverse and we can take reverse trade
Target : T1, T2, T3, T4 and .
Are our Target zone
Any Upside or downside level will activate only if break 1st level then 2nd will be active if break 2nd then 3rd will be active.
Total we have 7 important level which are support and resistance area
Until , 16% not break uptrend will continue if break then profit booking will start.
If break 25% then fresh downtrend will start then T1, T2,T3 will activate
1,3,5,10,15,20 minutes are short term levels.
30 minutes 60 minutes , 2 hours,3 hours, ... 1 day and 1 week chart positional and long term levels
Part 1 Master Candle Stick Pattern1. Long Call Strategy – Betting on Upside
One of the simplest option strategies is buying a long call. Traders use this when they are bullish but want to risk less capital than buying the stock outright.
Maximum Loss: Limited to premium paid.
Maximum Profit: Unlimited (stock can theoretically rise infinitely).
Best Case: Strong bullish move in underlying.
Worst Case: Stock stagnates or falls, premium decays to zero.
2. Long Put Strategy – Profiting from Downside
Buying a long put is the bearish counterpart to a call. It gives downside protection or speculative profit.
Maximum Loss: Premium paid.
Maximum Profit: Stock can fall to zero.
Use Case: Protecting stock portfolios (hedging).
3. Covered Call Strategy – Income Generation
In a covered call, an investor owns the underlying stock and sells call options against it.
Purpose: Generate extra income through premiums.
Risk: Stock may rise above strike, forcing the seller to sell shares.
Advantage: Provides downside cushion via collected premium.
4. Protective Put – Insurance for Portfolio
Buying a put option while holding stock acts like insurance.
Example: If you own Reliance at ₹2500 and buy a put at ₹2400, your maximum downside risk is capped.
Benefit: Peace of mind in volatile markets.
Cost: Premium, just like an insurance policy.
5. Spreads – Controlling Risk and Cost
Spreads involve combining two or more option positions. Examples:
Bull Call Spread: Buy lower strike call, sell higher strike call.
Bear Put Spread: Buy higher strike put, sell lower strike put.
Advantage: Lower premiums, defined risks.
Disadvantage: Capped profits.
6. Straddles and Strangles – Playing Volatility
When traders expect big moves but are unsure of direction:
Straddle: Buy one call and one put at the same strike and expiry.
Strangle: Buy OTM call + OTM put.
Profit: Large move in either direction.
Risk: Market remains stagnant, premiums decay.
7. Iron Condor and Iron Butterfly – Income from Range-Bound Markets
Advanced strategies like Iron Condor and Butterfly Spread allow traders to profit in low-volatility environments. They involve selling both calls and puts to collect premium, betting that prices stay within a certain range.
These strategies are popular among professional traders who trade based on time decay (Theta).
8. Role of Volatility in Option Pricing
Volatility is the lifeblood of options.
Implied Volatility (IV): Market’s forecast of future volatility.
Historical Volatility (HV): Actual past movement.
Rule: When IV is high, options are expensive. When IV is low, options are cheap.
Trade Insight: Buy options in low IV and sell/write options in high IV.

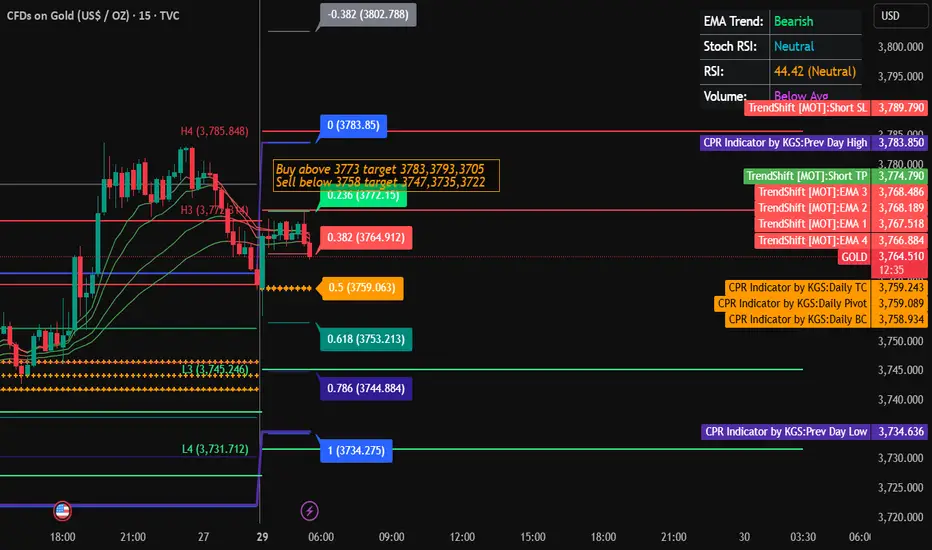
“Gold (XAU/USD) – Breakout Play from Resistance (1-Hour View)Chart Structure & Key Levels
You’ve drawn a resistance zone above current price. The label “this is the resistance area here if break we will hold” points to a horizontal resistance line or zone.
You also show a descending trendline acting as dynamic resistance.
On the lower side, you mark LL (Lower Low) and LH (Lower High) points, implying the prior structure was in a downtrend or consolidation.
Your trade setup (green = target area, red = stop area) suggests you are expecting a break above resistance and a move upward with three target levels:
• TP1 at ~ 3,759.74
• TP2 at ~ 3,779.03
• TP3 at ~ 3,799.67
What Your Setup Implies (and Risks)
Bullish Bias on Breakout
You are expecting that if price breaks above the resistance zone + trendline, that resistance may flip into support, allowing the price to rally further. This is a classic breakout reversal expectation.
If the breakout is confirmed (with strong candle close above, ideally with volume), then the path is “clearer” for your targets.
Stop / Risk Control
Your red zone (stop area) is placed below the resistance/trendline region. If price fails and falls back below this, your trade idea would be invalidated.
Target Levels Logic
TP1 is relatively conservative, just above resistance.
TP2 and TP3 stretch further to capture the upside momentum if the breakout has strength.
Additional Considerations & Technical Tips
Confirm the Breakout
Don’t just enter on a quick wick above resistance. Wait for a sustained close above the zone (on your timeframe) to reduce the chance of a false breakout.
Check volume: higher-than-average volume on the breakout gives it more credibility.
Watch for Retest
Often after a breakout, price returns to retest the broken resistance (which now may act as support). This retest can offer a better entry with lower risk.
Manage Risk Aggressively
The more distant your TP3, the more room for price to reverse. Consider scaling out of the trade (taking partial profits as price hits TP1, TP2) to lock in gains.
Keep an Eye on Macro / Fundamental Factors
Gold (XAU/USD) is sensitive to U.S. monetary policy, the strength of the U.S. dollar, inflation expectations, and geopolitical risk.
For example, stronger U.S. data or hawkish Fed statements could work against a bullish breakout in gold.
Divergences & Momentum Indicators
Use RSI / MACD / ADX to check whether momentum supports your breakout idea. If momentum is weak or showing divergence, be cautious.
Timeframe Alignment
Make sure that higher timeframes (4H, daily) are not giving strong bearish signals conflicting with your breakout bias on the 1-hour chart.

NQ SENTIMENTAL ANALYSIS 29 SEP 25Market Recap & Trade Insight
After the London open, price showed strong one-sided momentum, which was later swept, fueling a sharp bullish move toward all-time highs. From the ATH, a significant retracement unfolded, breaking 5-minute structure and attracting aggressive sellers.
However, when an asset is in ATH mode, sharp reversals often follow such retracements. These setups are best captured with 1-minute confirmations. Using that framework, we executed a precise long entry aimed at taking out the highs.

Daily Gold Trading Plan – London & New York Sessions🏆 Market Overview
Gold continues to hold within the upward channel, with active buying emerging whenever prices adjust to the trendline. The daily fluctuation range is identified around 3,795 – 3,820, suitable for short-term trading strategies based on price action.
🔑 Key Technical Levels
Resistance: 3,819 – 3,826 → upper edge of the upward channel, potential short-term sell zone.
Near Support: 3,790 – 3,793 → upward trendline, favourable buy zone in line with the trend.
Deep Support: 3,760 – 3,752 (EMA200) → critical defence if near support is breached.
⚖️ Intraday Trading Scenarios
Scenario A – Buy on Correction (Main Priority)
Entry Point: 3,790 – 3,793
Stop Loss: below liquidity candle (around 3,785)
Take Profit: 3,820 → 3,835 → extend to 3,840+
👉 Reason: Uptrend dominance, strong buying at trendline, suitable for trend-following.
Scenario B – Sell at Upper Edge (Short-term Scalp)
Entry Point: 3,820 – 3,826 (when price reacts at resistance)
Stop Loss: approximately 6 points (around 3,832)
Take Profit: 3,795 – 3,793 (back to support zone)
👉 Reason: RSI has entered overbought territory, favourable for quick sell orders at the upper band.
📊 Daily Fluctuation Range
Main Range: 3,795 – 3,820
If resistance breaks: 3,826+ → 3,840 – 3,845
If support is lost: 3,790 → 3,760
💡 Session Notes
London: High likelihood of price testing the 3,790 support zone before recovery.
New York: Strong volatility may occur when US data is released, with 3,820 being a critical test point.
🧭 Risk Management
Prioritise buying on corrections, selling should only be short-term scalping.
Maintain stop-loss discipline below 3,785 for buy scenarios.
If price breaks below 3,750, cease buying and wait for a new structure to form.
📌 Conclusion: Throughout the day, gold is likely to continue fluctuating within the upward channel. The main strategy is to buy at support – take profit at resistance, while sell orders should only be executed when price touches the upper edge and should be exited quickly.

XAUUSD – Gold Bulls Eye New Highs | Francis FiboMatrix Plan📊 Market Outlook
Gold keeps climbing with momentum, now approaching the 3,800$ zone. The market is fuelled by expectations of more Fed rate cuts and rising demand for safe-haven assets as global uncertainties stay elevated.
Silver is also breaking higher, heading toward its historic $50 target, confirming the broader strength in precious metals.
📍 Trading Levels
✅ BUY Zone: 3782 – 3780
🛑 Stop Loss: 3772
🎯 Take Profits:
TP1 → 3800
TP2 → 3829
TP3 → 3848
TP4 → 3885+ (long-term hold if 377x holds support)
⚡ Trading Plan
Only look for BUY setups on dips – no shorting in this phase.
Keep position sizing balanced; trail stops once price moves past 3829.
Bias remains bullish as long as gold holds above 377x support.
💡 Francis Note
This is not just a trade – it’s part of the bigger wave. Play the retracements smart, respect risk, and let the trend do the heavy lifting.
💬 Your View?
Is gold ready to break beyond 3,885 → 3,900, or will we get a quick pullback first? Drop your charts and setups below 👇

Double Top in SilverEntry- 143000-143200
Target- 142000, 141500, 141200
SL- Day high
Pattern - Double Top has been made in MCX silver and Comex silver in 1 hr and 15 min time frame.
Disclaimer- This is just for educational purpose.
Jai Shree Ram.

LiamTrading – Gold: Wave 5 isn't over yet...Gold: Wave 5 isn't over yet, awaiting ABC corrective wave
According to Elliott Wave perspective, gold is currently in wave 5 and no clear reversal signals have appeared. Once wave 5 is completed, a reasonable scenario would be entering the ABC corrective phase.
Technical Analysis
The current price range remains in an uptrend, supported by the medium-term trendline.
Key resistance – support zones are identified based on Fibonacci, Volume Profile, and strong psychological levels.
RSI indicates gold is approaching the overbought region, hence short-term Sell orders (scalping) around the peak area might offer an advantage.
Trading Plan Reference
Sell: 3840 – 3842, SL 3846. This is a strong resistance zone, prioritise scalping if the downward reaction lacks strength.
Buy: 3783 – 3785, SL 3779, TP 3800 – 3818 – 3838.
Large liquidity Buy: 3740, SL 3733, expecting a strong reaction from this area due to previous accumulation volume.
Important Note
Early in the week, there are often numerous political – economic news causing noise, which might unexpectedly push gold up.
The resistance zones 3840–3850 are strong psychological levels, observe reactions before making decisions.
For short-term trading, adhere closely to the plan, while flexibly adjusting when price paths change to maintain an advantage.
In summary, wave 5 is still developing and trading opportunities mainly focus on key resistance – support zones. Traders need to manage risks well, patiently wait for confirmation, and remain flexible to adapt to fluctuations.
The DXY index fell around 97.95 on Monday, extending the decline into the second session as the risk of a US government shutdown weakens market sentiment and investors await a series of important economic data to be released this week.
Wishing you successful trading, follow me and the trading community!

New ATH Above 3800 & FOMO Buying Still Driving the Market📊 Market Context
Gold has once again set a new all-time high above 3800 USD/oz, showing no signs of losing bullish momentum. The surge is fueled by strong FOMO buying flows, as traders continue to pile into safe-haven assets.
Concerns about a possible US government shutdown and renewed discussions around tariff policies have weighed on the dollar, while expectations of upcoming Fed rate cuts keep gold supported. Meanwhile, Fed speeches and incoming US data remain key drivers that could inject short-term volatility, but the broader bullish narrative remains intact.
🔎 Technical Analysis (H1/H4)
Price is firmly holding above the 3800 psychological level, confirming the breakout.
Buy zones remain intact at 3790–3792 and 3784–3782, with solid demand expected on any dip.
Sell liquidity sits around 3823–3825, where short-term profit-taking or traps may emerge before the next leg higher.
🔑 Key Levels
Resistance / Sell Zone: 3823–3825
Support / Buy Zones: 3790–3792, 3784–3782
📈 Scenarios & Trading Plan
BUY ZONE 1: 3790–3792
SL: 3786
TP: 3795 - 3800 - 3810 - 3820 - 3830 - ???
BUY ZONE 2: 3784–3782
SL: 3778
TP: 3790 - 3795 - 3800 - 3810 - 3820 - 3830 - 3840 - ???
SELL ZONE (Liquidity Trap Zone): 3823–3825
SL: 3830
TP: 3818 - 3814 - 3810 - 3805 - 3800 - ???
⚠️ Risk Notes
Beware of liquidity sweeps near 3823–3825 before continuation higher.
Fed comments and macro data may cause sudden spikes — adjust risk accordingly.
Stick to confirmation entries around zones to avoid being trapped by false moves.
✅ Summary
Gold is riding strong FOMO-driven bullish momentum, printing new highs above 3800. Main bias: buy on dips at 3790–3782, while monitoring short-term sell liquidity at 3823–3825 for potential pullbacks. The broader trend remains bullish, so patience and disciplined entries will be key.

XAUUSD – Prioritise waiting to buy after gold hits ATHXAUUSD – Prioritise waiting to buy after gold hits ATH, target 3840
Hello Trader,
Right at the start of the week, gold has set a new ATH, affirming the upward trend remains dominant. The price structure on H1 shows buying pressure remains quite strong, while adjustments are mainly to balance liquidity. In the current context, the preferred trading strategy is still to wait to buy at key support zones, with a target towards 3840.
Basic Context
This week, the usual focus would be on the Nonfarm Payrolls (NFP) data. However, the risk of a US Government shutdown might delay this crucial report.
The US fiscal year runs from 1/10 to 30/9. If Congress does not pass all 12 spending bills, agencies without funding will have to cease operations.
In the absence of important economic information, gold continues to benefit from safe-haven sentiment and fiscal policy uncertainty.
Technical View
The price has broken out and created an ATH, with the 3837 – 3840 zone currently being strong resistance (Fibonacci + market psychology).
The 3770 – 3773 zone is near support, coinciding with the trendline and previous liquidity, suitable for buying.
MACD on H1 shows buying momentum is maintained, but a correction is needed for price balance before breaking higher.
Trading Strategy
Short-term Sell (at resistance):
Entry: 3837 – 3840
SL: 3844
TP: 3830 – 3800 – 3770
Note: This is only a reactive order at resistance, going against the main trend, so manage risk tightly.
Preferred Buy (trend-following):
Entry: 3770 – 3773
SL: 3766
TP: 3784 – 3799 – 3810 – 3838
Conclusion
This week, gold still prioritises the Buy strategy at support zones. The main target is towards 3840, an important resistance zone and a benchmark for trend strength. The Sell order is only short-term at resistance, while the main scenario remains waiting for a correction to buy up.
Follow me for short-term scenario updates during the week, especially as news and US fiscal policy changes can significantly impact gold.

Gold Hits Fresh ATH fresh Support at 3790, Bulls Eye 3806 & 3850Gold printed a fresh all time high today and, so far, there are no signs of rejection on higher timeframes. The immediate level to watch on the downside is last week’s high near 3790, which now acts as key support. As long as price holds above this level on a 4H or higher close, bulls remain in control and may attempt a move toward the next resistance zone at 3800–3806, which is aligned with the weekly R1 and psychological round number resistance. A sustained breakout above this zone could open the door for a push toward 3850 (weekly R2). On the flip side, if sellers manage to drag price back below 3790 on a closing basis, we could see a deeper pullback before the next leg higher.

XAUUSD | Neowave AnalysisNamaskaram
Watch the video to understand my view...
following instruments Discussed in the video...
#XAUUSD
#BTCUSD
#NIFTY 50
#BANK NIFTY
FX:XAUUSD OANDA:XAUUSD

Gold | Bitcoin | Nifty | Bank Nifty | Neowave AnalysisNamaskaram Everyone
We have discussed following instruments in this video, if you have any query you can ask in the comments.
#Gold
#Bitcoin
#Nifty
#Bank Nifty
COINBASE:BTCUSD FX:XAUUSD OANDA:XAUUSD NSE:BANKNIFTY NSE:NIFTY

Gold Trading Strategy for 29th September 2025📊 Gold Trading Plan
✨ Buy Setup
🔹 Entry: Buy above the high of the 15-min candle (close above $3773)
🎯 Targets:
1st Target → $3783
2nd Target → $3793
3rd Target → $3805
✨ Sell Setup
🔹 Entry: Sell below the low of the 1-hour candle (close below $3758)
🎯 Targets:
1st Target → $3747
2nd Target → $3735
3rd Target → $3722
⚠️ Risk Management Tips (Novice-Friendly)
Always set a stop-loss (just below/above entry candle).
Trade with small position size if you’re a beginner.
Don’t risk more than 1–2% of your capital per trade.
📌 Disclaimer: This is not financial advice. Trading in commodities, stocks, or forex involves significant risk of loss. Do your own research or consult a financial advisor before making any investment decisions.
💡 Tip for Traders: Stick to your plan. Don’t chase trades outside these levels.
Discipline = Profitability.
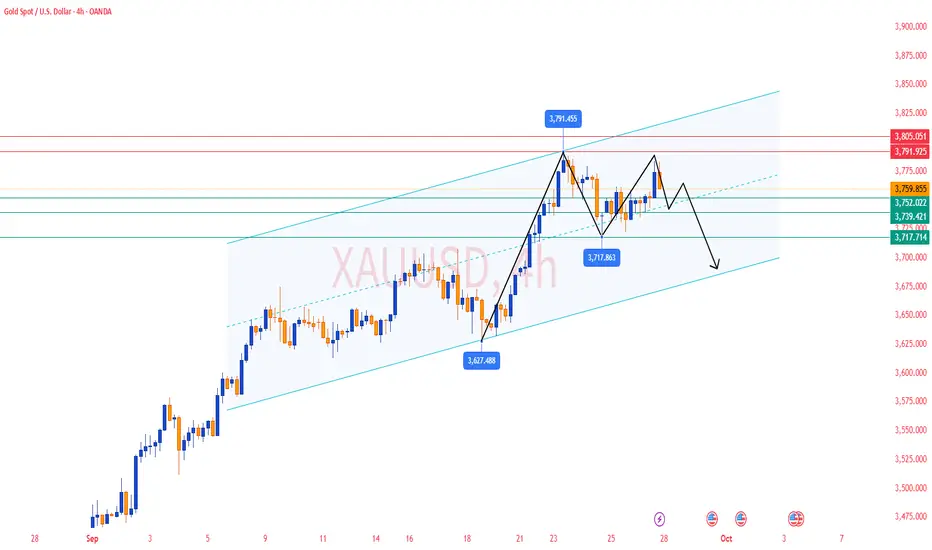
Gold Trading Strategy for next Monday✅ On Friday, gold rose sharply. We had already advised members to go long around the 3748–3752 area, and the price later climbed to as high as 3783. However, during the second half of the U.S. session, gold pulled back without breaking a new high, indicating weakening bullish momentum. The key question now is whether gold still has the strength to refresh its all-time highs or if this was just a temporary spike. Next week will be a critical observation period.
✅ 4-Hour Chart: Gold has broken out of the recent consolidation range, extending its rally toward the historical high near 3791. The 21-period SMA around 3750 provides strong support. If the price holds below 3750, the short-term structure will turn bearish, possibly falling back into the previous range with downside targets at 3720 and 3700. Conversely, a clear breakout above the 3780–3791 resistance zone could unleash new bullish momentum and open the door to further highs.
✅ 1-Hour Chart: Gold is currently trading in a narrow range, with short-term moving averages gradually turning upward. However, if the rebound momentum fades, a potential double-top could form around 3780–3783, leading to short-term pressure. Overall, unless major news triggers a move, gold will likely remain range-bound early next week. Watch 3780 as resistance and 3720 as support.
🔴 Resistance Levels: 3780–3785 / 3791–3795
🟢 Support Levels: 3745–3755 / 3730–3720
✅ Trading Strategy Reference:
🔰 If gold holds above the 3745–3755 support zone, consider light long positions with targets at 3780–3785.
🔰 If gold breaks below 3745–3755, a 4-hour double-top will likely be confirmed. In this case, consider light short positions targeting 3730–3720.
🔰 If gold faces resistance at 3780–3785, short entries can be considered with targets back down to 3745–3730.
🔥Trading Reminder: Trading strategies are time-sensitive, and market conditions can change rapidly. Please adjust your trading plan based on real-time market conditions.
Silver Spot Price Technical Analysis [28-09-2025] Buy on DipsAny Correction Buy on Dips - Silver Spot (XAG/USD) daily chart from (dated 2025.09.27), here’s a technical analysis: The chart indicates a continuation of an uptrend, with the price recently breaking out above a key resistance level around 45.013. This breakout is supported by a strong upward move, suggesting bullish momentum.

I sell according to the game masterwith my idea to prioritize selling down
Because the crowd's expectations are always bullish, to catch the bullish buyers, it needs to go down a corresponding distance.
Previously the price went against plan with the bears expecting it to go to the lower fvg zone.
all of the above makes me feel that price needs to go down and reach svg zone to theoretically not affect the knowledge that has been communicated to everyone.

Gold Spot Price Technical Analysis [28-09-2025]Gold Spot Price Technical Analysis - Based on the chart, the XAU/USD daily chart shows an ascending triangle pattern, which is generally considered a bullish signal. The price is currently near a breakout level around 3435.06, with a potential target near 3900.00 if the upward trend continues. The RSI (14) at 74.53 suggests the asset is in overbought territory, which could indicate a potential pullback or consolidation.

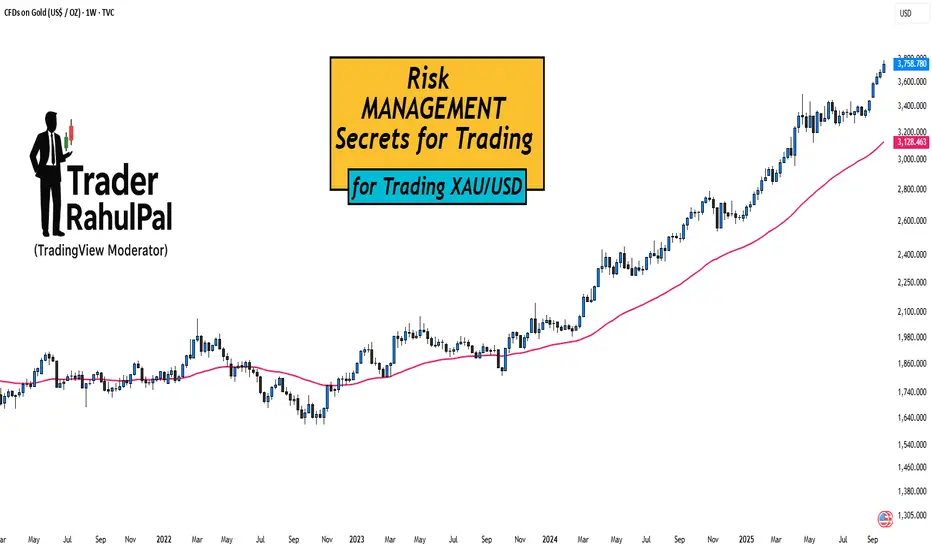
Risk Management Secrets for Trading XAU/USD!Hello Traders!
Gold (XAU/USD) is one of the most rewarding instruments, but also one of the most dangerous if you don’t manage risk properly.
Many traders lose not because their strategy is bad, but because they fail to protect their capital.
Here are some key risk management secrets every gold trader must know.
1. Position Sizing is Everything
Gold moves fast, a $5 move can wipe out accounts if the lot size is too big.
Always calculate position size based on risk per trade (ideally 1–2% of your account).
This way, even if you hit multiple stop losses, your account survives.
2. Wider Stops, Smaller Lots
Gold often spikes and hunts tight stop losses.
Use slightly wider stops, but reduce lot size to balance the risk.
This gives your trade room to breathe without increasing overall risk.
3. Never Trade News Without a Plan
During events like NFP, CPI, or Fed speeches, XAU/USD becomes extremely volatile.
If you’re not experienced, it’s better to stay out.
If you do trade, cut position size and expect slippage.
4. Daily Loss Limit
Decide in advance how much you can lose in one day (for example, 3% of account).
If that limit is hit, stop trading for the day.
This prevents emotional revenge trading, which is the biggest killer in gold trading.
5. Use Partial Profits
Gold reverses quickly, so book partial profits when the trade moves in your favor.
This locks in gains and reduces pressure.
Move stop loss to break-even once part profits are secured.
Rahul’s Tip:
Your job as a trader is not to catch every move, but to stay in the game .
Risk management may feel boring, but it’s the only reason why professional traders survive while retail traders blow up.
Conclusion:
In XAU/USD trading, strategy decides entries, but risk management decides survival.
By controlling lot size, stops, and emotions, you can make gold work for you instead of against you.
If this post helped you see risk management in a new light, like it, drop your thoughts in comments, and follow for more trading wisdom!
Gold awaits PCE | EMA squeeze, big waves ahead🟡 XAU/USD – 26/09 | Captain Vincent ⚓
🔎 Captain’s Log – Context & News
Trump : Announced a 100% tariff on branded drugs if not produced in the US → escalating trade tensions.
PCE tonight : The FED’s most important inflation gauge, key to shaping October rate cut expectations (current probability 91.09%).
The market is in “hold breath” mode, awaiting the PCE spark to decide the next direction.
⏩ Captain’s Summary : Gold is squeezed between two winds – short-term EMA pressure and major expectations from PCE.
📈 Captain’s Chart – Technical Analysis
EMA : EMA 34 (yellow) remains below EMA 89 (red) → short-term bearish pressure persists, but narrowing gap signals big volatility ahead.
Golden Harbor (Support / Buy Zone)
3,738 – 3,730
3,718
3,687
3,651
Storm Breaker (Resistance / Sell Zone)
3,755 – 3,773
🎯 Captain’s Map – Trade Plan
⚡ Sell (scalp at resistance)
Entry: 3,773 – 3,776
SL: 3,783
TP: 3,755 – 3,745 – 3,734
✅ Buy (trend-follow priority)
Buy Zone 1 (Scalping)
Entry: 3,72x – 3,718
SL: 3,710
TP: 3,750 – 3,769 – 3,776
Buy Zone 2 (Deeper OB)
Entry: 3,685 – 3,683
SL: 3,675
TP: 3,690 – 3,695 – 3,700 – 3,705 – 3,7xx
⚓ Captain’s Note
“The Golden sails are being squeezed between EMA 34 & 89. Golden Harbor 🏝️ (3,734 – 3,683) remains the safe dock for sailors to await the big wave. Storm Breaker 🌊 (3,773 – 3,776) is raising fierce waves, only suitable for short Quick Boarding 🚤 scalps. Tonight’s PCE will be the decisive wind – either pushing the ship beyond 3,78x or forcing it back to retest 3,72x.”
📢 If you find Captain’s Log useful, don’t forget to Follow for the latest updates.
💬 What do you think? Will Gold break through 3,78x or retest 3,72x first?
