XAUUSD / GOLD / GC Analysis 01-OCT-2025LTP 3863
Supports: 3355/3110/2721/1921
As long as Gold supported by the above levels, we can see 3991-4385 next.
Bigger picture targets: 3748(done)-3991-4385 (Min target)
Further targets:
4934
5420-5655-6036 (Normal target)
7082-7334-8116 (ultimate target)
Extension 11225.
NOTE: I expect big correction between 3748-3991-4385 levels to 3355-3110-2721 before next bull run towards 5K+.
BUY ON DIPS VIEW
Futures market

XAUUSD – US Government Shutdown Pressure on Gold
Hello Traders,
For the first time since 2018, the US Government is facing the risk of a shutdown. This can only be avoided if Congress passes new funding legislation, but the timing remains uncertain. This political backdrop is exerting strong pressure on the financial markets, and gold – the traditional safe haven asset – has become the focal point for investors.
Technical Outlook
Gold continues to set new ATHs right in the Asian session today, indicating the uptrend remains intact.
The upward price channel on H4 maintains a beautiful structure, with the main trend continuing to favour buying.
Yesterday's dip was merely a "liquidity sweep," after which the price quickly returned to its upward momentum.
Short positions can be considered when the price hits strong resistance, combining Fibonacci + Trendline, to optimise winning probabilities.
Trading Scenario
Sell (short-term at resistance):
Entry: 3884 – 3886
SL: 3890
TP: 3872 – 3860 – 3845 – 3830
Buy (aligning with the main trend):
Entry: 3820 – 3823
SL: 3816
TP: 3835 – 3850 – 3862 – 3880
Conclusion
Gold remains strongly supported by the political instability in the US.
The medium-term strategy continues to prioritise Buying at support zones, while Selling should only be considered when there is a clear reaction at resistance zones.
Traders need to closely monitor political news, as any developments related to the US government could alter the short-term structure of gold.
Follow me for the quickest updates on new scenarios as the price path changes.

LiamTrading – Follow the Buy trend, target ATH 3915
The gold market continues to demonstrate the strength of an upward trend. After yesterday's shakeout, we witnessed a very clear Long Squeeze: all buying forces were forced to exit, but immediately after, the price quickly rebounded. This is the hallmark of a strong trend – the more it shakes out, the more momentum it creates for a new peak.
Today's perspective:
Continue to follow Buy, do not SELL against the trend.
The Buy position from 3797 is still being held, if the price returns to retest, we will continue to add orders.
Prioritise observing the POC of the Volume Profile to place Buy orders; if the price adjusts deeper, the VAL area coinciding with the rising trendline will be an extremely safe buying point.
Trading scenario
Buy 3847–3844, SL 3840, TP 3868 – 3880 – 3900 – 3915
Buy 3821–3819, SL 3814, TP 3835 – 3850 – 3868 – open
In summary: The upward trend remains extremely strong, the short-term target is ATH 3915. Stick to the trend, prioritise Buy to maximise profits.
This is my personal view on XAUUSD. Please follow the scenario and stay tuned for my updates.

LiamTrading – Gold continues to be “crazy”LiamTrading – Gold continues to be “crazy”: Strong trend, but awaiting reaction at 3900
Gold has just recorded its 39th all-time high in 2025, now approaching the 3,900 USD/oz mark. This is not only a significant psychological threshold but also coincides with extended Fibonacci levels, making this area a sensitive point in the market.
Trend & Trendline
On the H4 chart, gold remains firmly within the upward channel formed since early September. The price continuously bounces off the lower trendline and expands its range towards the upper boundary.
The lower trendline around 3760–3780 acts as a dynamic support. If the price breaks below this area, a deeper correction scenario towards 3720–3730 will be triggered.
The upper trendline is currently “pressing” the price right at the 3897–3900 area, confluencing with the 2.618 Fibonacci. This is a strong resistance, potentially causing profit-taking reactions and creating a technical pullback.
Volume Profile & Liquidity
The 3800 and 3720 areas are dense volume clusters, indicating significant capital is positioned here. These are also potential Buy zones when the price corrects.
The 3640–3650 area is a larger liquidity cluster, but will only be activated if a strong breakdown occurs from the current trendline.
Reference Trading Scenarios
Sell zone: 3897 – 3900, SL 3905, TP 3885 – 3862 – 3850 – 3833
Short-term Buy zone: 3797 – 3800, SL 3793, TP 3822 – 3840 – 3855 – 3872 – 3890
Medium-term Buy: 3720 – 3730, SL 3710, TP 3760 – 3800 – 3850
Conclusion
The upward trend remains very strong, but the 3897–3900 area will be a crucial challenge. If the price is rejected here, we might witness a correction back to the lower trendline before gold continues towards the larger target of 4000 USD.
This is my personal view on XAUUSD. Please manage risks carefully and stay updated with the latest scenarios.

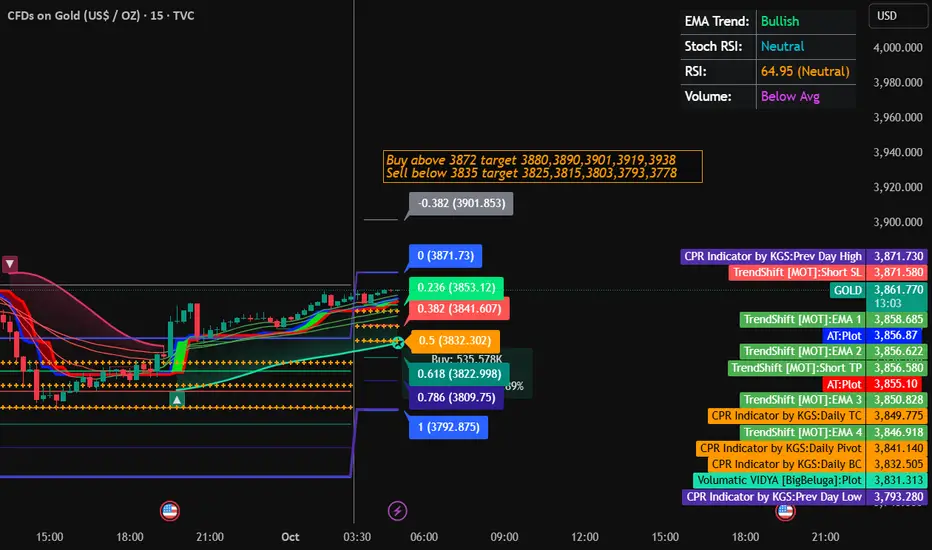
Gold Trading Strtegy for 01st October 2025📈✨ Gold Trading Setup (XAU/USD)
🔑 Buy Setup
✅ Buy above the high of the 1-hour candle if price closes above $3872
🎯 Targets: $3880,$3890,$3901,$3919,$3938
🔑 Sell Setup
✅ Sell below the low of the 1-hour candle if price closes below $3835
🎯 Targets:$3825,$3815,$3803,$3793,$3778
⚠️ Risk Management
Always use a Stop-Loss (SL) to protect capital.
Recommended SL for buys: just below $3865.
Recommended SL for sells: just above $3845.
Do not risk more than 1–2% of your capital per trade.
📌 Additional Notes
This setup is based on 1-hour candle close confirmation.
Patience is key – wait for the candle to close above/below levels before entering.
Manage trades by booking partial profits at each target 🎯 and trailing SL.
⚖️ Disclaimer
📌 This is not financial advice. Trading gold (XAU/USD), forex, or commodities involves significant risk and may not be suitable for all investors.
💰 Prices are highly volatile and can move quickly against your position.
🧾 Always do your own research (DYOR), consult with a professional financial advisor, and trade responsibly.
Buy UsOil Again as previously discussed my long position with low SL we will see this is a big trade and low risk trade

Gold Trading Strategy | October 1✅ 4-Hour Chart Analysis
Gold surged to 3871 before pulling back sharply, showing strong resistance at that level.
Support was found in the 3790–3800 zone, followed by a rebound. Currently, the candlesticks are fluctuating above the mid-band (around 3837), but remain capped by the upper band at 3855–3860.
The MACD histogram has contracted significantly, indicating weakening bullish momentum and stronger pressure at the highs.
The 4-hour chart shows gold is still in a high-level consolidation range, with strong resistance above and solid support below, reflecting clear range-bound characteristics.
✅ 1-Hour Chart Analysis
The MA5 has crossed above the MA10 again, showing short-term stabilization.
The Bollinger Bands are narrowing, with price trading above the mid-band, signaling a short-term consolidation pattern.
The MACD histogram is shrinking, showing that bearish momentum is weakening and bulls may gradually recover.
🔴 Resistance Levels: 3855–3860 / 3870–3872
🟢 Support Levels: 3825–3830 / 3790–3800
✅ Trading Strategy Reference
🔰 If gold faces resistance around 3855–3860 and fails to break through, consider short positions with targets at 3830–3825, and further down to 3800 if broken. Stop-loss above 3872.
🔰 If price pulls back to 3825–3830 and finds support, light long positions can be considered with targets at 3855–3860. Stop-loss below 3815.
🔰 If price breaks above 3872 effectively and holds, it could open the door for further upside. Light long positions may be taken with targets at 3890–3900.
✅ Conclusion
Gold is currently fluctuating within the 3800–3870 range, with a short-term bias toward rebound recovery but facing clear resistance above. Trading is best approached with a range-bound strategy (sell highs, buy lows) as the main plan, and breakout-following as secondary, while strictly controlling stop-loss levels.

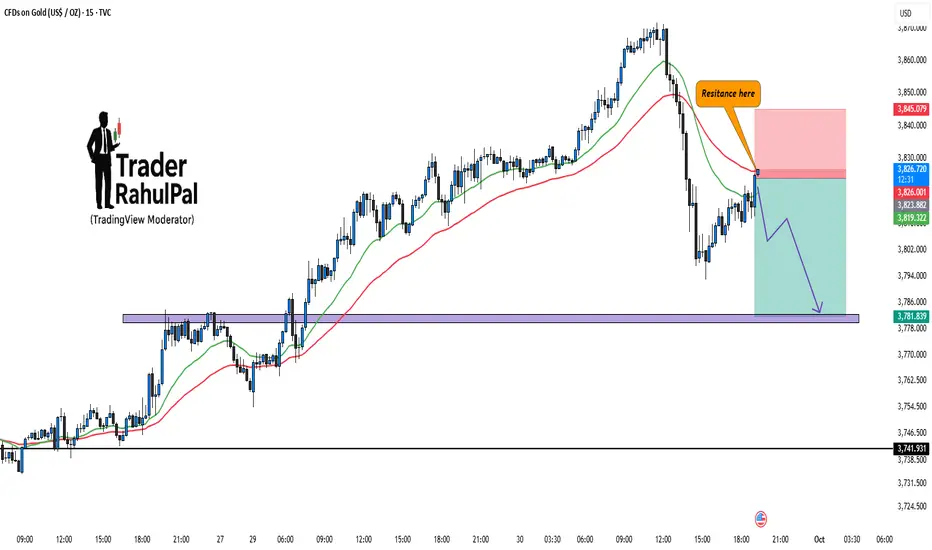
Gold – Resistance at 3840, Contra Move in Play?Gold has approached the 3825 and at high around 3840 resistance zone where sellers are likely to step in. Price rejection from this area can trigger a downside move toward the 3775–3780 support zone.
Currently, the setup favors a contra play, with risk defined above the resistance zone and reward potential aligning with the lower support.
Disclaimer: This analysis is for educational purposes only and should not be considered financial advice. Please do your own research or consult your financial advisor before trading.
XAUUSD – Gold Daily Plan | Sharp Drop, What’s Next?Gold printed a sudden 70+ point drop from 388x to 380x, leaving traders questioning:
– Was this a big player manipulation?
– Or simply institutional profit taking?
Key reaction zones will define if Gold holds above 3800 or dives deeper.
📍 Critical Levels
🔴 SELL Reaction Zone
387x → Strong resistance where sellers may step in.
🟢 BUY Zones
3780 (Retest Breakout + Trendline) → First demand zone.
375x (Fibo Support Zone) → Strong liquidity pocket, potential reversal.
🎯 Trading Scenarios
1️⃣ SELL Idea
Entry: 387x
Targets: 3800 → 3780
SL: Above 3888
2️⃣ BUY Idea
Entry: 3780 – 375x
Targets: 3838 → 387x
SL: Below 3745
⚡ Trading Notes
High volatility expected near 3800 psychological mark.
Stick to zone trading – avoid mid-range traps.
Monitor USD strength; any spike could pressure XAU further.
💬 Discussion
Do you think Gold will break below 3800 or bounce back to test 387x? Drop your views 👇

The Unstoppable Rise of GoldTechnical Analysis (XAU/USD):
Gold is trading around $3,816, showing continued bullish strength along the upward trend line. Price has respected higher lows, confirming buyers remain in control. Key short-term support levels are visible at $3,797, $3,759, and $3,718. As long as price stays above the $3,718 zone (major support), the bullish structure remains intact.
The chart indicates two bullish scenarios:
A direct continuation higher from current levels.
A potential retest of the $3,797 – $3,759 zone before another push upward.
Upside targets in the coming sessions stand between $3,860 – $3,900, with further momentum potentially extending beyond $3,925.
Fundamental Analysis:
Safe-Haven Demand: Persistent geopolitical uncertainties and global economic slowdown fears are keeping gold attractive as a safe-haven asset.
Central Bank Policies: If the Fed maintains a dovish stance or signals rate cuts, real yields may decline, further boosting gold.
Inflation Hedge: Despite cooling in some regions, sticky inflation supports long-term gold demand.
Central Bank Purchases: Record gold buying by global central banks continues to provide a solid floor under prices.
Conclusion:
Gold remains in a strong bullish phase, with technicals showing steady upward momentum and fundamentals reinforcing demand. Any dips toward $3,759–$3,718 may offer buying opportunities as long as the trendline holds, while the broader outlook points toward further gains.

Part 1 Ride The Big Moves1. Introduction to Options
An option is a financial contract that gives the buyer the right, but not the obligation, to buy or sell an underlying asset at a predetermined price, called the strike price, before or on a specified expiration date. Unlike stocks, options do not represent ownership in a company; instead, they are derivatives whose value is derived from the underlying asset (stocks, indices, commodities, or currencies).
There are two primary types of options:
Call Option: Grants the holder the right to buy the underlying asset at the strike price.
Put Option: Grants the holder the right to sell the underlying asset at the strike price.
Options can be American style (exercisable any time before expiration) or European style (exercisable only on the expiration date).
2. Key Terminology in Options Trading
To trade options effectively, you must understand the key terms:
Strike Price (Exercise Price): The price at which the underlying asset can be bought (call) or sold (put).
Premium: The cost of buying an option. Determined by factors like intrinsic value, time to expiration, volatility, and interest rates.
Expiration Date: The date on which the option contract becomes invalid.
In-the-Money (ITM): A call option is ITM if the stock price > strike price; a put is ITM if stock price < strike price.
Out-of-the-Money (OTM): A call option is OTM if the stock price < strike price; a put is OTM if stock price > strike price.
At-the-Money (ATM): The stock price is approximately equal to the strike price.
3. How Options Work
Options allow investors to control a larger number of shares with relatively small capital. Let’s look at an example:
Example:
Stock price of XYZ Ltd.: ₹1,000
Call option strike price: ₹1,050
Premium: ₹50
Expiration: 1 month
If the stock rises to ₹1,200, the call option holder can exercise the option, buy at ₹1,050, and sell at ₹1,200, making a profit of ₹150 per share (minus the premium of ₹50, net profit = ₹100).
If the stock stays below ₹1,050, the option expires worthless, and the loss is limited to the premium paid.
This limited-loss feature makes options attractive for hedging.
4. Participants in Options Market
Options trading involves different market participants with varying objectives:
Hedgers: Use options to protect their existing investments from adverse price movements. For example, a stock investor buys a put option to safeguard against a potential fall in stock price.
Speculators: Seek profit from price movements without owning the underlying asset. They take higher risk for potentially higher rewards.
Arbitrageurs: Exploit price discrepancies between options and the underlying assets to earn risk-free profits.
5. Option Pricing Models
Option pricing is critical for traders. The two most commonly used models are:
Black-Scholes Model (for European options):
It calculates the theoretical value of options using factors such as stock price, strike price, time to expiration, volatility, and risk-free interest rate.
Binomial Model:
Uses a step-by-step approach to evaluate options, useful for American options due to their early-exercise feature.
Factors Affecting Option Premiums:
Intrinsic Value: Difference between the underlying price and strike price.
Time Value: Additional value due to remaining time until expiration.
Volatility: Higher volatility increases premiums.
Interest Rates and Dividends: Can influence option pricing.

Gold shatters 3800 — momentum is alive🚀 XAUUSD – Daily Plan
New ATH Above 3800 & FOMO Buying Still Driving the Market | MMFLOW TRADING
📊 Market Context
Gold has once again surged to a new all-time high above 3800 USD/oz, with bullish momentum still intact.
Concerns over a potential US government shutdown and renewed tariff discussions have weighed on the dollar.
Market expectations of imminent Fed rate cuts continue to underpin gold.
Fed speeches and incoming US data remain short-term catalysts for volatility, but the broader bias stays bullish.
🔎 Technical Analysis (H1/H4)
Primary Trend: Strongly bullish – confirmed by Break of Structure (BOS) + Market Structure Shift (MSS).
OBB Buy Zone: 3787 – 3784, aligning with the 0.5–0.618 Fibonacci retracement, offering strong demand support.
Sell Liquidity: Clustered around 3840–3843 (FE 1.618), where short-term profit-taking or liquidity traps are likely.
🔑 Key Levels
Resistance / Sell Zone: 3840 – 3843
Support / Buy Zone: 3787 – 3784 (OBB)
📈 Trading Scenarios
✅ BUY SETUP
Buy Zone: 3787 – 3784 (OBB)
SL: 3779
TP: 3795 → 3800 → 3810 → 3820 → 3830
✔️ SELL SETUP (Liquidity Trap / Short-term Countertrend)
Sell Zone: 3840 – 3843 (FE 1.618)
SL: 3848
TP: 3830 → 3820 → 3810 → 3800
📌 Notes
Focus remains on buying dips in line with the dominant uptrend.
Short-term sells are only tactical plays within the liquidity zone (3840+).
Risk management is essential, as extended FOMO flows may drive price beyond targets.

Market just swept stoploss – time for the next 1000 pips BUY📊 Trading Plan for Today
Main Trend: Gold has broken structure (BOS) and built strong bullish momentum. The recent sharp drop was a stoploss sweep – a liquidity grab before the next leg up.
Buy Zone:
CP Order Buy Zone: 3786 – 3784
Stop Loss: 3779
Targets (TP):
Short-term: 3820 – 3840 (Fib 1.0 – 1.272)
Long-term: 3870 – 3880 (Fib 1.618)
💡 Market Psychology
The sell-off flushed weak hands (stop hunts).
Liquidity is collected → 3786–3784 becomes a strategic buy zone.
Holding above this zone may trigger a 1000 pips bullish wave.

Gold 30/09 - Safe-haven flows surge | Gold sails toward new ATH 🟡 XAU/USD – 30/09 | Captain Vincent ⚓
🔎 Captain’s Log – Context & News
US Politics : Meeting between Trump and bipartisan leaders ended without agreement → growing risk of a US government shutdown by Wednesday.
Conflict : Democrats demand concessions, Republicans fiercely oppose → wide gap remains, both sides blaming each other.
Market : Investors watch JOLTS data and speeches from 3 FED members, but political risks are the strongest catalyst for Gold.
Trend : Safe-haven flows keep pouring into Gold → increasing likelihood of testing new ATH.
⏩ Captain’s Summary : US political seas are stormy, Gold becomes the fortress of safety. The voyage toward ATH is widening.
📈 Captain’s Chart – Technical Analysis (H1)
EMA : EMA 34 (yellow) > EMA 89 (red) → bullish trend clearly dominant.
Golden Harbor (Support / Buy Zone)
Big Volume Dock: 3,827
Storm Breaker (Resistance / Sell Zone)
ATH test: 3,916 – 3,917
Market Structure : Gold broke out strongly, now trading around 3,870. Main trend remains bullish, with 3,842 – 3,827 as key anchor zones.
🎯 Captain’s Map – Trade Plan
✅ Buy (main priority)
Buy Zone 2 – Big Volume
Entry: 3,827 – 3,824
SL: 3,815
TP: 3,870 – 3,899 – 3,916
⚡ Sell (short scalp – high risk)
Sell Zone – ATH test
Entry: 3,917 – 3,920
SL: 3,925
TP: 3,899 – 3,870 – 3,856
⚓ Captain’s Note
“The Golden sails are filled by safe-haven winds, pushing the ship close to ATH. Golden Harbor 🏝️ (3,842 – 3,827) is the ideal dock for sailors to position Buys. Storm Breaker 🌊 (3,916 – 3,920) may unleash violent waves, suitable only for short Quick Boarding 🚤 scalps. If the political storm from Washington breaks out, Gold’s voyage could surpass the peak and expand its horizon.”
📢 If you find the Captain’s Log useful, don’t forget to Follow for the earliest updates.
💬 What’s your view, crew? Will Gold conquer ATH around 3,917 this week?

Gold Bulls in Control: Buy Zones Lined Up for the Breakout!📊 Market Context
Gold is trading near record highs around $3,850, heading toward its best month in 14 years. With Q3 2025 and September closing, gold has surged nearly 12% this month, driven by rising safe-haven demand amid the looming U.S. government shutdown and weaker USD sentiment.
The bullish structure remains intact, and dips continue to attract aggressive buyers.
📍 Key Trading Levels
🟢 BUY Zones
3846 – 3843 → Intraday BUY scalp zone
SL: 3836
TP: 1R → 2R → 3R → 4R (hold longer if above 389x)
3818 – 3816 → Deeper reaction BUY zone
SL: 3810
TP: 1R → 2R → 3R → 4R (limit orders can be set for extended swing positions)
🔴 SELL Reaction Zone
Around 387x → Expect heavy profit-taking and short-term pullbacks.
🎯 Trade Plan
Prioritize BUY setups only; gold remains in strong bullish momentum.
Use the 384x zone for scalps and 381x zone for deeper limit buys.
Trail stops once price breaks 389x, opening room for 3920+ targets.
⚡ Trading Notes
Volatility may spike with U.S. political risks – manage positions carefully.
Avoid chasing highs; wait for structured retracements to BUY zones.
Stick to R/R discipline; market rewards patience in strong trends.
💬 Community Insight
Do you think gold will smash through 3920+ this week, or will we get another retracement first? Drop your setups and let’s compare strategies 👇

Thematic and Sectoral Rotation Trading1. Introduction
In financial markets, investors and traders are continuously seeking methods to maximize returns while managing risk. Among the myriad strategies, thematic and sectoral rotation trading has gained immense popularity because it aligns investment decisions with evolving economic trends, technological advancements, and market cycles. Unlike traditional strategies that might focus purely on individual securities, sectoral and thematic approaches leverage broader economic patterns, industry performance, and market sentiment.
At its core, sectoral rotation involves shifting capital from one industry sector to another based on their performance in different phases of the economic cycle. Thematic trading, meanwhile, focuses on investing in specific themes or trends, such as renewable energy, digitalization, or electric vehicles, which have potential long-term growth driven by structural shifts in society and the economy.
Understanding these strategies requires a deep dive into economic cycles, market behavior, sector dynamics, and thematic trends.
2. Concept of Sectoral Rotation Trading
2.1 Definition
Sectoral rotation trading is a strategy where investors systematically move investments between sectors to capitalize on varying performances of sectors during different phases of the economic cycle.
2.2 Rationale
Different sectors perform differently depending on macroeconomic conditions. For example:
Early economic recovery: Cyclical sectors like consumer discretionary and technology often lead.
Economic expansion: Industrial and capital goods sectors see strong growth.
Late-stage expansion: Defensive sectors like healthcare, utilities, and consumer staples tend to outperform.
Recession: Safe-haven sectors such as utilities and healthcare gain attention due to lower volatility.
This rotation is based on the understanding that capital flows dynamically between sectors to optimize returns based on economic conditions.
2.3 Sector Classification
Sectors are typically classified into:
Cyclical sectors: Highly sensitive to economic cycles (e.g., consumer discretionary, industrials, technology).
Defensive sectors: Less sensitive to economic cycles (e.g., utilities, healthcare, consumer staples).
Financial sectors: Banks and insurance, which are influenced by interest rate policies.
Commodity sectors: Energy, materials, metals, and mining.
3. Concept of Thematic Trading
3.1 Definition
Thematic trading is investing in broader trends or megatrends that transcend individual sectors. Unlike sectoral trading, themes are based on structural changes in society, technology, or regulations, rather than the economic cycle alone.
3.2 Examples of Themes
Some of the most prominent themes include:
Renewable Energy: Solar, wind, and battery storage companies.
Electric Vehicles (EVs): EV manufacturers, battery producers, and charging infrastructure.
Artificial Intelligence (AI) & Automation: AI software, robotics, and automation solutions.
Healthcare Innovation: Biotech, genomics, telemedicine.
Digital Transformation: Cloud computing, cybersecurity, e-commerce platforms.
3.3 Advantages
Exposure to long-term structural growth.
Diversification beyond traditional sector boundaries.
Ability to capitalize on global megatrends.
4. Key Differences Between Sectoral and Thematic Trading
Feature Sectoral Rotation Trading Thematic Trading
Basis Economic cycles and sector performance Structural trends or megatrends
Time Horizon Medium-term to short-term Medium-term to long-term
Focus Sector performance Specific themes cutting across sectors
Risk Profile Moderately lower if diversified across sectors Can be higher due to concentration in themes
Performance Drivers GDP growth, interest rates, inflation Technological innovation, regulatory changes, societal shifts
Examples Shifting from energy to technology during recovery Investing in EV and renewable energy stocks
5. Economic Cycle and Sector Rotation
The sectoral rotation strategy is closely tied to the economic cycle, which can be divided into four phases:
5.1 Early Recovery
Characteristics: Low interest rates, improving GDP, rising consumer confidence.
Outperforming sectors: Cyclical sectors like consumer discretionary, technology, and industrials.
Trading strategy: Rotate capital from defensive sectors to high-growth cyclical sectors.
5.2 Economic Expansion
Characteristics: High consumer spending, rising corporate profits.
Outperforming sectors: Industrials, financials, materials.
Trading strategy: Increase exposure to sectors benefiting from rising demand and investments.
5.3 Late-Stage Expansion
Characteristics: Slowing growth, inflation concerns, peak corporate earnings.
Outperforming sectors: Defensive sectors such as healthcare, utilities, and consumer staples.
Trading strategy: Shift from high-risk cyclical sectors to low-volatility defensive sectors.
5.4 Recession
Characteristics: Declining GDP, falling corporate profits, rising unemployment.
Outperforming sectors: Utilities, healthcare, consumer staples (defensive sectors).
Trading strategy: Reduce exposure to cyclical sectors and allocate to defensive sectors for capital preservation.
6. Key Indicators for Sectoral Rotation
Traders often use a combination of macro indicators, technical analysis, and sector-specific metrics to guide rotation strategies.
6.1 Economic Indicators
GDP growth
Inflation rate
Interest rates
Consumer confidence
Industrial production
6.2 Market Indicators
Relative strength of sector indices
Sector ETF flows
Price-to-earnings (P/E) ratios
Moving averages and technical trends
6.3 Sector-Specific Metrics
Financials: Net interest margin, credit growth
Technology: Revenue growth, R&D expenditure
Energy: Oil prices, renewable capacity growth
Consumer: Retail sales, brand performance
7. Tools and Instruments for Sectoral Rotation
Sectoral rotation strategies can be executed through multiple instruments:
Sector ETFs: Exchange-Traded Funds representing specific sectors (e.g., technology, healthcare).
Mutual Funds: Sector-specific funds for active management.
Stocks: Direct investment in companies leading their respective sectors.
Options and Futures: Derivatives to hedge or leverage sector exposure.
8. Advantages of Sectoral Rotation Trading
Optimized Returns: Capitalizes on outperforming sectors during different phases.
Diversification: Reduces risk by not being tied to a single sector.
Tactical Flexibility: Can adjust quickly to macroeconomic changes.
Evidence-Based: Relies on historical patterns of sector performance.
9. Risks of Sectoral Rotation Trading
Timing Risk: Misjudging the start or end of a sector’s cycle can lead to losses.
Concentration Risk: Overweighting a sector exposes the portfolio to sector-specific downturns.
Market Volatility: Rapid market changes can disrupt rotation strategy.
Transaction Costs: Frequent trading may increase costs, reducing net returns.
10. Conclusion
Thematic and sectoral rotation trading is a powerful approach to optimizing returns by leveraging macroeconomic cycles and long-term structural trends. While sectoral rotation aligns with the economic phases to identify cyclical and defensive opportunities, thematic trading focuses on long-term megatrends that cut across sectors and markets.
Both strategies require:
Thorough research
Economic and market analysis
Risk management
When implemented correctly, these approaches can help traders and investors maximize growth, diversify risk, and stay ahead of market trends. Integrating sectoral and thematic approaches provides a robust portfolio strategy that captures cyclical performance while riding long-term structural growth trends.
Gold Market Analysis & Trading Plan
📌 Macro Background
Gold prices continue to receive support from the decline in US interest rates and the weakening of the USD.
The DXY index decreased by 0.27% to 97.91, reducing the strength of the greenback.
The 10-year US Treasury yield fell by 3 basis points to 4.141%.
Real yield decreased to 1.761%, providing support for gold as the opportunity cost of holding gold is lower.
These factors reinforce the upward trend, although in the short term, gold may still experience adjustments to attract more capital flow.
📈 Technical Structure
The H4 frame shows that gold is maintaining a strong upward momentum, however, the RSI has moved deeply into the overbought zone.
⚖️ Trading Scenarios
🔴 Scenario 1 – Sell Scalping
Entry: 3,879 – 3,882
SL: 3,890
TP: 3,865 → 3,850 → 3,836 → 3,810
👉 Suitable for short-term orders when the price reacts at high resistance.
🟢 Scenario 2 – Buy Zone 1
Entry: 3,805 – 3,808
SL: 3,799
TP: 3,822 → 3,840 → 3,873 → 3,898
👉 Buy in line with the main trend when the price adjusts to the nearby support zone.
🟢 Scenario 3 – Buy Zone 2 (Deeper Support)
Entry: 3,745 – 3,742
SL: 3,735
TP: 3,765 → 3,780 → 3,798 → 3,820 → 3,850
👉 This is a value buy zone if the market adjusts strongly, suitable for short swings.
📊 Summary
The major trend of gold remains bullish, supported by the weakening USD and declining US yields.
In the short term, be aware of the potential for technical adjustments from the resistance 3,879 – 3,882.
Priority strategy: Buy on adjustments, Sell only for quick scalping.
📌 Note: Strict capital management, adhere to stop-loss to preserve profits when unexpected fluctuations from US news occur.

Elliott Wave Analysis XAUUSD – September 30, 2025📊
________________________________________
🔥 Momentum
• D1 timeframe:
Momentum is currently bullish. We have 3 consecutive bullish candles so far, meaning there may be only 1–2 more daily candles before momentum reaches the overbought zone → risk of reversal.
• H4 timeframe:
Momentum is stuck in the overbought zone with 4 consecutive bullish candles. This signals that the bullish force is weakening.
• H1 timeframe:
Momentum is reversing inside the overbought zone. This shows the bullish force is fading, and price may reverse downward within 1–2 hours.
________________________________________
🌊 Wave Structure
• D1 timeframe:
Price is moving inside the Elliott channel drawn from wave 2 – wave 4 and wave 3 (yellow).
There is not much room left before hitting the upper channel.
This matches D1 momentum and the second target zone of wave 5 (yellow).
• H4 timeframe:
As mentioned in the previous plan, price broke the old high at 3793, confirming wave 5 (purple).
However, H4 momentum has been overbought for 4 consecutive candles, signaling that wave 5 (purple) is nearing its end.
• H1 timeframe:
Currently forming a 5-wave structure (1–2–3–4–5) in black inside wave 5 (purple).
All timeframes are showing signals that price is approaching a major top.
Although the trend is still bullish, sharp pullbacks of over 100 pips happen frequently, making it very difficult to trade with tight stop-losses.
________________________________________
🎯 Key Price Levels
• Price is now testing the 2.618 Fibonacci extension of wave 1 (black) at 3865.
• Upper channels from D1, H4, and H1 converge around 3885.
👉 This is the critical area to look for reversal signals and consider a Sell entry.
________________________________________
📌 Trading Plan
• Swing trades: Be patient, wait for clear signals before entering.
• Scalp trades: Possible, but avoid holding positions too long.
• Risk management: Strictly apply safe trade management as price is at a potential top zone.

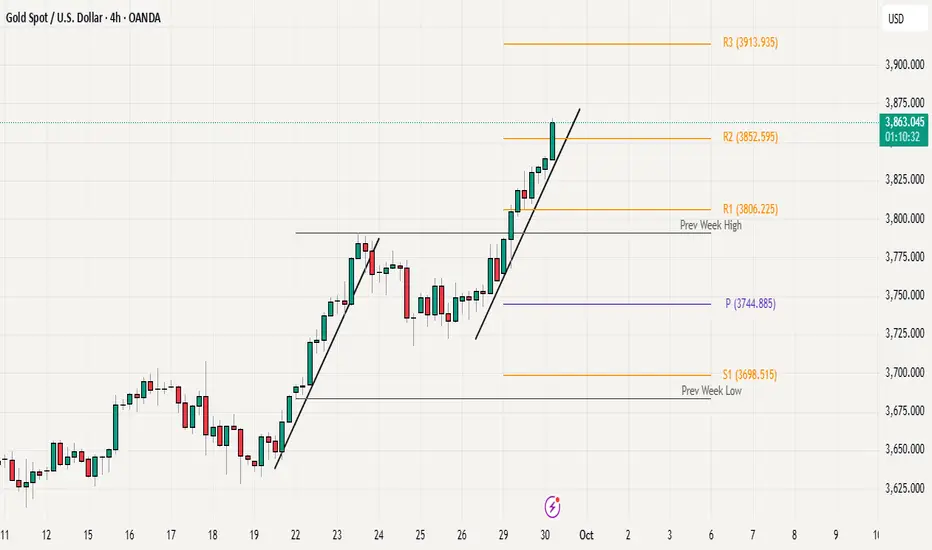
Gold Strength Persists: Trendline Support Key Into EOQ ClosingGold continues to show impressive strength, holding its bullish momentum without any major signs of rejection from higher levels. Price action is moving with a steady pace, consistently finding support on the rising trendline, which remains a key technical guide for intraday moves. The immediate horizontal support is now seen around 3850, and as long as price holds above both the trendline and this level, bulls are expected to remain firmly in control.
For bears to gain traction, they would need to drag price under the trendline and 3850 on a closing basis(H4 or Higher), which could open the door for a pullback. Until then, momentum clearly favors the upside. note that today marks month-end and quarter-end closing (EOQ), which may bring additional volatility and sharp intraday swings.
Overall, the bias remains bullish above 3850, with the trendline acting as dynamic support and a key zone to watch heading into the new month.
XAUUSD – Will ATH Diminish Gold's Value?Hello Traders,
Gold once accounted for up to 21% of total global assets, but now this figure is only about 5%. Two perspectives are clearly visible:
Gold is gradually losing its relative importance in the financial system.
The total value of global assets has increased significantly (the denominator has expanded), causing gold's proportion to decrease, while the absolute value of gold still plays an important role.
Technical Analysis
In today's Asian session, gold continues to set higher price levels, indicating a very strong upward momentum.
The upward price channel on H1 has touched the upper boundary, showing slight hesitation, but the main trend remains bullish.
The H1 and H4 frames maintain strong buying pressure, with market sentiment heavily leaning towards buyers, ready to push prices to higher levels.
According to Elliott Wave, the price is currently in wave 5 (market sentiment wave). The current task is to observe the reaction when this wave completes, to prepare for the ABC correction cycle.
Regarding Fibonacci, the next important resistance area is at 3880, where a bearish reaction is likely to occur.
Trading Scenario
Sell (at Fibo resistance 3880):
Entry: 3880
SL: 3886
TP: 3866 – 3850 – 3835
Buy (trend-following preferred):
Entry: 3813 – 3816
SL: 3809
TP: 3828 – 3843 – 3860 – 3878
👉 Note: Smaller frames H1 – M15 will provide additional confirmation signals to optimize entry points.
Conclusion
The bullish trend of gold is still prioritized, wave 5 is not yet complete, and the scenario aiming for 4000 – 4050 is entirely feasible.
Short-term selling at strong resistance areas can be considered, but risk management must be tight.
Traders need to closely follow support – resistance areas in smaller frames to maximize profits.
Follow me for the fastest updates when the price structure changes and to discuss more scenarios in the community.

H1 bullish momentum intact | Buy 3,792–3,765, target 3,821🟡 XAU/USD – 29/09/2025 | Captain Vincent ⚓
🔎 Captain’s Log – Structure & Trend
H1 continues to print consecutive BoS → bullish trend sustained.
Price broke the long-term downtrend line and surged to new highs.
EMA 34 & EMA 89 both pointing up and below price → confirming short-to-mid-term bullish momentum.
📈 Captain’s Chart – Key Zones
Storm Breaker (Sell Zone / ATH test) : 3,818 – 3,821
Golden Harbor (FVG – Buy Zone) : 3,792 – 3,779
OB Harbor 1 : 3,772 – 3,765
OB Harbor 2 (deeper) : 3,731 – 3,724
Core Idea: 3,792 – 3,765 is the main support “cushion” for trend-follow Buys; 3,818 – 3,821 is the wave edge where profit-taking may occur.
🎯 Captain’s Map – Trade Plan
✅ Golden Harbor (BUY – main priority)
Buy Zone 1 – FVG (3,792 – 3,779)
Entry: 3,792 – 3,779
SL: 3,765
TP: 3,805 – 3,818 – 3,821+
Buy Zone 2 – OB1 (3,772 – 3,765)
Entry: 3,772 – 3,765
SL: 3,758 (below 3,765)
TP: 3,792 – 3,805 – 3,818 – 3,821
Buy Zone 3 – OB2 deep (3,731 – 3,724)
Entry: 3,731 – 3,724
SL: 3,714
TP: 3,745 – 3,765 – 3,792 – 3,805
⚡ Quick Boarding (SELL – scalp only)
Sell Zone – Storm Breaker (3,818 – 3,821)
Entry: 3,818 – 3,821
SL: 3,828
TP: 3,805 – 3,796 – 3,792
Breakdown Short (conditional)
Only consider Short if H1 closes below 3,724
SL: 3,735
TP: 3,710 – 3,700 – 3,690
⚓ Captain’s Note
“The Golden sails remain filled after consecutive BoS . Golden Harbor 🏝️ (3,792 → 3,765) is the anchor dock to board in trend’s direction. Storm Breaker 🌊 (3,818 – 3,821) may trigger profit-taking waves – only go Quick Boarding 🚤 if clear signals appear. If the tide drags below 3,724, let the ship retreat to OB2 to gather strength before resuming the northbound voyage.”

Gold 1H – Will the Breakout from Range Sustain?Gold on the 1H timeframe has broken out of its previous consolidation range and is now testing a premium supply zone near 3828–3826. The structure shows a clear BOS after the range, supported by strong bullish momentum. However, engineered liquidity sweeps remain likely before the market establishes sustained direction.
From the macro side, today’s headlines highlight persistent inflation worries and a stronger U.S. dollar as traders anticipate upcoming remarks from Federal Reserve officials. Geopolitical tensions in energy markets have also underpinned safe-haven flows, adding volatility to gold price action.
This alignment of macro drivers and technical liquidity pools suggests two tactical scenarios: fading rejections at supply while preparing to buy dips into the defined demand zone.
________________________________________
📌 Key Structure & Liquidity Zones (1H):
• 🔴 SELL GOLD 3828–3826 (SL 3835): Premium supply zone with upside liquidity sweep potential, offering downside targets at 3810 → 3790 → 3775.
• 🟢 BUY GOLD 3757–3759 (SL 3750, Demand Zone): Discount demand area aligned with BOS, with upside targets at 3765 → 3780 → 3795+.
________________________________________
📊 Trading Ideas (Scenario-Based):
🔻 Sell Setup – Supply Rejection (3828–3826)
• Entry: 3828–3826
• Stop Loss: 3835
• Take Profits:
TP1: 3810
TP2: 3790
TP3: 3775
🔺 Buy Setup – Demand Mitigation (3757–3759)
• Entry: 3757–3759
• Stop Loss: 3750
• Take Profits:
TP1: 3765
TP2: 3780
TP3: 3795+
________________________________________
🔑 Strategy Note
Gold remains volatile after breaking out of consolidation. Expect engineered sweeps into both supply and demand zones before directional clarity develops. With macro headlines keeping the dollar firm and inflation risks alive, traders should watch for sharp intraday reversals:
• Fade supply rejections if momentum stalls at 3828–3826.
• Buy dips into demand if liquidity is swept cleanly around 3757–3759.
The broader narrative supports a two-sided strategy until the Fed provides clearer guidance.

silver soon topssilver could top soon , it had made the top and fallen , so could the history repeat ? we could see gold and silver prices falling soon because nothing could go so up forever
