DXY Weekly Free Analysis (28-06-25 to 05-07-25)DXY
In early July 2025, the US Dollar Index (DXY) may start moving up from the support area around 96.70. This is because the US is expected to release strong job and service sector data (like Non-Farm Payrolls and ISM Services), which shows the economy is still doing well. Also, the US central bank (Federal Reserve) is likely to keep interest rates high to control inflation, which usually supports the dollar. On the other hand, Europe’s economy is slowing down, so the European Central Bank might lower rates, making the euro weaker compared to the dollar. If global markets become risky, more people may buy dollars as a safe option. All these reasons could help the dollar bounce back in the coming days.
Market indices

Why Traders Repeat the Same Mistake – Even After Learning It?Hello Traders!
Have you ever promised yourself never to make the same trading mistake again — only to repeat it the very next week? You’re not alone. Many traders fall into the same traps over and over, even after they've studied the market and analysed their errors. Let’s break down why this happens , and how to break the cycle for good.
The Psychology Behind Repeating Mistakes
Emotions Override Logic: Even with knowledge, fear, greed, and FOMO (Fear of Missing Out) can hijack decision-making during live trades.
Lack of Process: Knowing the mistake is one thing. Having a written system or checklist to avoid it is another. Most traders skip this step.
No Real Accountability: Without a trading journal or a coach, it’s easy to forget or justify repeated bad behaviour.
Instant Gratification Bias: Humans are wired for short-term rewards. That’s why revenge trading or over-leveraging feels “right” in the moment, even when we know it’s wrong.
Rahul’s Tip
You can’t grow as a trader until you respect your own rules like a professional . Treat trading like a business — track, reflect, and correct every decision.
How to Break the Cycle
Use a Trading Journal: Write down every trade—entry, exit, emotion, and lesson. Over time, patterns become obvious and fixable.
Create a Pre-Trade Checklist: Don’t trade until your setup and risk criteria are met. This helps remove impulsive entries.
Limit Screen Time: More screen time often leads to more mistakes. Only watch the market during high-probability setups.
Have an Accountability Partner: Whether a mentor or trading buddy — feedback makes you honest and consistent.
Conclusion:
Learning is not enough. Rewiring behaviour is the real challenge. If you’re repeating mistakes, it’s not because you’re not smart — it’s because you haven’t built systems that protect you from your own emotions. Fix that, and your results will transform.
What’s the mistake you’ve repeated the most in your journey? Drop it in the comments so we can all learn and grow together!
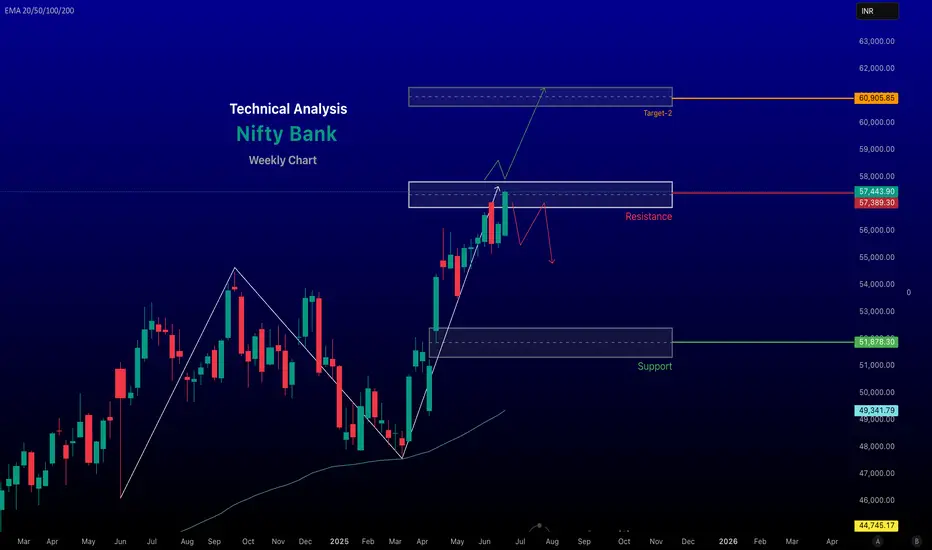
Bank Nifty Weekly Analysis for June 30, - 04, July - 2025The Bank Nifty index, as of June 28, 2025, shows a bullish outlook based on recent market data and technical analysis, though traders should remain cautious due to potential volatility and resistance levels. Here's a detailed analysis for today:
Market Performance and Sentiment
Recent Performance: The Nifty Bank index closed at 57,443.90 on June 27, 2025, with a gain of 237.20 points (+0.41%), indicating continued bullish momentum. The index has been trading near its 52-week high of 57,475.40, reflecting strong sectoral leadership. Posts on X suggest that Bank Nifty has outperformed the Nifty 50, which is 2.5% below its all-time high, with a target of 59,000.
Market Sentiment: Positive global cues, including a ceasefire between Israel and Iran, falling crude oil prices, and dovish signals from the U.S. Federal Reserve, have boosted risk appetite, supporting the banking sector's rally. Foreign Institutional Investors (FIIs) have been net buyers for four consecutive months, further fueling bullish sentiment. However, significant open interest (OI) buildup in the last two days suggests potential for abnormal volatility in the near term.
~~~ Technical Analysis ~~~
Current Levels and Trends: The index is closing at around 57,443.90, with a gain of 0.41%. The advance/decline ratio is positive at 8:4, indicating broader participation in the uptrend. The index is trading above key exponential moving averages (20-day, 50-day, and 200-day EMAs), confirming a strong upward trend on the weekly timeframe.
# Support and Resistance:
Support: Strong support is noted around 57,000, which has held well in recent sessions. A break below this could drag the index to 56,400–56,000. Additional support lies at 55,500, a critical level for maintaining bullish bias.
Resistance: Immediate resistance is at 57,500–57,800. A decisive break above 57,800 could push the index toward 58,000–58,400. Call options at 56,500 and 57,000 show significant open interest, reinforcing these as key resistance levels.
Technical Indicators: The Relative Strength Index (RSI) on the weekly timeframe is at 67.31, showing a reversal toward the upside, indicating strengthening momentum. However, a bearish divergence on the 4-hour chart remains unresolved, suggesting a potential correction toward 52,000 if the bullish structure weakens.
-- Bullish trend, next target 61,000 if we break and close above 57,800 on weekly timeframe --
Chart for reference.
- Disclaimer --
This analysis is based on recent technical data and market sentiment from web sources. It is for informational purposes only and not financial advice. Trading involves high risks, and past performance does not guarantee future results. Always conduct your own research or consult a SEBI-registered advisor before trading.
#Boost and comment will be highly appreciated
Nifty heading to the liquidity pool, now more bullishSo NSE:NIFTY gave a very good rally last week as we expected. Now we may see stocks breaking out from their congestion zone only to close lower at the end of the day. This may go on as Nifty approaches its next liquidity pool marked at 25,850. If we close above that on a weekly basis, then Nifty will give a fresh lifetime high.
One important thing to note is that buyers beat sellers by 44 million, so we still need to be on the bull side. Any dip would be a buying opportunity.
However, we need Monday's candle for more confirmation. So before making any other calculations, I will wait for that.
Support now stands at 25,480–25,523 on the intraday chart.
NSE:BANKNIFTY has given a fresh lifetime high, but buyers were beaten by sellers on Friday, leaving the index on an indecisive note. That's why here too we need Monday's candle to confirm further momentum. Support is at 56,800 for the week. Below this would be weakness for the week.
Time to do only Swing Trading and not open fresh short-term positions as both indices have a divergence. Any bounce till we close above 25,850 would be a profit-booking opportunity only.
On a special note – take no MTF positions for your own best.
That will be all. Let the new data come in and then we can analyze further. Take care. Have a profitable week ahead.


Nifty 50 Weekly Technical Analysis for June 16 – 20 , 2025
~~ Key Technical Indicators and Levels ~~
-- Current Price and Trend:
As of recent trading sessions, the Nifty 50 closed at 24,718 on June 14, 2024, with a marginal decline. The index has been consolidating after a significant rally post-election results, indicating a pause in the bullish momentum.
The short-term trend remains bullish, but the index is showing signs of consolidation near its all-time high.
#Support and Resistance Levels:
Support: Key support levels are identified around 24,500–24,150 (immediate support),
Resistance: Immediate resistance is at 25000–25,100, with a psychological barrier at 25,000. A breakout above 25,100 could target 25,500 in the medium term.
-- Moving Averages:
The Nifty is trading above its key moving averages (20-day, 50-day, and 200-day EMAs), signalling a bullish trend.
A cooling-off in RSI signal a healthy correction before the next leg up.
Chart for your reference
-- Disclaimer --
This analysis is based on recent technical data and market sentiment from web sources. It is for informational purposes only and not financial advice. Trading involves high risks, and past performance does not guarantee future results. Always conduct your own research or consult a SEBI-registered advisor before trading.
#Boost and comment will be highly appreciated
#Nifty Weekly Analysis 30-06-25 to 04-07-25#Nifty Weekly Analysis 30-06-25 to 04-07-25
25080 is the support for coming week.
Long continuation above 25680 for the targets of 25780/25980.
If Nifty gives a pull back, Long from support.
If Nifty slips below 24950, again market will go in to sideways phase.
View: Buy on dips till 25080.

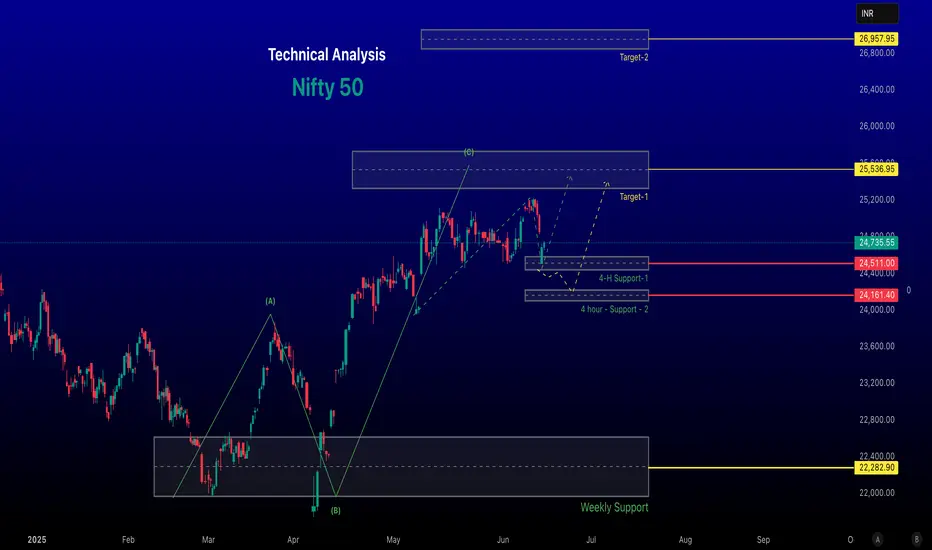
Nifty 50 weekly Analysis for June 28, - 04, July 2025
~~ Nifty 50 Analysis for June 28, 2025 ~~
As of June 28, 2025, the Nifty 50 index continues to exhibit a bullish bias with cautious undertones, driven by global market sentiment, domestic buying, and technical patterns. Below is a comprehensive analysis based on the latest available data and market insights.
# Market Performance Overview
Previous Close (June 27, 2025): The Nifty 50 closed at 25,637.80, up 88.80 points (+0.35%), reflecting a positive session driven by select sectors.
Market Context: The index has been on a four-day gaining streak, supported by positive global cues, including easing geopolitical tensions (e.g., ceasefire between Israel and Iran), falling crude oil prices, and dovish signals from the U.S. Federal Reserve, which have boosted risk appetite.
##Technical Analysis
Trend and Momentum:
The Nifty 50 is trading within an ascending channel on the daily timeframe, indicating a bullish structure. On the weekly timeframe, it is forming an Ascending Triangle Pattern, a bullish setup that could lead to a breakout if the index sustains above 25,300.
The index is above key Exponential Moving Averages (EMAs) (20-day, 50-day, 100-day, and 200-day), reinforcing the bullish trend. The weekly chart shows alignment above the 20-week, 50-week, and 200-week EMAs, with an Inside Bar pattern indicating buying interest on dips.
Relative Strength Index (RSI): The RSI is at 49.90–64.58, reflecting neutral momentum. It is neither overbought nor oversold, suggesting room for movement in either direction depending on fresh triggers.
MACD: The MACD for the broader index is indecisive, with some constituents (e.g., HCL Technologies) showing bullish signals, while others (e.g., Hero MotoCorp) are bearish.
Support and Resistance Levels:
Support: Immediate support is at 25,130–25,060, with stronger support at 24,800–24,650. A break below 24,500 could lead to a deeper correction toward 24,300–24,400.
Resistance: The index faces resistance at 25,600–25,700, with a breakout above this zone potentially targeting 26,100, close to the all-time high of 26,277.35 (Sep 27, 2024).
A sustained move above 25,300 could confirm bullish continuation, while failure to break 25,700 may lead to profit booking.
Next Weekly Target 26,800 - 27,000 Chart posted for your reference only
-- Disclaimer --
This analysis is based on recent technical data and market sentiment from web sources. It is for informational purposes only and not financial advice. Trading involves high risks, and past performance does not guarantee future results. Always conduct your own research or consult a SEBI-registered advisor before trading.
#Boost and comment will be highly appreciated

SECTOR WATCH NIFTY ITBig Breakout on the watch
Inverse head and shoulder pattern on NIFTY IT chart.
Pattern is already activated and can accumulate IT stocks.
CMP 38600 TARGET OF 45000 with SL of right shoulder 36700
#harmonic
#sector analysis
#headandshoulder
#breakout
#trading


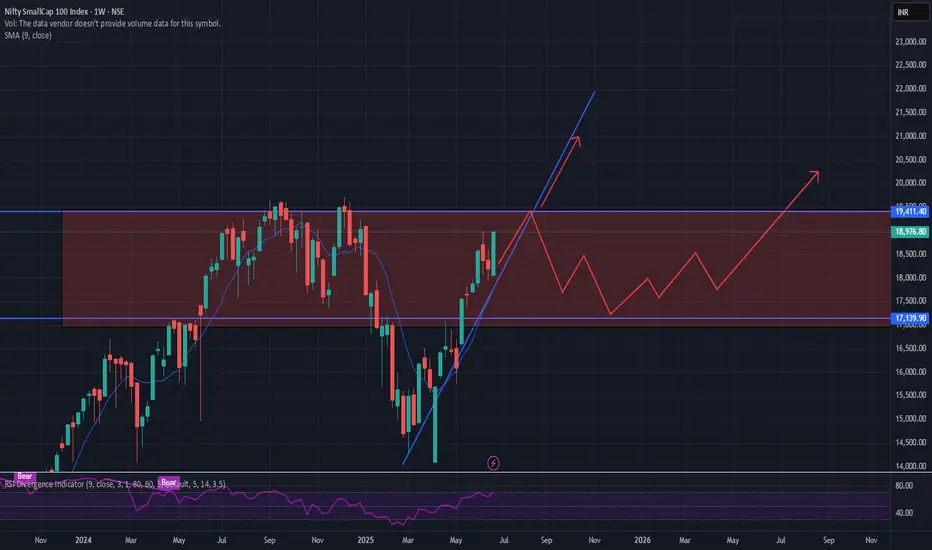
Bullish Consolidation and Anticipated BreakoutThe chart analysis indicates that the Nifty SmallCap 100 Index is currently in a consolidation phase within the red rectangular zone. The blue upward trend line and the arrow suggest a bullish sentiment, with potential for the stock to break out of the consolidation range and continue its upward trajectory
27 June 2025 - Nifty goes up 780pts from the last long signalNifty Stance Bullish 🐂
Our last long signal came exactly on 20th June, i.e. the same day the last report was written. On Monday we had a gap-down due to conflict escalation of Iran-Israel as the US went ahead and bombed Iran's proposed nuclear sites.
Fortunately, our EMAs did not cross over and on the next day, i.e. 24th, we had a gap up that not only retraced Monday's fall, but opened significantly higher than Friday's close. Due to sensex expiry on Tuesday, 24th - the swings were pretty bad too, still our EMAs did not give a short signal.
25th, 26th and today proved to me much peaceful as the price actions were steady, swings were lower and the bullish tone cemented. India VIX is at 12.38, showing the volatility has some how subsided.
We have gone up 780pts ~ 3.14% so far from the time the last long signal was recorded. The last expiry week of June has magically erased the first 3 weeks of stop loss hits.
Whats next? We still keep the bullish spirits alive till the negative crossover occurs.

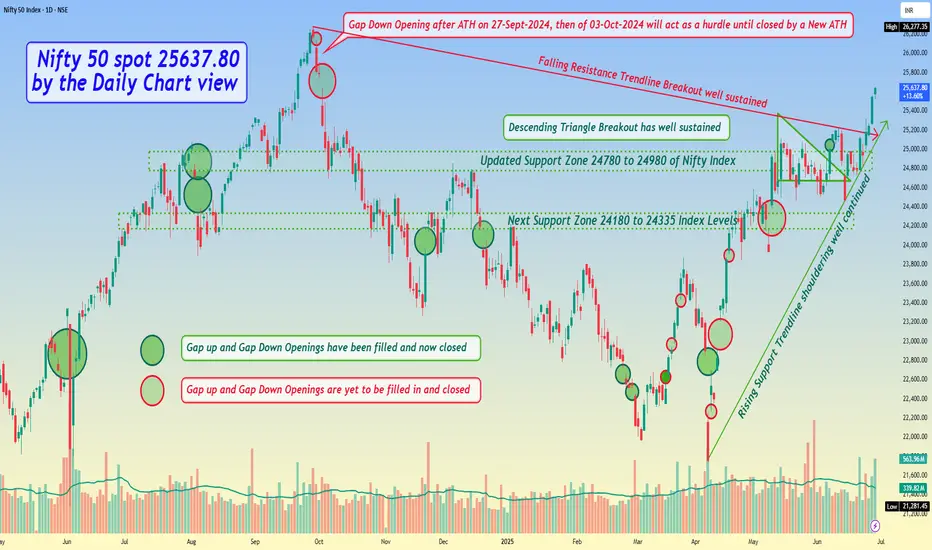
Nifty 50 spot 25637.80 by the Daily Chart view - Weekly update*Nifty 50 spot 25637.80 by the Daily Chart view - Weekly update*
- Descending Triangle Breakout has well sustained
- Immediate Support Zone 25125 to 25335 of Nifty Index
- Next updated Support Zone 24780 to 24980 of Nifty Index
- And then next Support Zone 24180 to 24335 of Nifty Index Levels
- Resistance Zone seen at 25860 to 26035 and then ATH 26277.35 of Nifty 50 Index levels
- Rising Support Trendline shouldering well continued and Falling Resistance Trendline Breakout well sustained
- *Gap Down Opening after ATH on 27-Sept-2024, then of 03-Oct-2024 will act as a hurdle until closed by a New ATH*
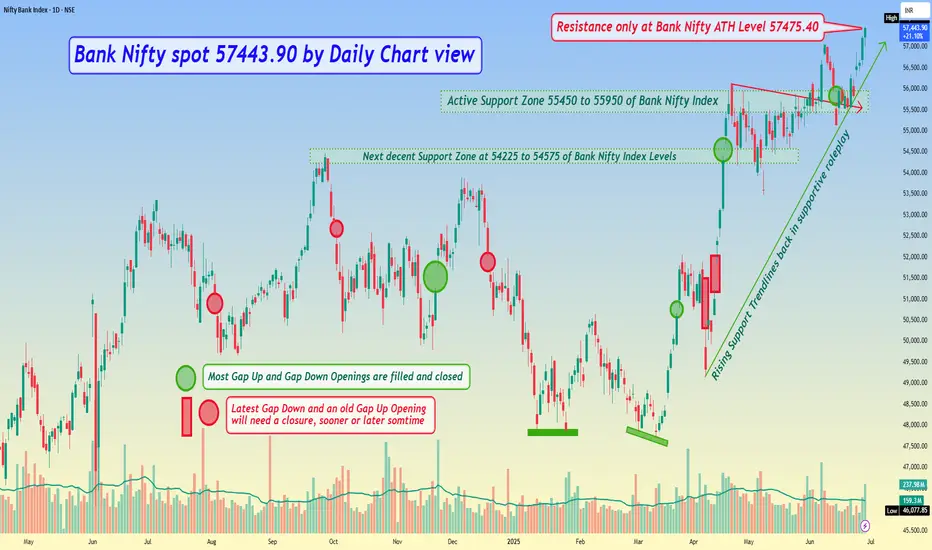
Bank Nifty spot 57443.90 by Daily Chart view - Weekly update*Bank Nifty spot 57443.90 by Daily Chart view - Weekly update*
- Resistance only at Bank Nifty ATH Level 57475.40
- Active Support Zone 55450 to 55950 of Bank Nifty Index
- Rising Support Trendlines back in supportive role has sustained
- Next decent Support Zone at 54225 to 54575 of Bank Nifty Index Levels
- Bullish Rounding Bottom below ATH indicatives more positive trends to look forward to.....

Nifty - Elliot Wave - Update - Stay long till proven otherwise!Our view that at least one more leg up was pending has held out well.
View shared here:
Now, Since it took longer in consolidation, I am open to considering that we did a sideways 2 and are heading up in 3.
Crossing 25700 will invalidate LD and hence increase probability that 3 up has started.
P.S.: If we are actually in 3, then 28k - 30k possible in this year. So, hold on :)

Nifty Intraday Analysis for 27th June 2025NSE:NIFTY
Index has resistance near 25700 – 25750 range and if index crosses and sustains above this level then may reach near 25950 – 26000 range.
Nifty has immediate support near 25350 – 25300 range and if this support is broken then index may tank near 25150 – 25100 range.
Banknifty Intraday Analysis for 27th June 2025NSE:BANKNIFTY
Index has resistance near 57500 – 57600 range and if index crosses and sustains above this level then may reach near 58000 – 58100 range.
Banknifty has immediate support near 56800 - 56700 range and if this support is broken then index may tank near 56300 - 56200 range.

Finnifty Intraday Analysis for 27th June 2025NSE:CNXFINANCE
Index has resistance near 27450 - 27500 range and if index crosses and sustains above this level then may reach near 27650 - 27700 range.
Finnifty has immediate support near 27050 – 27000 range and if this support is broken then index may tank near 26850 – 26800 range.

Midnifty Intraday Analysis for 27th June 2025NSE:NIFTY_MID_SELECT
Index has immediate resistance near 13475 – 13500 range and if index crosses and sustains above this level then may reach 13700 – 13725 range.
Midnifty has immediate support near 13200 – 13175 range and if this support is broken then index may tank near 13025 – 13000 range.
BANKNIFTY Intraday Live Session 27 JUN Breakout/Breakdown Levels NSE:BANKNIFTY – Key Levels Setup | Breakout or Breakdown Scenario
According to the price action observed at session start , NSE:BANKNIFTY is currently consolidating between the resistance at 57,125 and the support at 57,060 . The structure suggests price is coiling, and a decisive move beyond either level could trigger a directional breakout.
• Key Levels:
Resistance: 57,125
Support: 57,060
• Breakout Scenario:
If price breaks and sustains above 57,125 :
TP1 (1:1): 57,190
TP2 (1:2): 57,255
TP3 (1:3): 57,320
• Breakdown Scenario:
If price breaks and sustains below 57,060 :
TP1 (1:1): 56,995
TP2 (1:2): 56,930
TP3 (1:3): 56,865
"Stay neutral, stay ready. Let the chart pick the direction."
Information and analysis provided is for educational purposes only.

NIFTY Intraday Live Session 27 JUN Breakout/Breakdown Levels NSE:NIFTY – Key Levels Setup | Breakout or Breakdown Scenario
According to the price action observed at session start , NSE:NIFTY is currently consolidating between the resistance at 25,547 and the support at 25,516 . The structure suggests price is coiling, and a decisive move beyond either level could trigger a directional breakout.
• Key Levels:
Resistance: 25,547
Support: 25,516
• Breakout Scenario:
If price breaks and sustains above 25,547 :
TP1 (1:1): 25,578
TP2 (1:2): 25,609
TP3 (1:3): 25,640
• Breakdown Scenario:
If price breaks and sustains below 25,516 :
TP1 (1:1): 25,485
TP2 (1:2): 25,454
TP3 (1:3): 25,423
"Stay neutral, stay ready. Let the chart pick the direction."
Information and analysis provided is for educational purposes only.

Cup and Handle pattern forming on the Nifty 50 Index (Daily TimeThis chart shows a Cup and Handle pattern forming on the Nifty 50 Index (Daily Timeframe) — a classic bullish continuation setup.
📝 Analysis:
Pattern: A well-shaped Cup and Handle pattern is visible, indicating strong accumulation and base formation.
Breakout Zone: Nifty is approaching the resistance zone near 25,655 – 26,035.
Trigger Point: A breakout above this zone with volume confirmation may lead to a strong upward rally.
Support Zone: Immediate support lies around 25,320 – 25,000 (handle zone).
📈 View:
If Nifty manages to break and sustain above the neckline (25,655+), it could trigger a bullish momentum aiming toward higher levels in the coming weeks.
