DECCANCEDeccan Cements Ltd's (DECCANCE) current share price is ₹717.50, with a 5% increase as of February 20, 2025 ¹. Here's a snapshot of its fundamental data:
- *Market Capitalization*: ₹957 crores
- *P/E Ratio*: 55.30, indicating the stock is overvalued
- *P/B Ratio*: 1.34
- *Dividend Yield*: 0.44%
- *ROE*: 5.18%
- *ROCE*: 5.66%
- *Book Value*: ₹509.40
- *Face Value*: ₹5.00
- *52-Week High/Low*: ₹769.00/₹524.20

SRF#SRF – Strong Trend Continuation Setup 📈
✅ Bullish Setup in Progress! SRF has shown strong momentum, with price holding above key support levels after a recent breakout.
Key Technical Highlights:
Breakout Retest: The stock has successfully retested its breakout level and is holding above key moving averages.
Relative Strength vs. Nifty: Positive, indicating outperformance in the broader market.
Moving Averages Alignment: The stock is trading above all major EMAs, confirming bullish bias.
Trading Plan:
📌 Buy Above: Key breakout confirmation level for trend continuation.
📌 Stop Loss: Placed below support to limit downside risk.
📌 Targets: Looking for continuation towards next resistance levels.
Final Thoughts:
With a strong breakout structure and bullish relative strength, SRF looks well-positioned for an upward move. I will wait for confirmation above the level(on the chart) before entering.
📢 What’s your take on SRF? Drop your thoughts below! 🔥

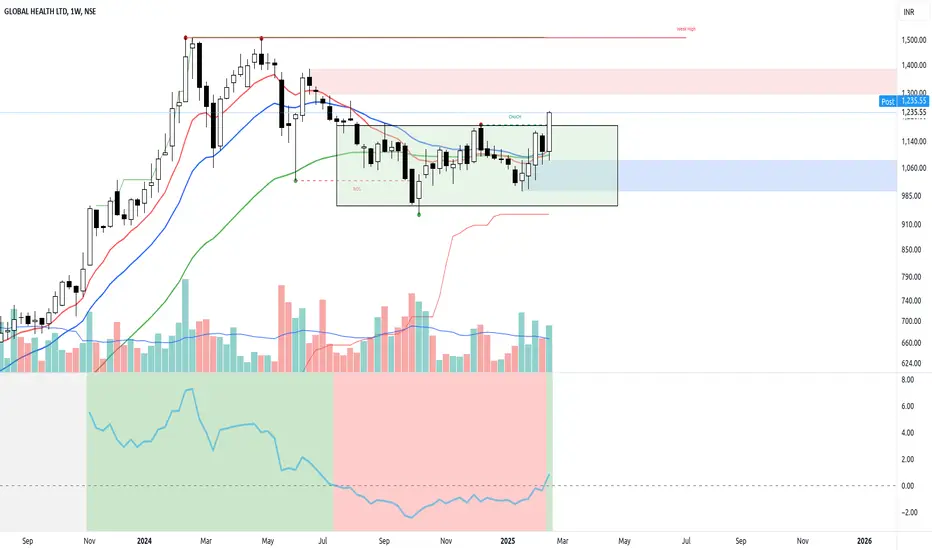
MEDANTA – Strong Breakout After 6-Month Base! #MEDANTA – Strong Breakout After 6-Month Base! 🚀
✅ Bullish Momentum Building! #Medanta (GLOBAL HEALTH LTD) has broken out of a 6-month consolidation base with above-average volume, signaling renewed buying interest.
Key Technical Highlights:
Breakout Confirmation: Price has decisively moved above its 6-month base, indicating strength.
Volume Surge: The breakout is supported by above-average volume, confirming strong accumulation.
Relative Strength vs. Nifty: Turned positive, showing outperformance and potential trend continuation.
Moving Averages: Price is trending above key moving averages, reinforcing bullish sentiment.
Trading Plan:
📌 Entry: Looking for sustained price action above the breakout zone.
📌 Stop Loss: Below key support levels to manage risk effectively.
📌 Targets: Monitoring for potential upside continuation based on past price structures.
Final Thoughts:
With a strong base breakout, volume confirmation, and positive relative strength, Medanta is showing strong momentum. I expect the stock to continue its upward move and will be watching closely for further confirmation.
📢 Do you agree with this breakout? Share your insights below! 🔥
BUY TODAY SELL TOMORROW for 5%DON’T HAVE TIME TO MANAGE YOUR TRADES?
- Take BTST trades at 3:25 pm every day
- Try to exit by taking 4-7% profit of each trade
- SL can also be maintained as closing below the low of the breakout candle
Now, why do I prefer BTST over swing trades? The primary reason is that I have observed that 90% of the stocks give most of the movement in just 1-2 days and the rest of the time they either consolidate or fall
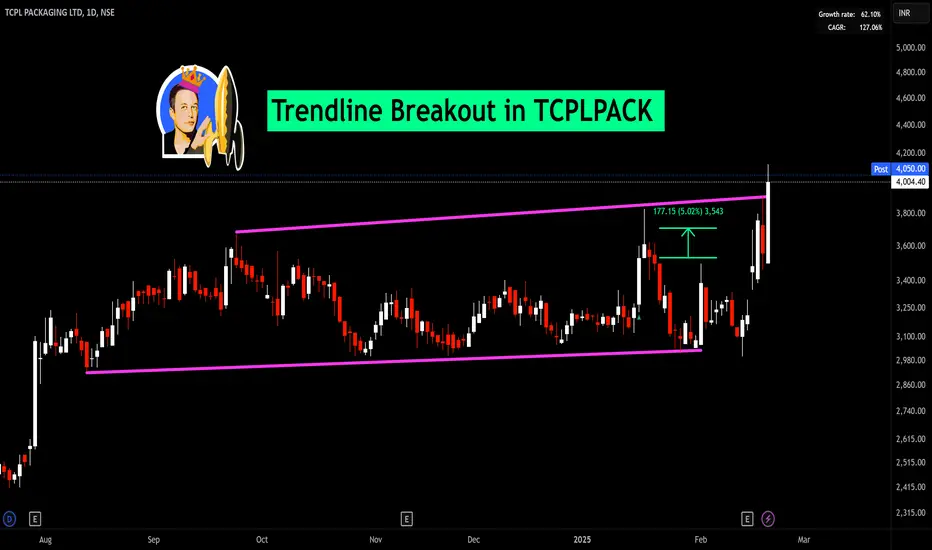
Trendline Breakout in TCPLPACK
BUY TODAY SELL TOMORROW for 5%
GAIL - EXPECTING A BOUNCESymbol - GAIL
CMP - 158.10
GAIL Ltd. has been following a downward trend over recent months, with the overall technical structure remaining bearish. However, the stock has recently reached a crucial support zone, which lies between the 154-162 range, a level that has held strong since January 2024. This area serves as a key support zone, and it could offer the stock a potential bounce from its current bearish trend.
The stock is currently forming a rounding top pattern, a classic bearish formation that indicates a possible continuation of bearish trend at current levels or even trend reversal. Despite the overall bearish pattern, the price is consolidating near this important support level, which increases the probability of a bounce. While a short-term upward move is possible, the stock may resume its downtrend after this bounce.
In the short term, the trend is still slightly bearish. The stock has encountered some selling pressure near its support zone but is testing the resilience of this critical level. For me, The current market price around 158 offers an opportunity for a long position. It may be prudent to add more to this position as the price moves toward 153-152, while keeping a stop loss at 148 to manage risk.
However, if the stock breaks below 150 and sustains below this level, the current bounce scenario would be invalidated, and the stock would likely face further selling pressure, accelerating the downtrend.
Disclaimer - Do not consider this as a buy/sell recommendation. I'm sharing my analysis & my trading position. You can track it for educational purposes. Thanks!

BUY TODAY SELL TOMORROW for 5%DON’T HAVE TIME TO MANAGE YOUR TRADES?
- Take BTST trades at 3:25 pm every day
- Try to exit by taking 4-7% profit of each trade
- SL can also be maintained as closing below the low of the breakout candle
Now, why do I prefer BTST over swing trades? The primary reason is that I have observed that 90% of the stocks give most of the movement in just 1-2 days and the rest of the time they either consolidate or fall
Trendline Breakout in RELIGARE
BUY TODAY SELL TOMORROW for 5%

KDDL - Breakout Stock 🚀 KDDL Ltd. is showing strong momentum with robust fundamentals! 📈
✅ Key Highlights:
✔️ Strong growth in revenue & profitability
✔️ Solid demand outlook in the watch components & luxury retail segment
✔️ Technical breakout observed – worth tracking
💡 Keep on watch for potential moves!
🔹 Disclaimer: This is purely for informational purposes and not a recommendation to buy or sell. Investors should conduct their own research before making any investment decisions. 📢
#StockMarket #KDDL #StocksToWatch #BreakoutStocks #Nifty50 #Investing

Mahindra & Mahindra Date : 21.02.2025
Mahindra & Mahindra
Timeframe : Day Chart
Key Points :
Good profit growth of 121.66% for the Past 3 years.
Good revenue growth of 30.31% for the Past 3 years.
Has significantly decreased its debt by 3,058.84 Cr.
Maintaining healthy ROCE of 20.26% over the past 3 years.
Virtually debt free.
Healthy Interest coverage ratio of 53.72.
Company’s PEG ratio is 0.49.
Has an efficient Cash Conversion Cycle of -35.20 days.
Has a good cash flow management; CFO/PAT stands at 1.66
Current Impact :
1 Tesla entry in India amid huge expansion of M&M in EV segment is hurting sentiment
2 Tariff on imported EV slashed 100% to 15%
Regards,
Ankur

in waree we can show some consolidation for this trendin waree we can show some consolidation for this trend 2200 to 2600 u can take trade 2200 and target up to 2600 +++

Still some correction leftBritannia CMP 4805
Elliott- the corrective pattern here is a zig zag. Good part is this is just the first leg A of the pattern. In my view it should end around the 4340 zone. The B wave which will be a rally should go all the way to 5800. I will say book ur profits here and say thank u to mkt. Coz the devastating C will start post that. In my view the entire process will take a year.

A breakout retracement?Tracking this company for almost 6-8 months now and having traded few times. Looks like this time the entry would be difficult to time. Waiting for 0.5 retracement + the breakout retracement both levels around 7000-7150. Lets see how it pans out

TRIVENI - opportunity for quick 2% gainsNSE:TRIVENI
cmp 388
there is an opportunity for getting quick 2% gains in this stock.
on hourly timeframe there is trendline breakout plus positive diversion on the RSI
I will be looking for entry at cmp 388 with target of 394
SL will be 372
The objective of this analysis is knowledge sharing and education. There isn't any buy or sell advise in this article.
It is expected of each person to carry out own research and evaluation to ascertain whether my perspective is matchingwith your studies.

CYIENT - opportunity for quick 4% gainsNSE:CYIENT
cmp 1476.50
there is an opportunity for getting quick 4% gains in this stock.
on hourly timeframe there is trendline breakout plus positive diversion on the RSI
I will be looking for making an entry above 1488 with target of 1545-1550
SL will be 1523
The objective of this analysis is knowledge sharing and education. There isn't any buy or sell advise in this article.
It is expected of each person to carry out own research and evaluation to ascertain whether my perspective is matchingwith your studies.

GLAND - opportunity for quick 3% gainsNSE:GLAND
cmp 1520
there is an opportunity for getting quick 3% gains in this stock.
on hourly timeframe there is trendline breakout plus positive diversion on the RSI
I will be looking for entry at cmp 1515 with target of 1565
SL will be 1443.
The objective of this analysis is knowledge sharing and education. There isn't any buy or sell advise in this article.
It is expected of each person to carry out own research and evaluation to ascertain whether my perspective is matchingwith your studies.

DLF mine favorite stock, its time againDLF was in sideways moves for quite a long, however it was trying to finish the contracting triangle. What more we are at the right time.
Possibilites:
1) we can have another small contracting triangle in which leg e will be the leg a and so on.
2) we will see a sharp move towards 944-945 considering the triangle is completed.
Its a little wait and watch situation for few more days before we see any conclusive move.
Disclaimer: This is for educational purpose only. I am not authorised to give buy/sell recommendation. please do your own analysis and then take a decision.

Cipla Update after the Correction
Please refer the earlier chart of Cipla. Correction is over, we are seeing a big move up after the end of correction at wave e, remember there might be a pull back but overall the uptrend has just began. I am expecting that Cipla to move at 1675-1679 by Mid March to End of March.
First Immediate move to 1580 and then the rest will unfold slowly.
Disclaimer: I am not SEBI registered member and these Ideas are meant only for educational purposes.

DR REDDY GAP DOWN IN 3rd WAVEwe clearly see GAP DOWN in 3rd wave of the 5 waves of the C wave. What does this indicates? A fall to complete the 3rd wave was quick. we are done with 3rd wave and in the process to complete the 4th wave.
Possibilities:
*) Downward it can go to 1148-1160 to complete the 5th wave.
*) It may close the 3rd wave Gap before resuming its downward Journey to complete the 4th wave. (Less Probability)
In Either case I would prefer not to enter any new position and wait for the right opportunity.
Disclaimer: I am not SEBI registered Member. This is Strictly for educational purpose only.

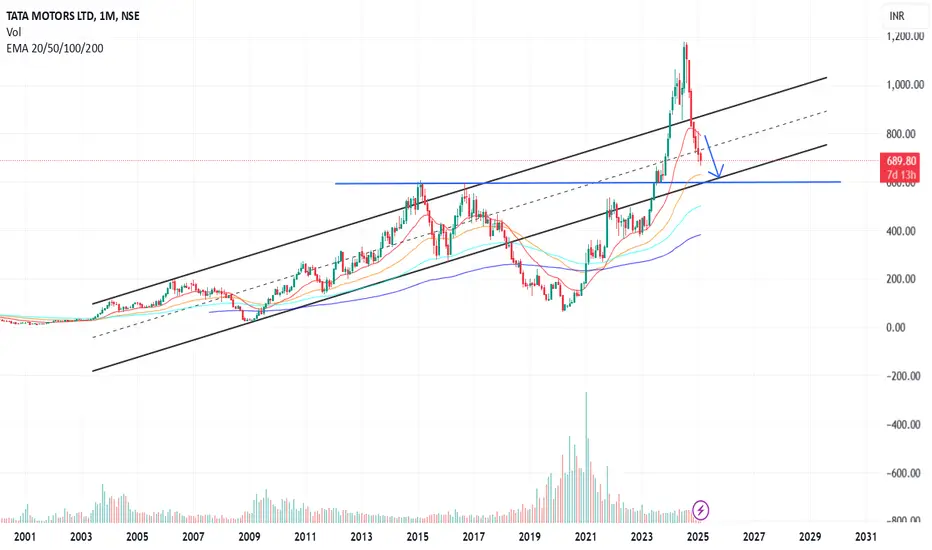
Key ₹600 Support in Focus Amid Tesla's Potential India EntryTata Motors appears to have key support around ₹600, with no strong buying interest visible until that level. A pullback to test support is likely before any sustained upward movement.
The ongoing U.S.-India tariff negotiations add to uncertainty, particularly for the EV sector. If Tesla secures entry into the Indian market with favourable terms, it could intensify competition, potentially disrupting domestic players like Tata Motors. In such a scenario, Tata Motors' stock could see a sharp correction, possibly retesting the ₹300 levels if investor sentiment turns bearish.
Key levels to watch:
- Support: ₹600 (short-term), ₹300 (major downside risk)
- Resistance:₹750-₹800
Technical Analysis of Pennar Industries LtdAfter a prolonged period of two months characterized by a downward trend, Pennar Industries has recently exhibited bullish momentum with notable breakouts. An analysis of the daily chart reveals a significant trendline breakout, accompanied by increased trading volume, which has facilitated a close above the 50-day EMA. This development is a positive indicator for potential upward movement.
Additionally, the RSI has also shown a breakout, moving above the pivotal 50 level, which traditionally signals a shift towards bullish territory. The MACD has provided further confirmation of this bullish sentiment, with a crossover being observed, and the MACD histogram now reflecting positive values.
In terms of potential price levels, it is important to note that the stock may encounter resistance around the ₹183 mark, followed by another resistance level at ₹204 . Conversely, strong support is identified at the ₹152 level, which could serve as a safety net for investors in case of price retracement.
Disclaimer: The insights provided in this analysis are for informational and educational purposes only and should not be interpreted as financial advice. It is recommended that individuals consult with a qualified financial advisor or conduct their own comprehensive research before making any investment decisions.

OngcDate : 21.02.2025
Ongc
Day chart
Head & shoulder, neckline is make or break coz it is in confluence with wedge base
The company has shown a good profit growth of 53.31% for the Past 3 years.
The company has shown a good revenue growth of 23.98% for the Past 3 years.
Company is virtually debt free.
Company has a healthy Interest coverage ratio of 13.99.
The Company has been maintaining an effective average operating margins of 31.57% in the last 5 years.
The company has a good cash flow management; CFO/PAT stands at 1.93.
The company has a high promoter holding of 58.89%.
Regards,
Ankur

how to ride big bullish trends in market ?Riding big bullish trends in the market requires a combination of skill, strategy, and discipline. Here are several steps and strategies that traders and investors commonly use to take advantage of strong upward trends:
### 1. **Identify the Bullish Trend Early**
- **Trend Indicators:** Use tools like moving averages (e.g., 50-day, 200-day) to confirm the trend. When the price is above a moving average, it's often a sign that the market is in a bullish phase.
- **Volume Analysis:** Look for increasing volume as prices rise. A strong uptrend is often confirmed with higher trading volume.
- **Support & Resistance:** Identify key support levels where the price bounces higher and resistance levels where the price breaks through. Breaking resistance levels could signal the start of a strong bullish move.
- **Chart Patterns:** Watch for patterns like "cup and handle," "ascending triangles," or "bullish flags" that often precede large upward movements.
### 2. **Use Technical Analysis to Enter the Market**
- **Pullbacks and Corrections:** A pullback in the trend is a good entry point if the bullish trend is still intact. For example, buying during small pullbacks after a strong upward movement can often provide an opportunity to enter at a favorable price.
- **Breakouts:** If a stock or asset breaks through a significant resistance level with momentum, this could indicate the beginning of a big move.
- **Indicators:** Use momentum indicators like RSI (Relative Strength Index) or MACD (Moving Average Convergence Divergence) to confirm that the trend is strong and not overbought.
### 3. **Risk Management**
- **Stop-Loss Orders:** Set stop-loss orders to limit your losses if the trend reverses. Consider trailing stops, where the stop-loss moves with the price to lock in profits as the trend moves up.
- **Position Sizing:** Don’t risk too much of your capital on a single trade. Use appropriate position sizing, so that even if a trade goes against you, it doesn’t hurt your portfolio too much.
- **Diversification:** Don’t concentrate all your investments into one asset or market. Spread your risk across different assets that are all riding a bullish trend.
### 4. **Ride the Trend with Patience**
- **Don’t Rush to Exit:** If the trend is strong, sometimes the best strategy is to hold your position and avoid jumping in and out of the market. Many successful traders let their positions run while adjusting their stop-loss to lock in gains.
- **Mental Discipline:** Avoid the temptation to exit too early or chase the market. Stay disciplined and stick with your plan.
### 5. **Monitor Market Sentiment**
- **News & Events:** Stay aware of news, earnings reports, and events that could drive the market. Strong bullish trends can be supported by good news, but you must also be cautious of any market-moving events that could reverse the trend.
- **Market Sentiment Indicators:** Use sentiment indicators like the Fear & Greed index or news sources to gauge whether the market is overly optimistic or if there’s still room for the trend to continue.
### 6. **Scale-In and Scale-Out**
- **Scale-In:** Add to your position as the trend strengthens and the price continues to go up. Don’t go all-in at once. Add to the position gradually as it proves itself.
- **Scale-Out:** Take partial profits along the way to lock in some gains while letting the rest of the position run if the trend continues.
### 7. **Avoid Emotional Trading**
- **Fear of Missing Out (FOMO):** Don’t chase the trend after it has already run up significantly. This often leads to buying at the top and facing a market reversal.
- **Greed:** Don’t hold onto a position out of greed when signs of a reversal are apparent. Recognize when it’s time to exit or reduce your exposure.
### 8. **Adapt to Changing Market Conditions**
- **Trend Reversals:** Be aware of signs that the trend may be reversing (e.g., a sudden sharp drop in price or lower highs forming in the chart). Don't ignore signals of a potential change, and be ready to exit before the trend turns.
- **Market Cycles:** Understand that markets move in cycles. While one trend may be bullish, eventually the market will transition, and you need to adjust your strategy accordingly.
### 9. **Use Leverage Cautiously (Advanced)**
- If you're an experienced trader, you might consider using leverage to amplify your returns on a bullish trend. However, leverage increases risk, so it should be used cautiously, and only if you fully understand the risks involved.

CIE Automotive India LtdDate : 21.02.2025
CIE Automotive
NSE: CIEINDIA
Timeframe : Weekly
Quarterly Results :
Q3 CONS NET PROFIT 1.85B RUPEES VS 1.69B (YOY); 1.95B (QOQ)
CIE AUTOMOTIVE: Q3 REVENUE 21.1B RUPEES VS 22.4B (YOY)
CIE AUTOMOTIVE: Q3 EBITDA 2.99B RUPEES VS 3.27B (YOY)
Q3 EBITDA MARGIN 14.18% VS 14.61% (YOY)
Regards,
Ankur

how to become profitable in long term trading ?Becoming **profitable in long-term trading** is about developing a solid strategy, being patient, and having the discipline to stick to your plan through market ups and downs. It’s not about quick gains but rather about making consistent, smart decisions that compound over time. Here are key steps you can follow to increase your chances of long-term profitability:
---
### **1. Develop a Clear Trading Plan**
A **trading plan** is essential for long-term success. It serves as a roadmap to guide your decisions and keep your emotions in check.
- **Define Your Goals**: Are you looking to grow your wealth over time, generate income, or hedge other investments? Be clear on your objectives.
- **Choose Your Trading Style**: Long-term trading can include strategies like:
- **Buy and Hold**: Holding positions for years to capture long-term growth.
- **Swing Trading**: Holding positions for several weeks or months based on market trends.
- **Position Trading**: Taking larger positions based on long-term trends or fundamental factors.
- **Set Criteria for Trades**: Define what conditions need to be met for you to enter and exit a trade, based on technical analysis, fundamentals, or both.
---
### **2. Focus on Solid Fundamentals**
In long-term trading, understanding the underlying assets you're trading is key. This involves:
- **Fundamental Analysis**: For stocks, this means analyzing financial statements, revenue growth, debt levels, competitive advantage, and management quality. For other assets like commodities or currencies, it means understanding supply/demand dynamics, global economic trends, etc.
- **Quality Assets**: Invest in assets that have strong long-term potential. For example, stocks of companies with solid fundamentals (e.g., consistent earnings growth, strong market position) are more likely to appreciate over time.
- **Diversification**: Spread your investments across different asset classes (stocks, bonds, commodities, etc.) to reduce risk. A diversified portfolio helps smooth out the ride over time.
---
### **3. Embrace the Power of Compounding**
**Compounding** is one of the most powerful concepts in long-term investing. By reinvesting your profits (such as dividends, interest, or capital gains), you earn returns on your original investment as well as your accumulated returns.
- **Start Early**: The earlier you start, the more time your investments have to compound. This means consistently reinvesting profits back into the market.
- **Regular Contributions**: Consider contributing to your portfolio on a regular basis (e.g., monthly or quarterly), even if the amounts are small. Over time, these contributions can grow significantly.
---
### **4. Stick to a Risk Management Strategy**
Long-term trading requires patience, and part of that patience comes from managing risk effectively.
- **Position Sizing**: Don't risk too much on any single trade. The general rule is to risk only 1–2% of your capital on each position. This helps ensure that even if a trade goes wrong, it won’t hurt your overall portfolio too much.
- **Diversification**: As mentioned, diversifying your investments across different sectors, industries, or asset classes can help reduce the overall risk of your portfolio.
- **Set Stop-Losses and Take-Profits**: While long-term trading generally involves less frequent exits, it's still smart to set stop-loss levels to protect yourself from large, unforeseen losses and take-profit levels to lock in gains when your target is met.
---
### **5. Be Patient and Avoid Emotional Trading**
- **Long-Term Focus**: One of the biggest mistakes traders make is reacting to short-term market movements. Don’t let temporary volatility derail your long-term plan.
- **Emotional Discipline**: Keep emotions like fear and greed in check. Long-term trading requires the ability to ignore the “noise” of daily market fluctuations. Stick to your plan and don’t chase after short-term wins.
- **Avoid Overtrading**: Don’t trade just for the sake of trading. Successful long-term traders often make fewer trades and hold positions for longer periods.
---
### **6. Keep Learning and Stay Informed**
- **Continuous Education**: Stay updated on market trends, economic conditions, and new trading strategies. The more you learn, the better decisions you’ll be able to make.
- **Review Your Trades**: Regularly analyze your past trades and portfolio performance. What worked? What didn’t? This feedback loop will help you improve your decision-making over time.
- **Stay Updated on Global Events**: Understanding macroeconomic trends, interest rates, geopolitical events, and industry news is critical for long-term traders. These can significantly impact your investments.
---
### **7. Keep Costs Low**
In long-term trading, transaction costs (like commissions, spreads, and fees) can eat into your profits. Minimize costs to maximize returns.
- **Use Low-Cost Brokers**: Choose brokers with low fees or commission-free trading to keep costs under control.
- **Long-Term Tax Efficiency**: Be mindful of capital gains taxes. In many countries, long-term capital gains (for assets held more than a year) are taxed at a lower rate than short-term capital gains. Plan your trades accordingly to minimize taxes.
---
### **8. Stick to a Long-Term Investment Mindset**
Successful long-term traders aren’t trying to time the market or chase every trend. Instead, they:
- **Trust the Process**: Recognize that there will be both ups and downs in the market. Be prepared for volatility, and stick to your strategy even during tough times.
- **Understand the Power of Patience**: Long-term trading is about building wealth steadily over time. It may not be as thrilling as short-term trading, but it can lead to significant gains when compounded over years.
- **Avoid Trying to "Time" the Market**: Trying to predict short-term market movements is difficult and often counterproductive. Instead, focus on capturing long-term growth and trend-following.
---
### **9. Monitor and Adjust When Necessary**
While patience is crucial, so is flexibility. You should monitor your portfolio periodically and make adjustments as needed:
- **Rebalance Your Portfolio**: Over time, some assets in your portfolio may grow faster than others, causing your initial asset allocation to shift. Periodically rebalance your portfolio to align with your long-term goals.
- **Adapt to Changing Conditions**: The world changes, and so do markets. Stay open to adjusting your strategy if you notice shifts in market conditions, economic trends, or your personal financial situation.
---
### **10. Stay Disciplined in Your Approach**
- **Avoid the Urge to “Time the Market”**: It’s nearly impossible to predict short-term price movements. Trust your long-term plan and make decisions based on sound analysis, not market noise.
- **Stay Committed**: Long-term profitability requires consistency. Stick to your strategy, keep learning, and be disciplined.
---
### Conclusion:
**Long-term trading** is about building wealth gradually through informed decisions, patience, and proper risk management. It’s not about chasing short-term gains but about being consistent in your approach, staying disciplined, and letting your investments grow over time. With the right mindset and strategy, you can achieve consistent profitability in the long run.
