SRF Intraday SwingBias is on upside for intraday for next week.
This is a chart analysis based on SMC Concept.
This is for education purpose only.

how to become a successfull trader ?Becoming a **successful trader** requires a combination of knowledge, skills, discipline, and a good mindset. Trading is not about getting rich quickly; it's about being consistent and making informed decisions. Here's a comprehensive guide on how to become a successful trader:
1. Develop a Strong Understanding of the Markets**
**Learn the Basics**:
- **Understand Different Markets**: Learn about the different types of markets you can trade in: stocks, forex, commodities, cryptocurrencies, and others.
- **Market Structure**: Understand how the markets work, how prices move, and what factors influence price movements (e.g., economic data, earnings reports, political events).
**Study Trading Styles**:
- **Day Trading**: Buying and selling within a single day.
- **Swing Trading**: Holding positions for a few days to weeks.
- **Position Trading**: Longer-term approach, holding positions for weeks, months, or even years.
- **Scalping**: Very short-term trades, often lasting just minutes, capitalizing on small price moves. Each style requires a different strategy, timeframe, and risk tolerance.
2. Develop a Trading Strategy**
**Plan Your Approach**:
- **Create a Trading Plan**: Your trading plan should define your goals, risk tolerance, the markets you'll trade, your strategy, and the rules for entering and exiting trades.
- **Set Clear Entry and Exit Points**: Identify signals that will guide your decisions (technical indicators, price action, chart patterns, etc.).
- **Risk-to-Reward Ratio**: Ensure your strategy offers a positive risk-to-reward ratio (e.g., risking $1 to potentially make $2).
**Use Technical and Fundamental Analysis**:
- **Technical Analysis**: Involves using charts and technical indicators to predict future price movements. This includes trends, support and resistance levels, moving averages, RSI, MACD, and others.
- **Fundamental Analysis**: Involves analyzing the financial health and intrinsic value of an asset, looking at earnings reports, interest rates, GDP data, etc.
**Backtesting**:
- Before you start live trading, backtest your strategy on historical data to see how it would have performed. This will help you refine your strategy and reduce the chances of losses.
3. Learn and Use Risk Management Techniques**
**Risk Management is Key**:
- **Risk per Trade**: Never risk more than a small percentage of your trading capital on a single trade (e.g., 1-2%). This protects you from major losses.
- **Stop-Loss Orders**: Use stop-loss orders to automatically sell a position if the price moves against you. This helps protect your capital.
- **Position Sizing**: Adjust the size of your positions based on how much risk you're willing to take. If you're risking 1% per trade, your position size should be adjusted accordingly.
**Diversification**:
- Spread your risk by trading different assets or using different strategies. This prevents you from losing everything in one market or asset class.
**Avoid Overtrading**:
- Don’t feel the need to trade all the time. Sometimes doing nothing is the best decision. Only trade when your strategy aligns with market conditions.
4. Develop a Strong Mental Game**
**Emotional Control**:
- **Stay Calm and Disciplined**: Trading can trigger emotions like fear, greed, and excitement. Learning how to control these emotions is essential for success. Emotional trading is often the cause of major losses.
- **Stick to Your Plan**: Don't deviate from your strategy based on emotions. Even if you're losing or missing opportunities, staying disciplined is the key to long-term success.
**Patience is Key**:
- **Trade with a Long-Term View**: Don't expect to make huge profits in the short term. Building wealth through trading takes time. Focus on consistent, smaller gains rather than trying to hit big wins.
**Learn from Mistakes**:
- **Keep a Trading Journal**: Record every trade you make—why you entered, why you exited, and what the outcome was. This helps you identify patterns in your trading and learn from your mistakes.
**Avoid the "Fear of Missing Out" (FOMO)**:
- The market is always full of opportunities. Avoid chasing trades when they don’t fit your strategy just because you feel like you might miss out. Stick to your trading plan.
5. Continuously Educate Yourself**
**Markets Evolve**:
- The financial markets are constantly changing, and new strategies, tools, and technologies emerge all the time. You need to stay updated.
**Read Books and Take Courses**:
- Books like **"Market Wizards" by Jack Schwager**, **"The Intelligent Investor" by Benjamin Graham**, or **"A Random Walk Down Wall Street" by Burton G. Malkiel** are good starting points.
- Online courses, webinars, and seminars from reputable trading educators can provide valuable insights.
**Follow Expert Traders**:
- Follow experienced traders on social media, read their blogs, and watch their analysis. This will expose you to different viewpoints and strategies.
6. Start Small and Scale Gradually**
**Start with a Demo Account**:
- Many trading platforms offer demo accounts where you can practice trading with virtual money. Use this to test strategies and get comfortable with the platform before risking real capital.
**Start with a Small Amount**:
- Once you begin live trading, start small. Avoid risking large amounts of capital until you're more experienced. As you gain confidence and refine your strategy, you can gradually increase your position sizes.
7. Keep Track of Your Performance**
**Review Your Trades**:
- At the end of each week or month, review your trades. Did you stick to your strategy? What worked and what didn’t? Identify the areas where you can improve.
- **Performance Metrics**: Track your **win rate**, **average profit/loss**, **risk-to-reward ratio**, and **drawdowns** to measure your performance and identify trends.
**Adapt and Improve**:
- Be flexible and willing to adapt your strategy as you learn from your experiences. If something is not working, don't be afraid to change it. The best traders are always evolving.
8. Be Prepared for Losses**
**Losses Are Part of Trading**:
- Accept that losses are a natural part of trading. Even the most successful traders experience losses. The key is to ensure that your profits outweigh your losses over time.
**Focus on Long-Term Consistency**:
- Don’t let a few losses discourage you. Focus on making sound decisions and maintaining consistency. Compounding small profits over time can lead to significant gains.
9. Use Technology and Automation**
**Trading Platforms and Tools**:
- Use advanced **trading platforms** that provide charting tools, real-time data, risk management features, and backtesting capabilities (e.g., MetaTrader, TradingView, ThinkOrSwim).
**Automated Trading**:
- As you become more experienced, you can experiment with **algorithmic trading** or **automated trading bots** to implement your strategies. These can execute trades for you based on predetermined criteria, reducing emotional decision-making.
10. Build a Trading Routine and Stick to It**
**Consistency is Key**:
- Develop a daily routine that includes chart analysis, strategy development, reviewing your previous trades, and mental preparation.
**Set Realistic Goals**:
- Set daily, weekly, and monthly profit/loss goals. Make sure your goals are realistic based on your skill level and capital. Aim for steady growth rather than overnight success.
*Conclusion**
Becoming a successful trader is a journey that requires dedication, continuous learning, and a disciplined approach. **Education**, **risk management**, **emotional control**, and **persistence** are all key to long-term profitability. It’s a marathon, not a sprint.
By following these steps, practicing regularly, and learning from both your successes and mistakes, you can improve your trading skills and increase your chances of success in the markets. Start small, stay patient, and always remember: consistent, controlled, and informed decision-making is the true path to success in trading.

JUBLFOOD Probable price actionBased on the recent price action for Jubilant FoodWorks Ltd (JUBLFOOD), the stock shows a bullish trend in the short term:
1. The stock closed at ₹670.5 on February 14, 2025, up 1.27% from the previous close.
2. JUBLFOOD has been in an uptrend since late January 2025, rising from ₹638.65 on January 27 to the current price of ₹670.50.
3. The stock has shown strong momentum, breaking above the ₹700 level in early January before a brief pullback.
4. Recent price action indicates a recovery from the pullback, with the stock forming higher lows and higher highs since February 12, 2025.
5. The stock is trading above its 50-day moving average of ₹699.307, suggesting bullish sentiment in the medium term.
6. Volume has been above average in recent sessions, with 4,032,606 shares traded on February 14, compared to the average volume of 2,001,293.
7. The stock is showing strength relative to its 52-week range, currently trading closer to its year high of ₹796.75 than its year low of ₹421.05.
However, traders should note some potential resistance levels:
1. The stock may face resistance near the ₹700 level, which it failed to hold in early February.
2. The year high of ₹796.75 could act as a strong resistance if the uptrend continues.
Overall, the price action suggests a bullish short-term outlook for JUBLFOOD.

1900 Is the key support for Lupin Lupin will ready to take off for new target of 2450 , wait and watch . If the support get break down the next target will 1600

SHREECEM Price action analysisBased on the latest available data, the price action analysis for Shree Cement Ltd (SHREECEM) indicates a bullish trend in the short to medium term:
1. The stock is trading above its key moving averages, including the 5, 10, 20, 50, 100, and 200-day moving averages, suggesting strong upward momentum.
2. As of February 14, 2025, the stock was showing bullish signals for short-term, medium-term, and long-term investors.
3. The current price is significantly higher than the 200-day moving average of 26,081.26, indicating a sustained uptrend.
4. Recent price action has formed a cup and handle pattern on the daily chart, which is typically considered a bullish continuation pattern.
5. The stock has been in an uptrend since September 2023, breaking out of a sideways movement that had persisted since August 2022.
However, it's important to note some potential caution signals:
1. As of January 21, 2025, there were indications of a possible short-term downtrend, with the price falling below the important level of 25,422.22.
2. The stock was trading below its short-term Volume Weighted Average Price (VWAP) of 25,264.61, suggesting some selling pressure.
3. Technical indicators like ADX and MACD were showing sell signals in the short term as of January 21, 2025.
Given the conflicting signals between the January and February data, traders should closely monitor the stock for confirmation of the current trend and be aware of potential volatility.

learning momentum trading and becoming profitable**Momentum trading** is a popular strategy that focuses on buying securities that are trending in a strong direction (either upward or downward) and selling when the momentum starts to fade. The key idea behind momentum trading is to capitalize on the continuation of existing trends, rather than trying to predict reversals. Let’s dive into what momentum trading is and how to use it effectively to become profitable.
**1. Understanding Momentum Trading**
What is Momentum Trading?**
- Momentum trading involves buying stocks or assets that are moving strongly in one direction and selling them when their momentum begins to fade or reverse.
- Momentum traders rely on technical indicators to identify trends and assess the strength of those trends.
Key Concepts in Momentum Trading**:
- **Trend Following**: The foundation of momentum trading is that “the trend is your friend.” Momentum traders aim to follow the direction of the market rather than predict when it will change.
- **High Volatility**: Momentum trades often occur in volatile markets, where prices are moving quickly.
- **Short-Term Focus**: Momentum traders usually focus on short to medium-term moves. They look for rapid price changes over a few days or weeks.
Momentum Trading vs. Value Investing**:
- **Momentum Trading**: Focuses on assets that are rising in price (or falling in a short-term downtrend) and expects that movement to continue.
- **Value Investing**: Looks for undervalued stocks that may eventually rise in price over the long term, but with less emphasis on short-term price movements.
2. Key Indicators for Momentum Trading**
Momentum traders use a variety of **technical indicators** to gauge market trends and assess entry and exit points. Here are some key indicators:
Relative Strength Index (RSI)**:
- **What It Is**: A momentum oscillator that measures the speed and change of price movements on a scale of 0 to 100.
- **Interpretation**:
- An RSI above 70 typically signals that the asset is overbought and might soon reverse or experience a slowdown.
- An RSI below 30 indicates that the asset is oversold and might rebound.
Moving Averages**:
- **What It Is**: A moving average smooths out price data over a specified period.
- **Simple Moving Average (SMA)**: The average price over a set period (e.g., 50-day or 200-day).
- **Exponential Moving Average (EMA)**: Places more weight on recent prices.
- **Interpretation**:
- When the price is above the moving average, it signals an uptrend, and when below, it signals a downtrend.
- **Golden Cross**: When a short-term moving average (e.g., 50-day) crosses above a long-term moving average (e.g., 200-day), it’s a bullish signal.
- **Death Cross**: When a short-term moving average crosses below a long-term moving average, it signals a bearish trend.
#Moving Average Convergence Divergence (MACD)**:
- **What It Is**: A momentum oscillator that shows the relationship between two moving averages of an asset's price.
- **Interpretation**:
- **Bullish Signal**: When the MACD line crosses above the signal line.
- **Bearish Signal**: When the MACD line crosses below the signal line.
- It also identifies overbought and oversold conditions.
Average True Range (ATR)**:
- **What It Is**: A measure of volatility that shows the average range of price movement over a set period.
- **Interpretation**:
- High ATR suggests high volatility (ideal for momentum trades).
- Low ATR indicates a consolidation phase (momentum may not be strong).
3. Momentum Trading Strategies**
Trend Following**:
- **What It Is**: A straightforward momentum strategy where traders buy when an asset is trending upward and sell when it starts to lose momentum.
- **How to Implement**:
1. **Identify a Trend**: Look for stocks with significant upward or downward price movement.
2. **Entry Point**: Enter when the price breaks out above resistance or below support, or when technical indicators like RSI or MACD confirm a strong trend.
3. **Exit Point**: Exit when the momentum weakens, such as when the RSI crosses above 70 (overbought) or below 30 (oversold), or when the moving average trend weakens.
Momentum Breakouts**:
- **What It Is**: Trading assets that break through key resistance or support levels with high volume, signaling that the momentum may continue.
- **How to Implement**:
1. **Watch for Breakouts**: Look for stocks or assets breaking through a well-established resistance level with significant volume.
2. **Enter on Confirmation**: Enter the trade once the breakout is confirmed by volume and momentum indicators (such as MACD).
3. **Exit on Weakness**: Exit the position if the breakout fails or if the momentum indicators show that the trend is reversing.
Pullbacks in a Trend**:
- **What It Is**: This strategy involves entering a trade during a temporary reversal in the trend (a pullback), expecting the trend to resume.
- **How to Implement**:
1. **Identify a Strong Trend**: Look for an asset with a clear upward or downward trend.
2. **Wait for a Pullback**: Enter the trade when the price temporarily retraces but stays within the trend’s direction (often near support levels or moving averages).
3. **Exit when Momentum Resumes**: Exit once the trend resumes, confirmed by indicators like RSI, MACD, or price action.
4. Risk Management in Momentum Trading**
Momentum trading can be profitable, but it also comes with significant risks due to rapid price movements. Effective risk management is key to maintaining profitability:
Position Sizing**:
- **Determining Position Size**: Based on your account balance and the amount of risk you’re willing to take, decide how much capital to allocate to each trade. A common rule is to risk no more than 1-2% of your capital on a single trade.
Stop-Loss Orders**:
- **Setting Stop-Loss**: Place a stop-loss order below a recent support level (for long positions) or above resistance (for short positions). This limits losses in case the momentum fades or the trend reverses unexpectedly.
Take-Profit Orders**:
- **Setting Take-Profit**: Decide in advance where you’ll exit the trade with profits. This could be based on resistance levels, a fixed percentage profit, or a target set by momentum indicators.
Avoid Overtrading :
- **Trade Only with Confirmed Trends**: Stick to clear momentum signals and avoid trading in low-volume or choppy markets. Overtrading or chasing after every move can quickly lead to losses.
5. Tools and Resources for Momentum Trading**
Platforms for Momentum Trading**:
- **TradingView**: Offers advanced charting tools and access to real-time data for analyzing price trends and momentum indicators.
- **MetaTrader**: Provides a variety of technical indicators and automated trading options.
- **ThinkorSwim**: A platform by TD Ameritrade that offers advanced charting tools for momentum traders.
Keeping Up with Market News**:
- **Financial News**: Stay updated on market-moving events such as earnings reports, economic data releases, and geopolitical developments.
- **Stock Screeners**: Use stock screeners like Finviz, StockFetcher, or Screener.co to find stocks with strong momentum indicators and high volume.
6. Practicing Momentum Trading**
The best way to become profitable with momentum trading is to practice and refine your strategies. Here's how:
- **Start with Paper Trading**: Many trading platforms offer paper trading accounts where you can practice without risking real money.
- **Backtest Strategies**: Use historical data to test how your momentum strategies would have performed in the past.
- **Track Your Trades**: Keep a trading journal to document your trades, strategies, and outcomes. This helps you learn from your successes and mistakes.
- **Start Small**: Begin with smaller position sizes and gradually increase your exposure as you gain confidence and experience.
**Conclusion**
Momentum trading can be an exciting and profitable strategy if you know how to identify strong trends, manage risk, and use the right indicators. The key to becoming profitable is discipline, risk management, and continuously learning from both your successes and failures.
By combining technical indicators, risk management techniques, and disciplined execution, you can improve your chances of success as a momentum trader. Keep refining your strategies, stay patient, and practice with real-time data until you feel confident.

Dixon technology is ready for the new next high of 29500 According to my Analysis dixon is going to be very bullish and this is the most important support for this stock.

Learning database trading with skytradingzone **What is Database Trading?**
Database trading involves using **databases** filled with historical and real-time market data to design trading strategies. You’ll analyze things like stock prices, trading volumes, and other financial indicators to spot patterns that might suggest future price movements.
Think of it as using **data** to inform your trades rather than just relying on intuition or news. You’re letting the **numbers speak** for themselves.
**How Does It Work?**
1. **Collect Data**:
You gather huge amounts of **historical market data** (like stock prices, volumes, economic indicators, etc.) and **real-time data** (like live stock prices and news updates). This data forms your **database**.
2. **Store Data in Databases**:
You store this data in databases that allow for **quick retrieval and analysis**. Popular databases used in trading include **SQL databases**, **NoSQL**, and **data warehouses**.
3. **Data Analysis**:
Traders use tools and algorithms to **analyze** this data. They look for patterns, correlations, or trends that can indicate when a stock is likely to go up or down.
4. **Backtesting**:
Once you’ve analyzed the data and developed a strategy, you can **backtest** it. Backtesting means running your trading strategy on historical data to see if it would have worked in the past. If the strategy performs well historically, it may be worth trying in real-life trading.
5. **Automated Trading**:
The real magic happens when you combine database trading with **algorithmic trading**. This means creating an **automated system** that places trades based on the data analysis. For example, the system could automatically buy a stock when certain conditions are met (like when a stock’s price is below its moving average).
**Key Components of Database Trading**
1. **Data Collection**
- You need access to reliable market data, like stock prices, volume, indicators, news, etc.
- **API (Application Programming Interface)**: APIs are commonly used to pull live data from sources like **Yahoo Finance**, **Quandl**, or even stock exchanges.
2. **Data Storage and Management**
- You need a structured way to **store and manage** this data. Databases help with storing large amounts of information, and tools like **SQL** or **Python libraries (e.g., pandas)** can help manipulate and analyze the data.
3. **Data Analysis and Algorithm Development**
- Once the data is collected, it’s all about **finding patterns** or correlations. Traders can use machine learning, statistical analysis, or even AI to make predictions based on historical trends.
- **Popular analysis tools**: **Python**, **R**, and **Matlab** are widely used for analysis. They help you build models that predict market trends or identify arbitrage opportunities.
4. **Backtesting**
- Before going live with your strategy, you backtest it against historical data to ensure it’s profitable and safe. This helps you see whether your algorithm works in different market conditions (bullish, bearish, or sideways).
5. **Automated Trading Systems**
- Once you're confident with the strategy, you can use automated trading systems or **bots**. These systems can automatically place trades based on the rules you’ve programmed.
**Why is Database Trading Important?**
1. **Speed and Efficiency**:
Database trading allows you to make **faster decisions** than a human trader could, especially when combined with automated trading. The system can analyze data and execute trades in milliseconds.
2. **Data-Driven Decisions**:
Instead of relying on guesses or emotions, you’re making decisions based on hard data. This increases your **chances of success** and helps you avoid costly mistakes.
3. **Backtesting and Optimization**:
You can backtest your strategies, meaning you can test them on historical data before using real money. This gives you a lot of confidence in the strategy.
4. **Scalability**:
Once you’ve developed a successful database trading strategy, you can scale it easily. You can start trading small amounts, and as you gain experience, increase your trading volume with minimal risk.
**Example of a Simple Database Trading Strategy**
Let’s say you want to create a strategy that buys a stock if:
1. The stock price is above its **200-day moving average** (indicating it’s in an uptrend).
2. The **relative strength index (RSI)** is below 30 (indicating it might be oversold and due for a bounce).
You would:
1. **Collect historical stock price data** for the last year.
2. Use **SQL** or a **Python script** to compute the 200-day moving average and the RSI for each stock.
3. **Backtest** the strategy to see if it would have worked in the past.
4. Once you’re confident it’s a solid strategy, you can **automate** it to trade for you.
**Tools Used in Database Trading**
- **Databases**: SQL, NoSQL, MongoDB
- **Programming Languages**: Python, R, JavaScript
- **Libraries/Frameworks**: Pandas, NumPy, TensorFlow (for machine learning), scikit-learn
- **Backtesting Platforms**: QuantConnect, Backtrader
- **Automated Trading Platforms**: MetaTrader, Interactive Brokers API
**Conclusion**
Database trading allows you to make **data-driven** decisions rather than relying on gut feelings. By leveraging data analysis, backtesting, and automated trading systems, you can develop strategies that are more **efficient** and **profitable**.

channel of JWLJWL is trading in this channel and it recently touches 52 week low indicator also so best time to buy for magnificent gains

Reliance is going thru uptrendReliance has bottomed out. Now its time to move uptrend. Target 1320 with SL 1180. Time frame 1month.

What is rsi and how to use it ?RSI stands for **Relative Strength Index**, which is a momentum oscillator used in technical analysis to measure the speed and change of price movements. It is primarily used to identify whether an asset is overbought or oversold, helping traders make decisions about potential buy or sell opportunities.
### Key Points About RSI:
- **Scale**: RSI ranges from 0 to 100.
- **Overbought and Oversold Levels**:
- **Overbought**: When RSI is above 70, the asset is considered overbought, meaning it may be overvalued and could see a price reversal downward.
- **Oversold**: When RSI is below 30, the asset is considered oversold, meaning it might be undervalued and could see a price reversal upward.
### How to Use RSI:
1. **Identifying Overbought/Oversold Conditions**:
- **Overbought (RSI > 70)**: This suggests the asset may have been overbought, and a pullback or price reversal might occur. Traders might consider selling or shorting.
- **Oversold (RSI < 30)**: This suggests the asset may be oversold, and a rebound or price reversal might happen. Traders might consider buying.
2. **RSI Divergence**:
- **Bullish Divergence**: When the price makes new lows, but RSI forms higher lows, this can indicate a potential upward reversal or buying opportunity.
- **Bearish Divergence**: When the price makes new highs, but RSI forms lower highs, this may signal a potential downward reversal or selling opportunity.
3. **RSI and Trend Strength**:
- RSI can also help assess trend strength. For example, during a strong uptrend, the RSI might stay above 40-50 and consistently test the overbought zone. Similarly, in a strong downtrend, the RSI may hover below 60 and frequently test oversold conditions.
4. **RSI and Trend Reversals**:
- When the RSI crosses back above the 30 level (from below), it can signal the start of an uptrend (bullish reversal).
- When the RSI crosses back below the 70 level (from above), it can signal the start of a downtrend (bearish reversal).
### Practical Example of Using RSI:
- **Example 1: Overbought Condition**:
- Let's say a stock has an RSI of 75. This indicates it’s overbought, suggesting that a price pullback or correction might be on the horizon. Traders might consider selling or taking profits at this point.
- **Example 2: Oversold Condition**:
- If the RSI of a stock is 25, it indicates the stock is oversold and could be undervalued. Traders might look for a buying opportunity, anticipating that the price may rise.
### Limitations:
- RSI is more useful in ranging (sideways) markets than in trending markets. In strong trends, RSI may stay overbought or oversold for extended periods without reversing.
- RSI signals should ideally be combined with other indicators or chart patterns for confirmation.

Mastering the Flag Chart Pattern for Profitable BreakoutsFlag Chart Pattern: A Key to Successful Breakouts
Hello Traders!
I hope you’re all doing well! Today, we’ll be taking a deep dive into the Flag Chart Pattern . This continuation pattern is a favorite for traders looking for a strong trend to follow. If you want to spot reliable breakouts, the Flag pattern is something you’ll want to master. It can help you ride strong trends and get in at the right moment after a brief consolidation.
What is the Flag Pattern?
The Flag Chart Pattern forms after a sharp price movement (the Flagpole ), followed by a brief consolidation period. The consolidation forms a rectangular or parallelogram shape, which is the Flag . Once the price breaks out of this consolidation, it often continues in the same direction as the initial Flagpole .
In other words, the Flag Pattern signals that the market is taking a quick breather before continuing its strong momentum in the same direction.
Key Characteristics of the Flag Pattern
Flag Pole : The initial sharp price movement (either upward or downward), showing strong momentum.
Flag : The consolidation phase that follows the pole, typically characterized by parallel trendlines, forming a rectangular or parallelogram shape.
Breakout : The price breaks above (for a bullish pattern) or below (for a bearish pattern) the flag's upper or lower boundary, confirming the continuation of the trend.
Volume Confirmation : Volume usually decreases during the consolidation (flag) phase, followed by a surge in volume at the breakout, which confirms the strength of the move.
How to Trade the Flag Pattern Like a Pro
Entry Point : The best time to enter is after the price breaks above the flag’s upper boundary (for bullish setups).
Stop Loss : Place your stop loss just below the flag’s lower boundary or the most recent swing low, to minimize risk.
Profit Target : For setting targets, measure the height of the flagpole and project that distance from the breakout point to set your profit target.
Real-World Application: Dixon Technologies Case Study
Looking at the Dixon Technologies chart, we can see a clear Flag Chart Pattern forming. After a sharp price increase (the flagpole ), the stock consolidated, creating the flag . Once the price broke out above the flag’s upper trendline, the price continued to rise, confirming the continuation of the uptrend. The expected target can be calculated using the flagpole’s height, projecting it from the breakout point.
Conclusion
The Flag Chart Pattern is one of the most reliable continuation patterns in technical analysis. By recognizing the flagpole , waiting for the breakout, and managing your risk effectively, you can increase the chances of a successful trade.
Have you traded using the Flag pattern?
Share your experiences in the comments below! Let’s learn together and keep improving our trading strategies!

ONGC - Did You Get Trapped in an Irregular Flat? – Elliott Wave I Told You So… The Market Whispers! Can You Hear Them?
Back in April 2024, I warned you to be careful as the stock approached key resistance at 314, forming a Bearish Bat pattern with a Potential Reversal Zone (PRZ) between 300-275. The stock topped at 287, right at the edge of invalidation.
Yet, if you got convinced of the rally above 300, then unfortunately, no one can help—but I did my job of warning you months in advance.
This reminds me of BHEL, the stock we discussed a few days back.
Let us talk about ONGC.
The Irregular Flat structure caught many off guard. Did you get trapped? Because if the current wave unfolds impulsively, which it just started from the highs of 345, then welcome to reality!
Warning Through Last Idea in April 2024
As shown in the chart snapshot, how Irregular Flats look has been illustrated next to the price chart. I have depicted the irregular path of flats that could unfold.
This is how markets deceive, creating irregular structures that mislead traders. Elliott Wave calls this pattern an Irregular Flat—a trap that looks bullish before a sharp reversal wipes out weak hands.
The Lesson?
Patterns speak… if you listen carefully.
I shared my insights long before the structure unfolded—and yet, if you got trapped, you now know why.
Catch me later with another exciting idea of WaveTalks, Market Whispers! Can you hear them?
Disclaimer:
Trading in financial markets involves substantial risks. Consult your financial advisor before making decisions. This commentary is not a solicitation to buy or sell.

KNR CONSTRUCTIONS DATE 16.022025
KNR CONSTRUCTIONS
DAY CHART
Results Impact
The company reported a 83 per cent rise in consolidated net profit during the third quarter to Rs 248.28 crore, as compared to Rs 135.68 crore in Q3FY24. However, the company's total revenue from operations slipped 15 per cent to Rs 848.1 crore, compared to Rs 9,960.1 crore year-on-year (Y-o-Y).
Overview On Company
KNR Constructions is a multidomain infrastructure project development company providing (EPC) engineering, procurement and construction services across various fast growing sectors namely roads & highways, irrigation and urban water infrastructure management. Its project execution strength primarily is in road transportation engineering projects namely construction and maintenance of roads, highways, flyovers and bridges wherever integral to the projects undertaken.
Key Highlights From Balance sheet
Market Cap ₹ 6,935.25 Cr II Enterprise Value ₹ 6,700.64 Cr.
P/E 8.17 II P/B 1.79
Book Value (TTM) ₹ 137.59 CASH II ₹ 234.60 Cr.
DEBT ₹ 0 Cr II Promoter Holding 48.81 %
EPS (TTM) ₹ 30.18 II Sales Growth 9.27%
ROE 16.57 % II ROCE 24.12%
Profit Growth
-1 %
Technical Analysis Remarks
1 Closing below 200 EMA & Symmetrical Triangle under corrective wave
2 It will have a projection wave A around 220
3 We will review it again around 220 based on divergence at rsi & price action
Regards,
Ankur

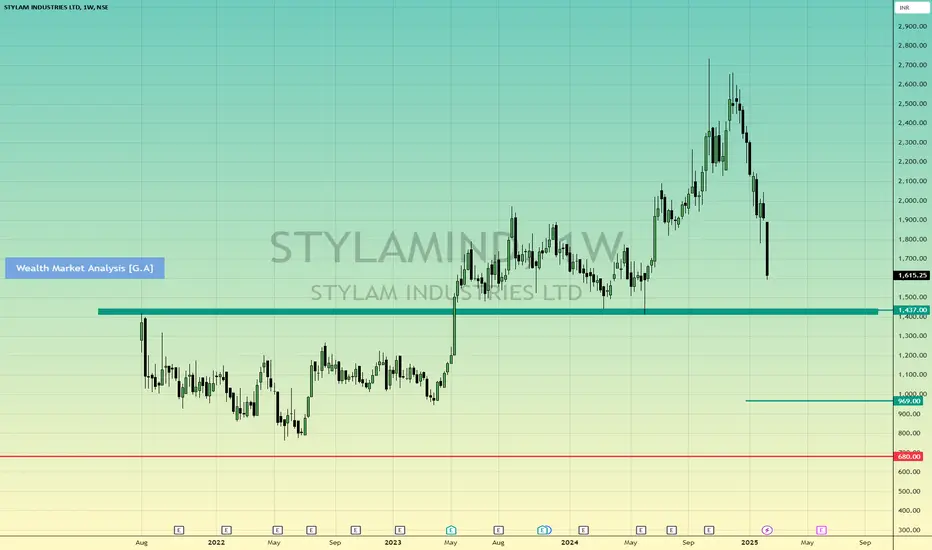
STYLAMIND CMP 1615Increase in FII & DII holding.
🔑 Key Points
👉 Profit Before Tax (PBT) has increased from ₹6 Cr (2013) to ₹168 Cr (TTM), reflecting strong financial growth.
👉 Earnings Per Share (EPS) has surged from ₹2.79 (2013) to ₹76.95 (TTM).
👉 The company is generating strong cash from operations, covering investment needs while managing debt repayments.
From top stock is down by 40%. Heading for previous breakout support.
Lower price of potential supports are marked and place to look for buying.
Personal Research before investing.
Happy Investing
Girish Anchan
W.M.A
Justdial- keep a watch in the range of 700Just dial is looking very good, one can start accumulating in the range of 700-800, volume strength is still there, keep a close watch, only for education purpose

Redington cmp 245.26 by Weekly Chart viewAdd the stock to your watchlist for New ATH levels creation on the way
Redington cmp 245.26 by Weekly Chart view
- Volumes have burst out exponentially over last few weeks
- All Major Technical Indicators EMA, MACD, RSI trending very positively
- Weekly Support at 216 > 183 > 152 and Resistance ATH 248 and every New ATH
- Stock Price traversing within the Rising Price Channel and has hit ATH 248 last week
- Also Multiple Bullish Rounding Bottoms formed by considerate VCP Pattern too can be seen

Unlocking Breakouts with the Symmetrical Triangle PatternUnderstanding the Symmetrical Triangle Chart Pattern
Hello Traders!
Today, we’ll discuss one of the most powerful chart patterns used to predict breakout opportunities — the Symmetrical Triangle . This pattern is a sign of market consolidation, where price is moving within a narrowing range, and a breakout is expected once the price escapes from this converging trend.
The Symmetrical Triangle consists of two trendlines:
Ascending Trendline : Connecting the rising lows.
Descending Trendline : Connecting the falling highs.
Key Characteristics of the Symmetrical Triangle Pattern:
Consolidation Period : The price moves between the two trendlines, showing decreasing volatility.
Breakout : Once the price breaks above the upper trendline (ascending trendline) or below the lower trendline (descending trendline), it signals a strong trend continuation or reversal.
Volume Analysis : Volume usually decreases during the consolidation phase, followed by a surge in volume during the breakout, confirming the direction.
How to Trade the Symmetrical Triangle?
Entry Point : After the breakout occurs (above the ascending trendline or below the descending trendline), enter the trade in the direction of the breakout.
Stop Loss : Place a stop loss just below the breakout level to protect your position from false breakouts.
Target : The target can be estimated by measuring the height of the triangle from the base and projecting that distance from the breakout point.
Example of Symmetrical Triangle in Action
In the Godfrey Phillips India chart , we can see a Symmetrical Triangle forming between 2021 and 2023. The price broke out of the pattern in late 2022, giving traders a strong upward momentum. Based on the measured move, the target was met after a clear breakout above the ascending trendline , which resulted in a price rise of 42.37%.
Conclusion
The Symmetrical Triangle is a reliable continuation pattern that provides great trading opportunities. Make sure to watch for volume confirmation during the breakout, and always use a stop loss to protect yourself from unexpected reversals.
Happy Trading! 🚀📈

ZYDUSLIFE Bottomed-out for High RaiseZydus Lifesciences Ltd. (Zyduslife)
My Stock View and Opinion:
Q3 FY25 net profit up 30% YoY to ₹1,023.5 crore. Revenue up 17% YoY.
Strategic Moves: Agreement with CVS Caremark to add Zituvio and combination products to its formulary.
Product Pipeline: Building a niche product pipeline in the US generics market.

CreditAcess Grameen Standing near a crucial trendline support!Chart of Creditaccess is quite interesting.
Stock has a trendline support from which it has bounced multiple times in past.
Recently, stock has tried to bounce with very very very heavy volumes indicating big money getting exchange.
Given the history of the stock, we should at least expect 100% upside from this level. But it ccan also be a trap and stock can breakdown from here.
A safer level to watch is would be a weekly closing above 1110.
Support is 800 WCB for stock.
On upside, stock can go to 1480, 1710, 2000++
Very very risky. It can be a bottom fishing or a trap.
Idea shared for educational purposes only. We all should just watch what will happen from here and learn from it.

Bharti Airtel Cmp 1717 dated 14-2-2025Bharti Airtel Cmp 1717 dated 14-2-2025
1. Ascending Triangle BO @ 1685
2. Price rise with Volumes
3. RSI BO
Buy above 1725 SL 1680 target 17401750-1760-1770-1780
Pattern target 1860 SL 1585

Can turn bullish from this areaplease Do your own analysis before making any decision.
According to my analysis if overall market support this stock can give decent move. Stock is around a good value area.

TCS bearish or Bullish ??TCS retesting its long trend line. After retesting it may resume upward journey.
But at same time it is making Head and Shoulder pattern. It has beoken it. So in case of bearish h&s scenerio, stock can go to 3400 level.
At 3406 there is gap also.
Tell me weather TCS will retest trendline and will go to 4800 level or it will drop to 3400 level.
