Kotak bank longCTP:1930
SL: 1730
Target: 2220
Analysis Monthly 50 MA support .
Stock is forming base for not time now.
also trend line BO
target is pervious ATH

TATVA: Positive divergenceTATVA stock is showing positive RSI and MACD divergence in daily timeframe.
… which indicates a possible reversal…
Divergence with RSI and MACD in daily timeframe;
The price is making a lower low and
the RSI and MACD are making a higher high
which indicates a possible reversal of trend.
I'm not a registered Sebi analyst. My research is done solely for academic purposes.
Please consult your financial advisor before trading or investing. I bear no responsibility for your profits or losses.
Regards,
Dr Vineet

TATA MOTORS-3-GO LONGTATA MOTORS: CMP: 706.65; RSI: 48.09
Recent correction has taken the script value to bottom of the parallel channel and taken support on weakly chart basis. Value buying can be seen at level.
Accumulation zone: 650-700
Stop-Loss : 636
Target: 850-940-1030-1130
Time Frame: 3 months

Borosil Renewables SL day candle close only, Target Trigger Price
All detail for chat. good entry at mark price only. and must stoploss minimum risk and good profit. risk ratio 1:1 to manage modified SL. This is not call, Just my idea. Please understand your risk and take full responsibility of your actions

Asso Alcohols (ASALCBR)SL day candle close only, Target Trigger Price
All detail for chat. good entry at mark price only. and must stoploss minimum risk and good profit. risk ratio 1:1 to manage modified SL. This is not call, Just my idea. Please understand your risk and take full responsibility of your actions

Motherson Sumi-Can it fly from here?Motherson Sumi is now available at a very beautiful demand zone.
It is retesting previous cup and handle breakout and also is near a trendline support.
Any bounce from this zone will give good returns in stock.
Levels are mentioned on chart. One of the best stock within auto ancillary sector.
If you trust EV theme, this stock should be on radar.

Ami OrganicsSL day candle close only, Target Trigger Price
All detail for chat. good entry at mark price only. and must stoploss minimum risk and good profit. risk ratio 1:1 to manage modified SL. This is not call, Just my idea. Please understand your risk and take full responsibility of your actions

Asian Hotels (North)SL day candle close only, Target Trigger Price
All detail for chat. good entry at mark price only. and must stoploss minimum risk and good profit. risk ratio 1:1 to manage modified SL. This is not call, Just my idea. Please understand your risk and take full responsibility of your actions

Avanti FeedsSL day candle close only, Target Trigger Price
All detail for chat. good entry at mark price only. and must stoploss minimum risk and good profit. risk ratio 1:1 to manage modified SL. This is not call, Just my idea. Please understand your risk and take full responsibility of your actions

#ARIHANTCAPARIHANTCAP is a small cap stock that is looking for explosive move. The fundamental and technicals are looking well poised.
Please note - This is my analysis and not to be considered as recommendations. Please do your Due Diligence.

#VISHNUVishnu Chemicals is showing good strength both fundamentally as well as technically. In addition the Chemical sector is seeing some group movement.

SIYSIL: A Strong Demand Zone Setup with High Reward Potential!When it comes to technical analysis, understanding demand zones can give traders an edge in identifying potential reversal points. Demand zones represent the footprints of institutional players who significantly influence the market. These zones indicate unfilled buy orders, and when the price revisits these areas, institutions tend to buy again, leading to a reversal.
Let's dive into SIYSIL's price action and explore its technical structure!
🌟 Weekly Chart Analysis
SIYSIL is currently displaying a highly structured setup. If we analyze the weekly chart , we can clearly see a well-defined Rally-Base-Rally (RBR) Demand Zone . The strength of this demand zone is reinforced by the fact that it broke a previous significant resistance level and formed an all-time high .
📊 Daily Chart Confirmation
Upon shifting to the daily chart , the same demand zone is clearly visible. A strong follow-through from this zone has resulted in a powerful imbalance, further validating the structure.
Moreover, there are currently no nearby supply zones that could act as resistance, making this demand zone even more significant.
💡 Observations
Act of Polarity: The concept of polarity further strengthens this structure— the previous resistance level has now turned into support , aligning perfectly with the demand zone.
Market Conditions: While this setup appears strong, it's essential to consider the current weakness in the overall market . Even well-defined structures can face challenges in uncertain conditions, so risk management is crucial.
📈 Final Thoughts
SIYSIL presents a structured demand zone setup with multiple confirmations on both the weekly and daily charts. The alignment of the demand zone with previous resistance-turned-support adds a strong layer of confluence.
Lastly, thank you for your support. Feel free to ask if you have questions.
🚀 "A successful trader is not the one who never loses but the one who learns to manage losses."
Disclaimer: This analysis is purely for educational purposes and is not intended as a trading or investment recommendation. I am not a SEBI-registered analyst.

CarTrade Tech- CnH FnP. Keep on Radar📊 CarTrade Tech - Technical Analysis 🚗
Reason for Picking This Stock:
CarTrade Tech has been in an uptrend since March 2023, trading within a rising channel. The stock tends to take support near the 50 DMA and the channel bottom, showcasing strong demand in those areas.
✨ Key Highlights:
1️⃣ Breakout from 3.5-Year Resistance: The stock has broken above a significant 3.5-year-old resistance level of ₹1,622.85 and gave a weekly closing above it.
2️⃣ Chart Patterns:
Cup and Handle (CnH) formation near the 3.5-year resistance.
Flag and Pole (FnP) pattern adds conviction to the breakout.
3️⃣ No Overhead Resistance: The left side of the chart shows no major resistance, providing room for upside movement.
4️⃣ Relative Strength in Market Correction: The stock has held strong during the broader market correction.
🎯 Trading Levels & Risk-Reward (R:R):
Entry: ₹1,835
Stop Loss (Closing Basis): ₹1,514
Positional Target: ₹2,543
SL %: 17.5%
R:R: 1:2
📌 How to Trade:
✅ Wait for Confirmation: A clear breakout with volume and a wide-range candle will strengthen the setup.
✅ Small Position Size: As the market trend is bearish, trade with reduced risk.
✅ Pullback Entry: Look for a pullback to the 50 DMA region or channel bottom for better risk-reward entries.
✅ Add on Base Formation: If the stock consolidates above the breakout level and breaks out again, consider this as a further entry point.
⚠️ Risk Considerations:
🚨 The broader market is trading well below the 50 DMA and 200 DMA, with a death cross in play. Committing large capital at this point may not be advisable.
🚨 This is a pure technical call on a fundamentally weak company. Perform your own due diligence before trading.
💡 Key Points to Watch:
1️⃣ Clear breakout from the Flag and Pole (FnP) and Cup and Handle (CnH) patterns.
2️⃣ The channel top may act as a resistance, so monitor price action near those levels.
3️⃣ Broader market stabilization above the 200 DMA and 50 DMA is crucial for larger capital deployment.
🚦 Final Thoughts:
CarTrade Tech is showing relative strength in a falling market—a key factor for stock selection during corrections. The intention is to highlight opportunities in stocks performing well despite broader market weakness. Trade cautiously and stick to strict risk management. 💪 and do not wait for target to be achieved in this market condition. Try to book partial and trail SL.
📉 Disclaimer: This analysis is for educational purposes only and not financial advice. Always consult your financial advisor before making any trading decisions.

#KFINTECH - Ready for some positive movementsThe stock has a good mix of fundamentals and technicals. It appears poised for movement towards the upside. In addition, presently the investment brokerages and depositories are seeing some group movement.

WELCORPAnalyzed Welcorp and found good opportunity considering the Technical Setup and Fundamentals. There is potential upside of 20-25%. I would suggest the entry to be around 1-2% lower than the CMP and let the stock consolidate for 1-2 days. Thereafter, entry can be taken with MAs as the SL.

PARSVNATH DEVELOPERS LTD.ascending triangle pattern weekly chart breakout targate 1 33 , targate 2 37 targate 3 42 stop loss 22 entry 25.50

Ride the trend reversal for CaplinStock name: Caplin Point Lab.
Structure: Very bullish and consolidating.
Idea behind the trade: Good Tap into weekly OB showing signs of reversal by impulse move to the upside leaving volume imbalance zones. Also healthy pullback.
Waiting for the next minor pullback on key levels of VI and FIB for sniper entry.
Ride the trend till the potential sell zones. Can also push it to the high to be aggressive. (Trail your SL to make the most of it)

VoltasPrice was falling for few days and taken support from 1340 zone and moving up. Friday price consolidated in a narrow range. Break out can give good movement.
Buy above 1384 with the stop loss of 1372 for the targets 1396, 1410, 1426, 1442 and 1456.
Do your own analysis before taking any trade.

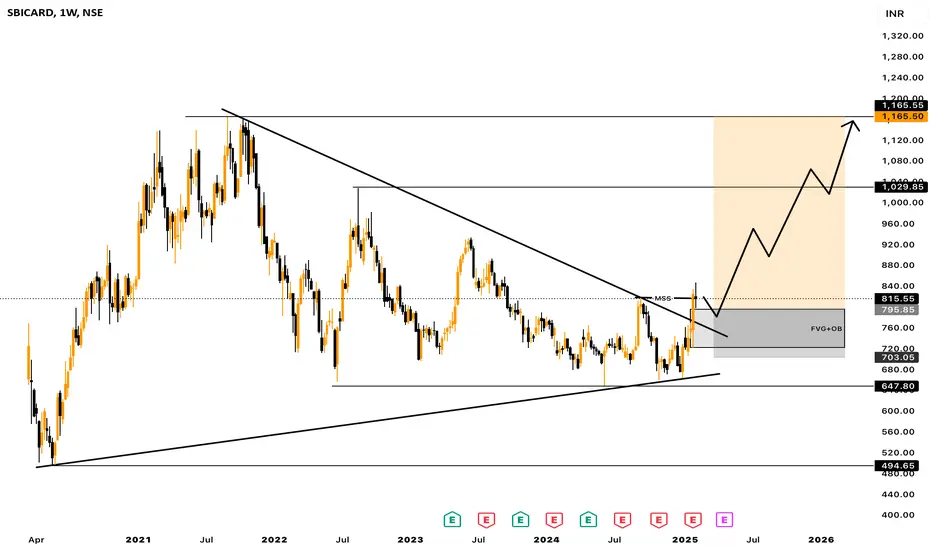
Technical Analysis: Symmetrical Triangle Breakout in SBICARD
• The weekly chart of SBI Cards (SBICARD) shows a symmetrical triangle pattern that has been forming since mid-2021.
• The stock recently broke out of this pattern, indicating a potential trend reversal or continuation move depending on broader market conditions.
• Resistance Breakout: The upper trendline, which acted as resistance, has been breached, and the stock is now retesting the breakout level (~800).
• Volume Confirmation Needed: To validate the breakout, an increase in volume would be ideal.
Fundamental Analysis: Mixed Earnings Performance
• Earnings Per Share (EPS) Trends:
• Q3 FY24 EPS came in at 4.25, missing estimates by 31.16%—a significant negative surprise.
• Q2 FY24 EPS also missed estimates by 4.51%, while Q1 FY24 had a 4.59% miss as well.
• The company has shown inconsistent earnings, which could cause volatility despite the technical breakout.
• Revenue Growth:
• Q3 FY24 revenue was ₹46.19B, exceeding estimates by 10.06%.
• Q2 FY24 revenue missed expectations by 3.01%, while Q1 FY24 was also slightly weak.
• This suggests that while top-line growth is strong, profitability (EPS) is under pressure due to either higher costs or operational inefficiencies.
Investment View: Cautious Buy with Risk Management
• Technical View: The breakout above the triangle is bullish, but the stock must sustain above 800-820 for confirmation. If it does, next resistance levels are 900 and 1000.
• Fundamental Concerns: Weak earnings growth is a risk factor. The next earnings (April 2025) will be crucial.
• Buying Strategy:
• Entry: If the stock holds above 800-820, it can be bought with a target of 900-1000.
• Stop Loss: 750-770 zone (below the breakout trendline).
• Risk Factor: If broader market sentiment weakens or earnings disappoint further, the breakout might fail.
Conclusion: A breakout trade is valid, but weak earnings make it a cautious buy with a tight stop loss. If fundamentals improve, the rally could sustain.
Tata Steel cmp 138.31 by Weekly Chart viewTata Steel cmp 138.31 by Weekly Chart view
- Volumes running close to Avg Traded Quantity
- Positively trending Technical Indicators EMA, MACD, RSI
- Resistance Zone 136 to 139 Price Band may be a probable Support Zone
- Price closure above Resistance Zone for few days would drive up the momentum for a fresh breakout opportunity

APOLLO MICRO TAKING A STEP BACK BEFORE JUMPAfter a prolonged consolidation, Apollo Micro is now on the move. It's experiencing a slight retracement as investors took profits yesterday when it reached 128, a level not seen in a long time. Following this brief pullback, the stock appears poised to break through its barriers and ascend to new highs.

QGO- the new multibagger stockQGO is beginning its uptrend journey. It's time to purchase this stock at very low levels. After the target is hit, new buying zones will be identified and shared.

Eicher Motor, Swing BuyEicher Motor broke out with high Volume and retraced 61.8% fib level.
Price is moving up with RSI also Strong, It is good swing with 1:2 Risk Reward where SL is 6-7% and Target is 10-12%
