NVDACMP - 253
SL - 204
Target - 270, 300, 350+
Breaking out of downtrend
Safe players can buy after closing above TL

#NETLIX ready for a possible ReversalLooking at all the signs, if we put global news aside and think about TA, I feel #NFLX looks ready for a Trend Reversal and Targets 450-500$ first. I've shared detailed analysis in the chart. Do follow and like this idea to get more interesting updates.


BABA: SELL at 87 SL 89 TGT 70SELL BABA at 87 Target of 70 ad Stop-loss of 89
For education purposes only.

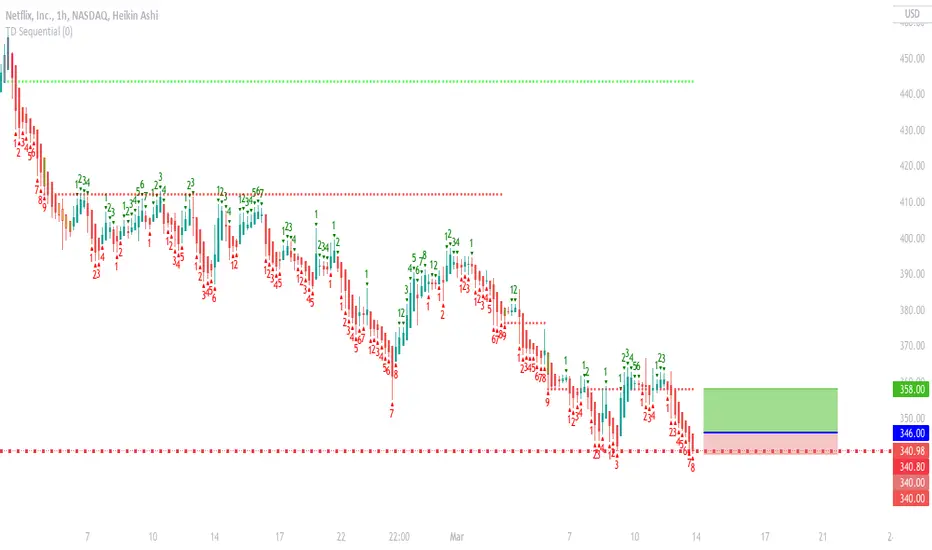
Buy NetFlix (NFLX) above 346Buy Netflix (NFLX) only if it goes above 346 with Stoploss of 340 and Target of 358
for education purposes only.
Microsoft (MSFT) is a buy ONLY ABOVE 288Microsoft MSFT seems to be a buy only above 288 with Stop-loss of 287 and a Target of 292
for educational purposes only.

Short Amazon For Intraday Short Amazon at 2986
Target - 2900
Sl - 40 Point
There is a Trend revealing Parten in Amazon which can give his fuel to hit a low point. It looks like a trap

AMAZON Consolidation Monthly-TimeframeIts very important that the price remains within the parallel consolidation channel. The price should remain in the 2880-3550 consolidation range. As soon a monthly closing happens above or below this channel , we can expect a violent move in that side. Till then bid your time and watch out the VCP pattern playing out


Facebook nearby support levelsFacebook nearby support levels , investors can see good buying levels.


Good Stock.... Target 51....Good Stock for Long ......Target 51..... Technical and fundamental Good ...........

TSLA at Multi Year resistance NASDAQ:TSLA After hitting multi year resistance line now in a consolidation mode. As per the pattern history will go for long consolidation before breakout? Educational purpose analysis not a reco! DYOR!

Technical Analysis of ETSYDisclaimer: I don’t own shares of ETSY.
The below analysis is not a trading or investment recommendation & is only for learning purpose.
1.Etsy has been in a downtrend with price trading under the 200 DMA.
2.Price has been in a lower high-lower low structure with the most recent lower high pivot around $148.
3. Price has formed a bullish engulfing bar today engulfing the last two red candles closing just under the long-term downtrend line & at support.
4.The bullish engulfing bar is accompanied by massive volume demonstrating massive commitment from the bulls.
5. With the massive volume, if price crosses the last lower high at $148 & stays above it, the immediate target would be to reclaim the 200DMA around $200.
6. RSI shows a positive/bullish divergence which will be confirmed once price breaks above the trendline.
7.Immediate resistance levels are around $131, followed by $148 & $200.
8. Support at $109 to be respected, barring which the stock could slip into a further downtrend.
All the best!

Netflix ready to moveNetflix has formed a pennant pattern and currently its in a position to either give a breakdown or a breakout from this point. A proper trade can be initiated after either of those happens with good volumes.

Oracle?It can bounce back to $90 and again go down.
Once it cross the $90 then we can expect fresh head start.

Technical Analysis of Cognizant Technology Solutions ( CTSH )Disclaimer: I don’t own shares of Cognizant Technology Solutions ( CTSH )
The below analysis is not a trading or investment recommendation & is only for learning purpose.
1. CTSH entered a long-term uptrend in Nov’21 with price closing above the 200MA.
2.Price broke the previous high around $83 after having retraced 38% to $66.
3.Price has formed a double top structure on the daily chart with the neckline around $80 showing failure of bullish momentum to break above the previous high around $92 & sustain higher.
This is also supported by unconfirmed RSI bearish divergence on the daily chart ; however, price hasn’t broken the trendline yet. A break of the trendline would confirm the bearish divergence between price & RSI .
4.Price is receiving support around the high of the previous consolidation area around $82 indicating no strong interest on the seller’s side to break the $82 support & take it lower.
5.Price volume analysis indicates that the current up move $66 to $92 has not been backed by a significant increase in volume . A strong uptrend is usually supported by a large increase in volume igniting the move followed by bouts of high volume to keep the momentum intact, both of which are missing.
6. For the next leg of up move, price needs to have a close above $93 with increased volume & sustain itself.
7. A break below the neckline around $80 could push the price down to the 200MA around $77 being the first level of support.
8. In the long term after the resistance at $93 is taken out, the stock should eventually reach $109 completing an AB=CD pattern.
All the best!


Technical Analysis of Pacific BioSciences (PACB)Disclaimer: I own shares of PACB at the time of publishing this analysis.
The below analysis is not a trading or investment recommendation & is only for learning purpose.
1.PACB has been in a major downtrend like most other small caps & biotech stocks.
2.The stock is way below the 200DMA which sits around $25.
3.The spread between the 20DMA & 200DMA is also very wide indicating a pull back to the 200DMA.
4. The stock bottomed at $9.04 which was followed by some buying pushing the price up to $11.65 while still being under the 20DMA
5. Over the last two weeks the stock has been consolidating & with today’s huge igniting volume, the stock has seen a decisive close
above the 20DMA & formed a massive green Marubozu candle engulfing 11 other candles to it’s left.
6. Today’s price action shows a strong bullish sentiment & the first major target for the stock should be the 200DMA around $25.
7.While the stock tries to reclaim the 200DMA, it is expected to face resistance around$14, $15.5, $18-$20 (fairly strong resistance)
& $22-$24.
8. On the higher time frame charts as well, namely weekly & monthly, PACB has been forming a falling wedge pattern which
considered a bullish pattern.
9. Key areas of support would be the mid-point & low of today’s Marubozu candle, followed by the low point of the downtrend at
$9.04.
10.A close below $9.04 provides could mean further acceleration of price downwards to the next level of support in the $7.5- $8
area.
All the best!

AMD NASDAQ Its has M-reversal Pattern.A double top is a pattern for two successive peaks, which may or may not be of the same price levels. The pattern looks like an M. A double top pattern occurs when the stock fails to continue the uptrend in its second attempt as it meets resistance pressure from sellers at its highs. In a market rally, sellers suddenly take control and push the price downward. Price begins to retreat to a level that is considered attractive for buyers. The buyers enter the market and push the price up to make a second top where it finds new selling pressure, which pushes the price down past its last trough. When the price declines below the low point established between the two tops, a double top pattern has been activated.

Technical Analysis of ExpediaDisclaimer: I don’t hold shares of Expedia
The below analysis is not a trading or investment recommendation & is only for learning purpose.
1. Expedia is breaking out from it’s previous life time high after forming a rounding bottom on a major time frame.
2. A failed test was seen with price re-testing the resistance turned support level around $188 on the daily time frame indicating
strong bullishness.
3. The stock pulled back to the 38.2% Fibonacci level on the monthly time frame before finding support.
4. Despite witnessing selling pressure indicated by the long upper wick on the weekly candle last week, the stock held the
resistance turned support so far.
5. In the longer term, based on Fibonacci levels, Expedia could face resistance around the levels of $230, $250 & $280.
6. The $280 area also marks the completion of the AB=CD pattern & coincides with the 1.618 Fib level.
7. The stock also now trades above the 200 MA & 20 MA on both daily & weekly time frames. Price trading above 20MA on the daily
time frame demonstrates institutional support & interest.
All the best!
