Trading in channelPrice trading in channel and closing outside the channel will be good for the price to move upside in good direction.

SBI Bank - Will pains for the banking king continue?SBI bank has a portfolio stock for many, and one can only imagine the pain in portfolios of those investors who are still holding the stock.
Why is this stock bleeding even though YoY performance has been good? Watch this video to know.

Trent - Is the share ready to dress up green for investors?Trent, which manages brands like Zudio and Westside has been in news for just for its quarterly results but also dipping 15% in last 3 trading session. Why is this share dressed red even though the results are not as bad.
Most likely, it is in a good buy zone now. I have shared my point of view in this video here. Please watch.

Adani Ports: On the Brink of a Major Breakout or Reversal?"1. Current Price Action and Trend
The stock is trading at ₹1,164.05, which is just above the S1 support level of ₹1,081.35.
A significant bullish candle has formed this week, showing a strong reversal attempt from recent lows. It’s up 7.37%, indicating positive sentiment.
However, the stock is still below its previous highs (R2 level around ₹1,353.15), suggesting it's in a consolidation zone.
2. Key Support and Resistance Levels
Immediate Support (S1): ₹1,081.35 – The stock tested this level and reversed sharply.
Deeper Support (S2): ₹1,005.45 – If the S1 level breaks, this would act as the next potential support.
Resistance (R1): ₹1,169.40 – The stock is close to this resistance, which aligns with the top of the current bullish move.
Further Resistance (R2): ₹1,353.15 – A breakout above ₹1,170 could push it toward this level.
3. MACD Analysis
The MACD histogram is still in the negative zone, and the lines are below the zero line.
However, the gap between the MACD and signal lines is narrowing, indicating weakening bearish momentum.
A bullish crossover on the MACD could confirm a trend reversal.
4. Fibonacci Pivot Insights
The Fibonacci pivot levels give a clear roadmap:
The stock respected R3 (previous high) around ₹1,600 before a steep correction.
The price is currently hovering around S1, a critical zone that could either act as a launchpad or lead to further declines.
Upside potential toward R1 or R2 is evident if momentum builds.
5. Pattern Observations
Double Top Formation (Longer Term): There is a potential double-top pattern near ₹1,600 (R3), which led to the sharp decline. This is a bearish pattern but already played out partially.
Falling Channel: The recent correction appears to be part of a falling channel, with the stock now attempting to break out.
Risk-Reward Zone: The marked blue box on the chart shows a low-risk entry zone, with the stop-loss below ₹1,055 and upside targets toward ₹1,353 (R2).
6. Possible Scenarios
Bullish Case
A breakout above ₹1,170 (current resistance) could push the stock toward ₹1,353 (R2) and eventually ₹1,600 (R3).
Positive global or sector-specific news could act as a catalyst.
The MACD crossing into the positive territory would confirm the trend reversal.
Bearish Case
If the stock fails to sustain above ₹1,081 (S1), we could see a move down to ₹1,005 (S2) or even ₹900 (psychological support).
Continued bearish momentum on MACD could lead to lower levels.
Sideways Case
If the stock consolidates between ₹1,081 and ₹1,170, it would indicate indecision. Watch for volume spikes as a potential breakout indicator.
7. Broader Context
On a longer-term basis, the stock has seen significant volatility. The previous high at ₹1,600 serves as a strong resistance zone. A sustained breakout above this level would indicate multi-year highs and renewed bullish sentiment.
On the downside, ₹1,000 acts as a critical psychological support.
Final Take
For short-term traders, the risk-reward looks favorable with stop-loss below ₹1,055 and targets near ₹1,353.
For long-term investors, accumulation in the ₹1,000–₹1,100 zone could be considered if broader market conditions support recovery.
Keep an eye on global macroeconomic factors, sector trends, and company-specific developments, as they could impact price movements.

Hindustan Zinc (HZL) Breakout: Is This the Start of a Big Rally?Hindustan Zinc Limited (HZL), established in 1966, is a leading Indian mining and resources company specializing in the production of zinc, lead, silver, and cadmium. As a subsidiary of Vedanta Limited, Hindustan Zinc holds a dominant position in the Indian zinc market, commanding approximately a 75% share.
Financial Performance:
In the quarter ending September 30, 2024, HZL reported a net profit of ₹23.27 billion, marking a 35% increase from the previous quarter.
This growth is attributed to higher zinc prices driven by increased demand from China and global supply concerns.
Revenue from silver, its second-largest business segment, increased by 20% during the same period.
Stock Performance & Trends:
On October 30, 2024, Hindustan Zinc reached a high of ₹575.
The stock later declined, hitting a low of ₹414.70 on January 13, 2025.
As of now, the price has recovered to ₹468, indicating a moderate rebound from its recent low.
Technical Analysis:
Falling Wedge Breakout: In the daily time frame, the price formed a falling wedge pattern, which has now given a breakout confirmation.
Strong Price Action on Feb 5th:
Price surged by 6.99% on February 5, 2025, signaling bullish momentum.
This was accompanied by a significant volume increase of 3.71M, compared to the last 30-day average volume of 1.3M.
The volume increased by approximately 185.38%, confirming strong buying interest.
Key Reversal Zone:
If the price faces rejection from the current level (LTP ₹468), a potential reversal zone lies between ₹432 to ₹443.90.
Resistance Levels:
Resistance 1: ₹500
Resistance 2: ₹553
Resistance 3: ₹630
Strategic Initiatives:
HZL is actively pursuing a transition to renewable energy, with plans to power its operations entirely through renewables within the next five to seven years.
This initiative aligns with India's broader strategy to reduce greenhouse gas emissions and increase the share of non-fossil fuels in electricity generation.
Ownership & Divestment:
The Indian government, which holds a 29.54% stake in HZL, announced plans to sell a 2.5% stake valued at approximately $634 million in November 2024.
Earlier in 2024, Vedanta sold a 3.3% stake in the company.
Conclusion:
Hindustan Zinc Limited remains a fundamentally strong company, benefiting from global metal demand and a steady dividend policy. However, recent stock fluctuations and technical patterns suggest strong bullish potential following the falling wedge breakout and volume surge. Traders should watch the ₹432-₹443.90 reversal zone if a pullback occurs, while ₹500, ₹553, and ₹630 serve as key resistance levels for further upside.

eicher motors
#EicherMotors has completed a breakout retest, and the RSI is at 60. It may reach the 5800-6000 level in the coming days

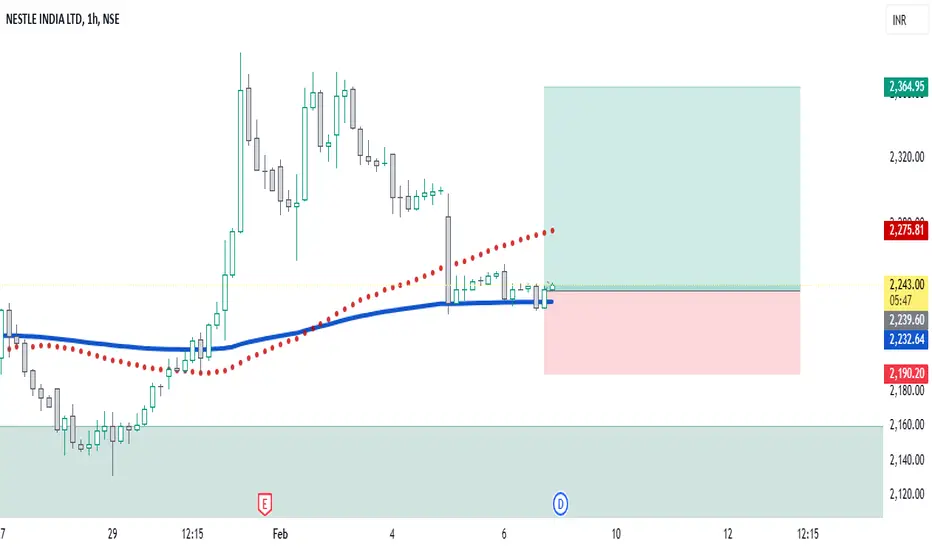
NESTLEY POSITIONAL TRADINGSwing Trading 06-02-2025
Entry : 2239, Stop : 2190, Target : 2365
Rsi-14, 40 reversal setup.
SWING OBSERVATION - TRENT LTD.Script is showing a Lower Low Lower High formation after getting rejection from 0.6 fib (6200 levels) and breakdown of major support . Further breakdown of support trendline around 5600 can lead to more downside

BUY TODAY SELL TOMORROW for 5%DON’T HAVE TIME TO MANAGE YOUR TRADES?
- Take BTST trades at 3:25 pm every day
- Try to exit by taking 4-7% profit of each trade
- SL can also be maintained as closing below the low of the breakout candle
Now, why do I prefer BTST over swing trades? The primary reason is that I have observed that 90% of the stocks give most of the movement in just 1-2 days and the rest of the time they either consolidate or fall
Round Bottom Breakout in SENORES
BUY TODAY SELL TOMORROW for 5%

#REDINGTON - Potential Break Out / Feb'25📊 Script: REDINGTON
Key highlights: 💡⚡
📈 IH&N Formation in Weekly chart.
📈 IH&N Formation in Daily chart also
📈 Went into a Side Ways consolidation for over a Nine months.
📈 Volume spike seen in past
📈 MACD Cross Over.
📈 One can go for Swing Trade.
🟢 If you have any questions regarding the setup, please feel free to leave your inquiries in the comments, and I will respond promptly.
BUY ONLY ABOVE 233 DCB
⏱️ C.M.P 📑💰- 226
🟢 Target 🎯🏆 – NA%
⚠️ Stoploss ☠️🚫 – NA%
⚠️ Important: Always Exit the trade before any Event.
⚠️ Important: Always maintain your Risk & Reward Ratio.
✅#Boost, #Like & #Follow to never miss a new idea! ✅
Disclaimer: I am not SEBI Registered Advisor. My posts are purely for training and educational purposes.
Eat🍜 Sleep😴 TradingView📈 Repeat 🔁
Happy learning with MMT. Cheers!🥂

SBI : Coming close to good value BUYSBI Q3 results are due later today, but expectation is of overall flattish to positive results.
- Technically, SBI has strong support in Monthly charts from 600 - 650 zone, followed by another zone of 540 -580 (from which breakout happened earlier)..
- Similarly, the zone of840 - 870 will act as a strong resistance in short term for the stock too.
- With P/E ratio of ~ 8.8 (< 5 year average of 11.1) & P/B ratio close to 5 year average. It offers comfort of NOT a big downside risk in SBI stock prices.
#SBI #Stoxsense

GREAVESCOT ROUNDING BOTTOM BREAKOUTLong term investment for the target of : 580, after a rounding bottom break out retest and then move on for next levels. invest every retest and bounce.

Long TatasteelTatasteel looks good in wave count and gaan cycle , If closes above 135 then we can see price near 150 SL below 130

Price took recent supportPrice took its recent bounce from the level.
Closing above marked level is important for the positive price action

Learn Price ActionStock create Lower high and Lower lows. This is a negative price action.
Until changes price action from negative to positive.

RBL BANK - Sideways to bearish journey aheadAs we can see stock doing sideways journey from past quarter between 160 - 180
Finally trend line has also been broken recently
Now at this point it seems that stock will resist one final time at previous resistance area of 178 - 180
If happens so, it may also try to give a pull back till the trend line or previous support area of 158 - 160
Post that it may trend upside again
Lower time frame confirmation is compulsory for trade
Trade Cautiously !

Jio Finance Technical Weekly Time Frame#jiofin Financial Services #JFS is a significant player in the Indian financial sector, known for its digital-first approach to financial services. Here's an overview based on recent information #

$NSE:LTF NSE:LTF
📊 **L&T Finance Stock Chart Analysis** 📉
In the L&T Finance stock chart, I can identify a clear descending channel pattern forming in recent months (visible from October 2023 to January 2025). This pattern is characterized by:
- Two parallel descending trendlines containing the price action.
- The upper trendline connecting the lower highs (around 151.95, 145.87).
- The lower trendline connecting the lower lows (134.10, 129.20).
Currently, the price appears to be testing the upper resistance line of the channel around the 146 level. The channel has a slight downward slope, indicating an overall bearish bias during this period. However, the recent price action shows some bullish momentum as it's moving towards the upper boundary of the channel. The trading volume has been relatively consistent throughout this pattern formation, with some notable spikes during key price movements. The RSI indicator shown at the bottom also suggests increasing momentum with the recent upward movement. 📈
### Potential Breakout Analysis 📊
- The current price (146.07) is testing the upper resistance line of the descending channel.
- The RSI is showing strength, moving above the 50 level with positive momentum.
- Volume has increased recently, supporting the upward price movement.
### If a Bullish Breakout Occurs Above 146-147 Levels 📈
- **First Target:** Around 151.95 (previous swing high).
- **Second Target:** Could extend to the 159-160 zone (based on previous support turned resistance).
- The height of the channel is approximately 16-17 points (145.87 - 129.20), so projecting this from the breakout point gives a potential target of 162-163.
### Key Points to Watch 👀
- **Volume Confirmation:** Should see above-average volume on breakout.
- **RSI:** Should maintain above the 50 level.
- **Price:** Should close above the channel resistance for confirmation.
### Risk Management ⚠️
- Strong support exists at the 140-141 zone.
- Stop loss can be placed below the 134-135 level (channel support).
**Disclaimer:** These are technical projections and actual price movement may vary. It's important to use proper risk management and not solely rely on technical analysis for trading decisions. 📉📈

Sunflag IronStock: Sunflag Iron
Ex: NSE
Structure: Long term uptrend
Medium term: lower high lower low into aggressive buying leaving OB
Strong term: with a small buying pressure in Nifty, stock is looking poised to make an upmove.
Seeing impulse buying at the order block validating the OB.
Taking an entry on the OTE zone with stop loss belong the swing low.
Stay cautious given the corrective phase of NIFTY.
Look to book profits every 5% according to your risk appetite.

Ksolves Breakout in DTF !!This share is Breaking out from it's 10 month old Trend line.
Closing above 1070 can make this share to retest its ATH
CMP: 1004
Dip: 950
Tgt: 1050,1100,1150,1200,1250+
SL: 920 WCB
Chart only for Educational purpose !!

The trend is strongIPCA CMP 1470
Elliott- thats an expanded flat corrective pattern on the right. The C wave is 1.618 of A. Hence to me the correction is over.
Fibs- the correction has halted at 50% from a higher swing. This is strength.
RSI- the oscillator has halted above the bull zone. Hence the trend is intact.
Conclusion - to me this is still a very good buy as the trend is intact and strong. The Pharma sector is yet another sector that should outperform the Nifty.

Polycab - Reaching Resitance* Stock now getting ready to reach near its strongest resistance area of 6165 - 6300
* It also happens to be a flip zone so stock will surely try to get stuck and even turn bearish from the same level
* Lower Time Frame Confirmation is compulsory to enter
* Downside target near 5250 -5200 can be expected
* Right now it is in a wait n watch situation
* As market volatility is on the higher side trade cautiously

Breakout possible in VadilalBreakout possible in Vadilal, with good trend. You can plan for playing long in it. With your own risk.
