ROI in the stockStock gave returns over the years of 4 Yrs and 1 yrs
Can the stock give fresh breakout upside creating a new all time high in coming days.
Post you view in the comments

Classic VCP pattern.Bharti Airtel has been ranging since last couple of months forming a VCP pattern. Today finally it breakout due to its robust result which announced yesterday. Considering a good volume breakout, i have entered at 1650.

Signature of wave iv by RSIRSI level at wave iv should be less than that of wave ii . If it does not happen , then we can look for wave extension . Catch is wave iv should be higher than wave ii . But if RSI is lower than that of wave ii , this is a positive divergence signaling a higher top . Just observe . Enjoy the market

IEX Bullish Base Formed NSE:IEX today gave a good up move, confirming the recent base as a strong bullish base, recently it posted its monthly volumes in Jan up 16% YoY.
About:
NSE:IEX provides an automated platform and infrastructure for trading electricity units for the physical delivery of electricity.
F&O Activity:
Long Buildup in Futures with 180 PE Gaining Significant OI.
Trade Setup:
Looks like a good 1:1 trade setup with the recent base as a strong support zone, RSI and MACD trending upwards.
Target(Take Profit):
Around 206 Levels for Swing & Positional Trader.
Stop Loss:
Entry Candle Low for Swing Trader and Recent Base for Positional Trader.
📌Thank you for exploring my idea! I hope you found it valuable.
🙏FLLOW for more
👍BOOST if useful
✍️COMMENT Below your views.
Meanwhile, check out my other stock ideas below until this trade is activated. I would love your feedback.
Disclaimer: "I am not SEBI REGISTERED RESEARCH ANALYST AND INVESTMENT ADVISER."
This analysis is intended solely for informational and educational purposes only and should not be interpreted as financial advice. It is advisable to consult a qualified financial advisor or conduct thorough research before making investment decisions.

Alteration between wave(ii) and (iv) is a law of the markets Wave (iii) is exactly 2.618 of wave (i) taken from the end of wave (ii) . Wave (ii) is a flat correction . So wave iv cannot be a flat correction , as per the law of alternation , which basically means wave ii and wave iv cannot be similar. Dissimilarity can occur by price correction and by time correction . I think we will get a time correction here , if not price correction . Basically saying , avoid . If it explodes next week it will just be wave v . Always wave iv has to balance wave iv either by time of price. Regards

Bharti Airtel's Resilience Amid Market VolatilityBharti Airtel stays resilient in a volatile market, driven by exceptional profit growth.
Key points:
1. Company reported a stellar 461% QoQ profit growth for Q3, boosted by a one-time consolidation from Indus Towers.
2. Price has found heavy support at the 38.2% retracement level and faces strong resistance at the 23.6% level.
3. The stock may climb to 1778 to fill the gap and form a double top, creating a shorting opportunity.

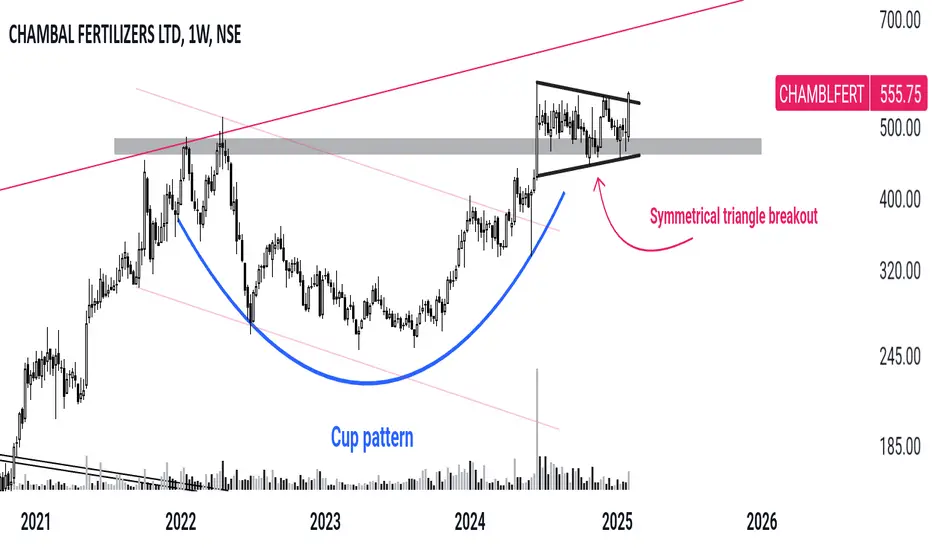
Breakout in chambal fertilizer Good opportunity in chambal fertilizer for breakout can make good up move

this is just a analysis no recommendation of buy or sellthats a good pennant formation ,can make a fake breakout for seller or buyer and then make a bigger moves in one side which will be strongest

Zomato on its road to become Eternal!Zomato declared renaming its parent company as Eternal. Businesses have been changing names of their parent company, and a few not-so-recent examples have been Meta & Alphabet.
Will this change help build a better brand or will Zomato loose its identity? This is yet to be seen.

OFSSSL day candle close only, Target Trigger Price
All detail for chat. good entry at mark price only. and must stoploss minimum risk and good profit. risk ratio 1:1 to manage modified SL. This is not call, Just my idea. Please understand your risk and take full responsibility of your actions

Mahindra & Mahindra - Firing on all cylinders!M&M, a company widely known for its SUV's & tractor business has declared its quarterly results which convey company's stellar performance on all fronts.
Is the risk reward favourable for midterm investing? Watch the video to know.

#CHAMBLFERTCup pattern breakout ✔️
RETEST ✅
Symmetrical triangle breakout ✔️
Volume ✔️
Pattern 👍
Price in ascending channel 👍
TATAMOTORS pending bounce??looks like a decent bounce is likely to happen
and lets look for a volume expansion
high probability it might touch levels these levels soon
hoping we'll see a proper price action.
From ath TATAMOTORS has fallen 40%+ already
Company has reduced debt.
Company has delivered good profit growth of 93.1% CAGR over last 5 years
stock pe @8.17

BAJAJ FINANCEBAJAJ FINANCE Is in upmove now, but after some time it will come around 7400 for retracement, then after confirmation long trade is possible for the target of 9400, lets see what happens

BUY TODAY SELL TOMORROW for 5%DON’T HAVE TIME TO MANAGE YOUR TRADES?
- Take BTST trades at 3:25 pm every day
- Try to exit by taking 4-7% profit of each trade
- SL can also be maintained as closing below the low of the breakout candle
Now, why do I prefer BTST over swing trades? The primary reason is that I have observed that 90% of the stocks give most of the movement in just 1-2 days and the rest of the time they either consolidate or fall
Trendline Breakout in WEL
BUY TODAY SELL TOMORROW for 5%

Dr. Reddy's: Cypher Pattern and Support Level AnalysisDr. Reddy's Laboratories has formed a cypher pattern and is finding support around the ₹1200 level, after a recent 15% fall. Dr. Reddy's shares are trading at ₹1250.20, reflecting a 1.85% change for the day1. The company exhibits low volatility compared to the market, with a six-month beta of 0.2055

Axis Bank: Cypher Pattern Formation and Support Zone AnalysisAxis Bank has formed a cypher pattern and is currently trading above a support zone around ₹1000, following a 30% drop from its all-time high1. As of February 6, 2025, Axis Bank's stock traded at ₹1,012.00, with a market capitalization of ₹314,265 crore1. The bank demonstrates good financial performance, as seen by a TTM EPS of ₹91.02 (+109.53% YoY) and is considered to have good to expensive valuation

SBI Stock Analysis: Support Levels and Potential ReboundSBI's stock has returned to a support level of ₹732, with a potential entry point at the long-term 3-year trendline around ₹670, following a recent 15% drop. State Bank of India's Q3FY25 net profit grew 84.32% YoY to ₹16,891 crore7. The bank's loan book also experienced substantial growth, with a YoY increase of 15.8%

balramchin heading towards 400balramchin heading towards 400 ,
exactly what u read , the recent support broke created a urge to move in bottom level
thieir is recent support atr 400
so u can bet on it

Long COALIndiaCOALIndia in short term chart looking good for buying oppurtunity
Crossing 396 then 417 zone we can expect. Crucial Resistance is 396 zone
Long COALIndia
target-1 -396
Target-2 - 417
SL- below 375

#LAURUSLABS - Potential Stage 1 Breakout 📊 Script: LAURUSLABS
Key highlights: 💡⚡
📈 C&H formation in weekly chart.
📈 Price gave a good up move
📈 Went Side Ways, wait for more consolidation near Resistance
📈 Volume spike must be seen on BO
📈 MACD Bounce
📈 One can go for Swing Trade.
BUY ONLY ABOVE NA DCB
⏱️ C.M.P 📑💰- 602
🟢 Target 🎯🏆 – NA%
⚠️ Stoploss ☠️🚫 – NA%
⚠️ Important: Always Exit the trade before any Event.
⚠️ Important: Always maintain your Risk & Reward Ratio.
✅Boost, Like and follow to never miss a new idea! ✅
Disclaimer: I am not SEBI Registered Advisor. My posts are purely for training and educational purposes.
Eat🍜 Sleep😴 TradingView📈 Repeat 🔁
Happy learning with MMT. Cheers!🥂

Nupur Recyclers cmp 101.05 by Weekly Chart view since listedNupur Recyclers cmp 101.05 by Weekly Chart view since listed
- Support Zone at 90 to 95 Price Band
- Falling Resistance Trendline Breakout seems sustained
- Stock Price is traversing along Rising Support Trendline
- Volumes are flattish and need to pump up for continued upside
- Technical Indicators like EMA, MACD, RSI seem to be getting on positive trend
- Weekly Support at 82 > 69 > ATL 57.37 with the Resistance at 120 > ATH 143.40
- Back to Back Bullish Rounding Bottoms formed and also a Rising VCP pattern has been formed

JSW Steel Short Term TradeLevel around 957 has been the resistance since a couple of months, forming a head and shoulder like pattern with neckline at the resistance zone,
Currently there has been a breakout through this level,
Thus, there is a short term trade,
tgt 1001 , sl 949
