Kalyan Jewelry: Technical Analysis and Investment OutlookFormation of Bat Pattern: Kalyan Jewelry has recently formed a Bat pattern, a bullish reversal pattern that suggests potential price increases in the near future.
Strong Support Level: The stock is currently trading at a significant support level around ₹525, which may provide a solid foundation for a price rebound.
Decline from All-Time High: The stock has already declined approximately 33% from its all-time high, indicating that it may be undervalued and presenting a buying opportunity for long-term investors.
Long-Term Investment Potential: Given the technical indicators and support levels, Kalyan Jewelry appears to be a promising option for long-term investment strategies.

view on lttsBreakout on the stock
After quarterly results & guidance stock has shown good move
Target 5550/5800
Stop loss 5000
I am just representing my views
For educational purpose only.

VIEW ON BDLGood chart structure
Stock near has closed near resistance level
Stock has formed good support near 1100 levels
Target 1350/1650
Stop loss 1130
I am just representing my views
For educational purpose only.

Amazing breakout on WEEKLY Timeframe - MBAPLCheckout an amazing breakout happened in the stock in Weekly timeframe, macroscopically seen in Daily timeframe. Having a great favor that the stock might be bullish expecting a staggering returns of minimum 25% TGT. IMPORTANT BREAKOUT LEVELS ARE ALWAYS RESPECTED!
NOTE for learners: Place the breakout levels as per the chart shared and track it yourself to get amazed!!
#No complicated chart patterns
#No big big indicators
#No Excel sheet or number magics
TRADE IDEA: WAIT FOR THE STOCK TO BREAKOUT IN WEEKLY TIMEFRAME ABOVE THIS LEVEL.
Checkout an amazing breakout happened in the stock in Weekly timeframe.
Breakouts happening in longer timeframe is way more powerful than the breakouts seen in Daily timeframe. You can blindly invest once the weekly candle closes above the breakout line and stay invested forever. Also these stocks breakouts are lifelong predictions, it means technically these breakouts happen giving more returns in the longer runs. Hence, even when the scrip makes a loss of 10% / 20% / 30% / 50%, the stock will regain and turn around. Once they again enter the same breakout level, they will flyyyyyyyyyyyy like a ROCKET if held in the portfolio in the longer run.
Time makes money, GREEDY & EGO will not make money.
Also, magically these breakouts tend to prove that the companies turn around and fundamentally becoming strong. Also the magic happens when more diversification is done in various sectors under various scripts with equal money invested in each N500 scripts.
The real deal is when to purchase and where to purchase the stock. That is where Breakout study comes into play.
LET'S PUMP IN SOME MONEY AND REVOLUTIONIZE THE NATION'S ECONOMY!

Amazing breakout on WEEKLY Timeframe - BAJAJHCARECheckout an amazing breakout happened in the stock in Weekly timeframe, macroscopically seen in Daily timeframe. Having a great favor that the stock might be bullish expecting a staggering returns of minimum 25% TGT. IMPORTANT BREAKOUT LEVELS ARE ALWAYS RESPECTED!
NOTE for learners: Place the breakout levels as per the chart shared and track it yourself to get amazed!!
#No complicated chart patterns
#No big big indicators
#No Excel sheet or number magics
TRADE IDEA: WAIT FOR THE STOCK TO BREAKOUT IN WEEKLY TIMEFRAME ABOVE THIS LEVEL.
Checkout an amazing breakout happened in the stock in Weekly timeframe.
Breakouts happening in longer timeframe is way more powerful than the breakouts seen in Daily timeframe. You can blindly invest once the weekly candle closes above the breakout line and stay invested forever. Also these stocks breakouts are lifelong predictions, it means technically these breakouts happen giving more returns in the longer runs. Hence, even when the scrip makes a loss of 10% / 20% / 30% / 50%, the stock will regain and turn around. Once they again enter the same breakout level, they will flyyyyyyyyyyyy like a ROCKET if held in the portfolio in the longer run.
Time makes money, GREEDY & EGO will not make money.
Also, magically these breakouts tend to prove that the companies turn around and fundamentally becoming strong. Also the magic happens when more diversification is done in various sectors under various scripts with equal money invested in each N500 scripts.
The real deal is when to purchase and where to purchase the stock. That is where Breakout study comes into play.
LET'S PUMP IN SOME MONEY AND REVOLUTIONIZE THE NATION'S ECONOMY!

Amazing breakout on WEEKLY Timeframe - MEDICOCheckout an amazing breakout happened in the stock in Weekly timeframe, macroscopically seen in Daily timeframe. Having a great favor that the stock might be bullish expecting a staggering returns of minimum 25% TGT. IMPORTANT BREAKOUT LEVELS ARE ALWAYS RESPECTED!
NOTE for learners: Place the breakout levels as per the chart shared and track it yourself to get amazed!!
#No complicated chart patterns
#No big big indicators
#No Excel sheet or number magics
TRADE IDEA: WAIT FOR THE STOCK TO BREAKOUT IN WEEKLY TIMEFRAME ABOVE THIS LEVEL.
Checkout an amazing breakout happened in the stock in Weekly timeframe.
Breakouts happening in longer timeframe is way more powerful than the breakouts seen in Daily timeframe. You can blindly invest once the weekly candle closes above the breakout line and stay invested forever. Also these stocks breakouts are lifelong predictions, it means technically these breakouts happen giving more returns in the longer runs. Hence, even when the scrip makes a loss of 10% / 20% / 30% / 50%, the stock will regain and turn around. Once they again enter the same breakout level, they will flyyyyyyyyyyyy like a ROCKET if held in the portfolio in the longer run.
Time makes money, GREEDY & EGO will not make money.
Also, magically these breakouts tend to prove that the companies turn around and fundamentally becoming strong. Also the magic happens when more diversification is done in various sectors under various scripts with equal money invested in each N500 scripts.
The real deal is when to purchase and where to purchase the stock. That is where Breakout study comes into play.
LET'S PUMP IN SOME MONEY AND REVOLUTIONIZE THE NATION'S ECONOMY!

Amazing breakout on WEEKLY Timeframe - BIOCONCheckout an amazing breakout happened in the stock in Weekly timeframe, macroscopically seen in Daily timeframe. Having a great favor that the stock might be bullish expecting a staggering returns of minimum 25% TGT. IMPORTANT BREAKOUT LEVELS ARE ALWAYS RESPECTED!
NOTE for learners: Place the breakout levels as per the chart shared and track it yourself to get amazed!!
#No complicated chart patterns
#No big big indicators
#No Excel sheet or number magics
TRADE IDEA: WAIT FOR THE STOCK TO BREAKOUT IN WEEKLY TIMEFRAME ABOVE THIS LEVEL.
Checkout an amazing breakout happened in the stock in Weekly timeframe.
Breakouts happening in longer timeframe is way more powerful than the breakouts seen in Daily timeframe. You can blindly invest once the weekly candle closes above the breakout line and stay invested forever. Also these stocks breakouts are lifelong predictions, it means technically these breakouts happen giving more returns in the longer runs. Hence, even when the scrip makes a loss of 10% / 20% / 30% / 50%, the stock will regain and turn around. Once they again enter the same breakout level, they will flyyyyyyyyyyyy like a ROCKET if held in the portfolio in the longer run.
Time makes money, GREEDY & EGO will not make money.
Also, magically these breakouts tend to prove that the companies turn around and fundamentally becoming strong. Also the magic happens when more diversification is done in various sectors under various scripts with equal money invested in each N500 scripts.
The real deal is when to purchase and where to purchase the stock. That is where Breakout study comes into play.
LET'S PUMP IN SOME MONEY AND REVOLUTIONIZE THE NATION'S ECONOMY!

Amazing breakout on WEEKLY Timeframe - CUBEXTUBCheckout an amazing breakout happened in the stock in Weekly timeframe, macroscopically seen in Daily timeframe. Having a great favor that the stock might be bullish expecting a staggering returns of minimum 25% TGT. IMPORTANT BREAKOUT LEVELS ARE ALWAYS RESPECTED!
NOTE for learners: Place the breakout levels as per the chart shared and track it yourself to get amazed!!
#No complicated chart patterns
#No big big indicators
#No Excel sheet or number magics
TRADE IDEA: WAIT FOR THE STOCK TO BREAKOUT IN WEEKLY TIMEFRAME ABOVE THIS LEVEL.
Checkout an amazing breakout happened in the stock in Weekly timeframe.
Breakouts happening in longer timeframe is way more powerful than the breakouts seen in Daily timeframe. You can blindly invest once the weekly candle closes above the breakout line and stay invested forever. Also these stocks breakouts are lifelong predictions, it means technically these breakouts happen giving more returns in the longer runs. Hence, even when the scrip makes a loss of 10% / 20% / 30% / 50%, the stock will regain and turn around. Once they again enter the same breakout level, they will flyyyyyyyyyyyy like a ROCKET if held in the portfolio in the longer run.
Time makes money, GREEDY & EGO will not make money.
Also, magically these breakouts tend to prove that the companies turn around and fundamentally becoming strong. Also the magic happens when more diversification is done in various sectors under various scripts with equal money invested in each N500 scripts.
The real deal is when to purchase and where to purchase the stock. That is where Breakout study comes into play.
LET'S PUMP IN SOME MONEY AND REVOLUTIONIZE THE NATION'S ECONOMY!

Amazing breakout on WEEKLY Timeframe - ASHAPURMINCheckout an amazing breakout happened in the stock in Weekly timeframe, macroscopically seen in Daily timeframe. Having a great favor that the stock might be bullish expecting a staggering returns of minimum 25% TGT. IMPORTANT BREAKOUT LEVELS ARE ALWAYS RESPECTED!
NOTE for learners: Place the breakout levels as per the chart shared and track it yourself to get amazed!!
#No complicated chart patterns
#No big big indicators
#No Excel sheet or number magics
TRADE IDEA: WAIT FOR THE STOCK TO BREAKOUT IN WEEKLY TIMEFRAME ABOVE THIS LEVEL.
Checkout an amazing breakout happened in the stock in Weekly timeframe.
Breakouts happening in longer timeframe is way more powerful than the breakouts seen in Daily timeframe. You can blindly invest once the weekly candle closes above the breakout line and stay invested forever. Also these stocks breakouts are lifelong predictions, it means technically these breakouts happen giving more returns in the longer runs. Hence, even when the scrip makes a loss of 10% / 20% / 30% / 50%, the stock will regain and turn around. Once they again enter the same breakout level, they will flyyyyyyyyyyyy like a ROCKET if held in the portfolio in the longer run.
Time makes money, GREEDY & EGO will not make money.
Also, magically these breakouts tend to prove that the companies turn around and fundamentally becoming strong. Also the magic happens when more diversification is done in various sectors under various scripts with equal money invested in each N500 scripts.
The real deal is when to purchase and where to purchase the stock. That is where Breakout study comes into play.
LET'S PUMP IN SOME MONEY AND REVOLUTIONIZE THE NATION'S ECONOMY!

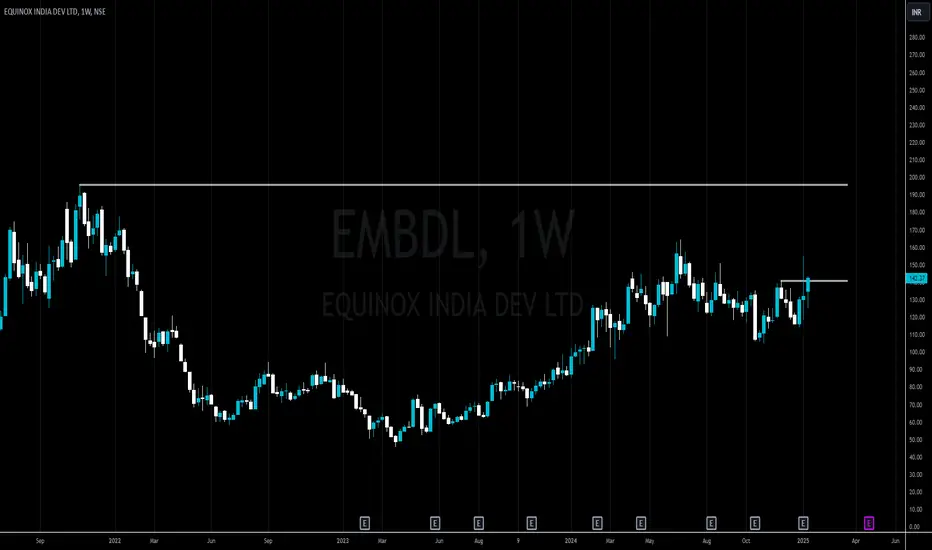
Amazing breakout on WEEKLY Timeframe - EMBDLCheckout an amazing breakout happened in the stock in Weekly timeframe, macroscopically seen in Daily timeframe. Having a great favor that the stock might be bullish expecting a staggering returns of minimum 25% TGT. IMPORTANT BREAKOUT LEVELS ARE ALWAYS RESPECTED!
NOTE for learners: Place the breakout levels as per the chart shared and track it yourself to get amazed!!
#No complicated chart patterns
#No big big indicators
#No Excel sheet or number magics
TRADE IDEA: WAIT FOR THE STOCK TO BREAKOUT IN WEEKLY TIMEFRAME ABOVE THIS LEVEL.
Checkout an amazing breakout happened in the stock in Weekly timeframe.
Breakouts happening in longer timeframe is way more powerful than the breakouts seen in Daily timeframe. You can blindly invest once the weekly candle closes above the breakout line and stay invested forever. Also these stocks breakouts are lifelong predictions, it means technically these breakouts happen giving more returns in the longer runs. Hence, even when the scrip makes a loss of 10% / 20% / 30% / 50%, the stock will regain and turn around. Once they again enter the same breakout level, they will flyyyyyyyyyyyy like a ROCKET if held in the portfolio in the longer run.
Time makes money, GREEDY & EGO will not make money.
Also, magically these breakouts tend to prove that the companies turn around and fundamentally becoming strong. Also the magic happens when more diversification is done in various sectors under various scripts with equal money invested in each N500 scripts.
The real deal is when to purchase and where to purchase the stock. That is where Breakout study comes into play.
LET'S PUMP IN SOME MONEY AND REVOLUTIONIZE THE NATION'S ECONOMY!
Amazing breakout on WEEKLY Timeframe - MHHLCheckout an amazing breakout happened in the stock in Weekly timeframe, macroscopically seen in Daily timeframe. Having a great favor that the stock might be bullish expecting a staggering returns of minimum 25% TGT. IMPORTANT BREAKOUT LEVELS ARE ALWAYS RESPECTED!
NOTE for learners: Place the breakout levels as per the chart shared and track it yourself to get amazed!!
#No complicated chart patterns
#No big big indicators
#No Excel sheet or number magics
TRADE IDEA: WAIT FOR THE STOCK TO BREAKOUT IN WEEKLY TIMEFRAME ABOVE THIS LEVEL.
Checkout an amazing breakout happened in the stock in Weekly timeframe.
Breakouts happening in longer timeframe is way more powerful than the breakouts seen in Daily timeframe. You can blindly invest once the weekly candle closes above the breakout line and stay invested forever. Also these stocks breakouts are lifelong predictions, it means technically these breakouts happen giving more returns in the longer runs. Hence, even when the scrip makes a loss of 10% / 20% / 30% / 50%, the stock will regain and turn around. Once they again enter the same breakout level, they will flyyyyyyyyyyyy like a ROCKET if held in the portfolio in the longer run.
Time makes money, GREEDY & EGO will not make money.
Also, magically these breakouts tend to prove that the companies turn around and fundamentally becoming strong. Also the magic happens when more diversification is done in various sectors under various scripts with equal money invested in each N500 scripts.
The real deal is when to purchase and where to purchase the stock. That is where Breakout study comes into play.
LET'S PUMP IN SOME MONEY AND REVOLUTIONIZE THE NATION'S ECONOMY!

An Inverted V Concor CMP 772
Directional Signal- the inverted V is a directional signal and asking u to be careful.
Fib- the stock will face first major resistance at 872/917. After a brief correction it can go 1034 zone.
Conclusion - since I can see the directional signal. tread carefully with this one. The Idea is to exit the rally, coz the next leg of fall will be devastating.

A rally to the highs very likely!!BOB CMP 228
Fib- the stock has taken support at 38.2% from a higher swing and that's strength.
Trendline- It has also taken the support above the rising trendline. The steep trendline is broken hence it is slowing down.
Conclusion - It should go back to 265 as a minimum tgt.

Duolingo (DUOL) - Bullish Momentum After Breakout Overview: DuolDuolingo Inc. (NASDAQ: DUOL) is showing strong bullish momentum after breaking above the 50-day Moving Average (blue line) with a significant volume spike. This indicates renewed interest and potential for further upside.
Technical Analysis:
Resistance Zone: $360 (recent high).
Support Zone: $330 (previous consolidation level).
Indicators:
Price has crossed above the 50-day Moving Average, signaling potential trend reversal.
Strong bullish candle backed by increased volume, confirming the breakout.
Volume spike shows growing buyer interest.
Trade Plan:
Entry: Consider entering above $352 for confirmation of sustained momentum.
Target:
Short-Term: $370
Medium-Term: $380-$390
Stop Loss: Place at $340 to limit downside risk.

Volatility Contraction Pattern (VCP)-Breakout Strategy ExplainedHello everyone! I hope you’re doing great, not just in life but also in your trading journey. Today, I’m here to share something exciting—a strategy I started using just a few months ago. It’s been performing really well for me, and I’m confident that if you use it properly, you’ll see great results too.
So, without wasting any more time, let’s get straight to it. Here we go!
Volatility Contraction Pattern (VCP): A Blueprint for Explosive Breakouts
The Volatility Contraction Pattern (VCP) is one of the most powerful chart patterns I’ve come across. It reveals when a stock is gearing up for a significant breakout. By understanding how price tightens over time and paying close attention to volume behavior, traders can catch high-probability moves before they unfold .
Let’s take a closer look at this concept using the example shown in the chart above.
What Is the VCP?
The VCP is all about price contractions. Here’s what typically happens:
Each pullback becomes smaller, signaling reduced volatility.
Volume starts to decline, which shows that sellers are losing steam.
Finally, the breakout occurs, often with a surge in volume, confirming the move.
It’s like a spring coiling tighter and tighter until it bursts free.
Step-by-Step Breakdown of Chart above
1. First Contraction (-19.31%)
This is where the pattern begins. The stock sees a sharp correction of 19.31%, showing some initial volatility.
At this point, volume begins to decrease, which is the first clue that sellers are starting to back off.
2. Second Contraction (-9.34%)
The price recovers but pulls back again, this time by just 9.34%.
This smaller contraction is a clear sign of the tightening price action, which is a hallmark of the VCP.
3. Third Contraction (-6.70%)
Another pullback happens, but now it’s even smaller—just 6.70%.
Volume continues to decline during this phase, further confirming that selling pressure is steadily fading.
4. Fourth Contraction (-4.56%)
The final contraction is the tightest of all, with a pullback of only 4.56%.
At this stage, the price is moving in a very narrow range, setting the stage for the big breakout.
Breakout
The stock finally breaks above the ₹5,000 resistance zone with a surge in volume.
This is the signal traders wait for—the confirmation that buyers are stepping in with strength.
How to Trade the VCP
Here’s how you can trade this pattern effectively:
Spot the Pattern:
Look for a sequence of contractions where each pullback is smaller than the previous one. Draw trendlines connecting the highs and lows to visualize the tightening range.
Volume Behavior:
Make sure that volume decreases during contractions and spikes significantly on the breakout.
Entry Point:
Enter the trade when the price breaks above the resistance level with high volume (₹5,000 in this case).
Stop-Loss Placement:
Place your stop-loss slightly below the last contraction low (₹4,500 here) to limit your risk.
Profit Targets:
Use trailing stops or set predefined targets based on previous price movements to lock in your gains.
Key Observations on the Chart
Take a moment to review the chart above, and here’s what stands out:
Resistance Zone (₹5,000):
The resistance level acted as a strong barrier, containing price until the breakout.
Consolidation Zone:
The price moved within a tightening range, building up energy for the breakout.
Volume Behavior:
Volume steadily declined during each contraction, and a spike in volume confirmed the breakout.
Breakout Candle:
The large breakout candle above ₹5,000 was the ultimate signal for entry.
Why Does the VCP Work?
The VCP reflects the psychology of the market:
Fear Fades: Each contraction shows that sellers are losing control.
Demand Grows: Buyers quietly step in, creating higher lows.
Energy Builds: As price tightens, the stock prepares for an explosive move.
Context Is Key:
The VCP works best in trending markets or fundamentally strong stocks. Always consider the bigger picture
.
Volume Is Crucial:
Without a volume surge, breakouts might not sustain. Be cautious of false signals.
Conclusion
The Volatility Contraction Pattern (VCP) is a highly reliable setup for spotting breakout opportunities. Once you master this pattern, you’ll be able to identify and trade high-probability moves with confidence.
Take a close look at the chart above to see how this setup played out in this example. Have you noticed similar patterns in other stocks? Share your thoughts in the comments—I’d love to hear your insights!
If you found this strategy or educational content helpful, don’t forget to hit the like button and show your support. It keeps me motivated to share more valuable insights with you all! 😊

Bajaj Healthcare Showing Strength, Crossing Key Levels after BO.NSE:BAJAJHCARE today closed strongly on weekly charts of the consolidation after a big breakout with heavy volumes and RSI and MACD are Showing Strength on the Weekly timeframe.
About the Company:
NSE:BAJAJHCARE manufactures a wide range of Active Pharmaceutical Ingredients and Formulations, It is focused on the development, supply, and manufacturing of Amino Acids, Nutritional Supplements and Active Pharma Ingredients for the Pharmaceutical, Nutraceuticals and Food industries.
Trade Setup:
It can be a Good 1:1 RISK-REWARD Trade. With the recent base being crucial levels. It is now in Blue Sky Terriorty so have a small Position Size
Target(Take Profit):
805.80 Levels for Positional Trader.
Stop-Loss:
Around 535.95 For Swing Trade and Recent BO Base for Positional Trader.
📌Thank you for exploring my idea! I hope you found it valuable.
🙏FLLOW for more
👍BOOST if useful
✍️COMMENT Below your views.
Meanwhile, check out my other stock ideas below until this trade is activated. I would love your feedback.
Disclaimer: This analysis is intended solely for informational and educational purposes and should not be interpreted as financial advice. It is advisable to consult a qualified financial advisor or conduct thorough research before making investment decisions.

IRCTC Long Idea......IRCTC looks good for reversal.
It is forming cup and handle pattern. Currently in Handle structure. 2-3 Quaters down the line it may touch ATH.
Targets are given in chart. SL for safe traders is trendline it was taking support on.
Risk management is Priority. Need to consider broader market conditions before taking position as swing.
I am personally going to average at horizontal support if at all it comes.
NOTE : Fundamentals are good. Top line 3Y sales growth CAGR = 77% , Bottom line 3Y Profit growth CAGR = 90%. Good ROE. No peer to compare P/E as Monopoly & P/E,P/B < median
I'm personally buying it whenerver falls 5-10%.

BIOCON-long for 20 %price defending 2024 january breakout level
200 EMA providing strong support since dec 2023
shorter EMAs are stacked above longer EMAs
MACD likley to cross signal line
Target and SL marked

NBCC constructed a 8.5% green candle on charts today. Reasons?NBCC is a fundamentally strong company & has recently bagged 5 orders worth Rs. 405 Cr. Not just this, it also inked a deal worth 3,500 Cr with Sarkari Awas Nirmal Avam Vitt Nigam.
The slight positive sentimental push from the market today pushed the share price high.
The share can give another 14% move once it crosses Rs. 100 mark.

Bat pattern in Asian paintsI am expecting more correction in Asian paints stock. Let's wait for the entry at bottom. Now it's not suitable for buy. This is for educational purposes only.

SR FlipUnderstanding the SR Flip Price Action/CIP:
(CIP: Change In Polarity)
If you’re a trader or investor, understanding price action is crucial to making informed decisions in the market. One popular price action pattern that traders often look out for is the SR flip, also known as support and resistance flip
Resistance can become support
Price breaches a support or resistance level when one side prevails over the other. Following breakthrough support or resistance, it's not uncommon for the price to revisit the breakout level before resuming its movement. In such instances, the former support may act as resistance, or the previous resistance may turn into support.

Stock Analysis: #ASHAPURMIN – A Comeback to Breakout LevelsHello, Traders! 👋
After falling nearly 60% from its previous high, #ASHAPURMIN is back at its breakout level. Here's what stands out:
📈 Technical Overview:
🔹 My ILTF indicator signaled an entry back in November amidst strong volume candles, and the stock has risen 34% since then.
🔹 Currently at a potential breakout zone, making it an interesting setup for breakout traders.
💡 My Position:
I’m not holding any position in this stock. Sharing this for learning purposes only.
⚠️ Disclaimer:
🔹 I am not a SEBI-registered advisor.
🔹 This analysis reflects my personal views and is not a recommendation to buy or sell.
🔹 Please do your own research or consult a professional before making any trading decisions.
What’s your view on #ASHAPURMIN? Could this be the next breakout trade? 🚀
#TradingView #StockAnalysis #BreakoutTrading #MomentumStocks #ASHAPURMIN

BAJAJHCARE 1:6+ RR trade set up1. Trend: Accumulation phase
2. Reversal from support
3. Strength is good at support with 14%+ bounce
4. RR 1:6+
