FIVESTAR // 06-03-2025This share may give 11% Profit if buy order triggered. Take position as per your risk reward ratio and that is not recommended, only for educational purposes.

Why HDFC Bank not move in Two Day Rally HDFC Bank Limited is India's largest private sector bank by assets and market capitalization, headquartered in Mumbai. citeturn0search1 Established in August 1994, the bank commenced operations as a Scheduled Commercial Bank in January 1995. citeturn0search3 In July 2023, HDFC Bank merged with its parent company, HDFC Limited, India's premier housing finance company, further strengthening its position in the financial sector. citeturn0search7
The bank offers a comprehensive range of banking and financial services to individuals and businesses, including savings and current accounts, fixed and recurring deposits, loans, credit cards, investments, and insurance products. citeturn0search0 It operates internationally, with branches in Bahrain, Hong Kong, and Dubai. citeturn0search9
As of March 6, 2025, HDFC Bank's shares remained unchanged at ₹1,689.75 on the Bombay Stock Exchange (BSE), while the BSE SENSEX Index rose by 0.83% to 74,340.09. The bank's shares are currently 10.12% below their 52-week high of ₹1,880.00, reached on December 9, 2024. citeturn0news11
In recent developments, HDFC Bank plans to significantly expand its loan securitization business over the next few years to cater to rising investor demand and manage its balance sheet. This initiative aims to create space for new loans without increasing the balance sheet size. So far, the bank has sold ₹463 billion ($5.3 billion) in loans through securitization this financial year. citeturn0news12
For more information or to access their services, you can visit HDFC Bank's Website

Powergrid is Most Expensive At This LevelPower Grid Corporation of India Limited (POWERGRID) is a 'Maharatna' Public Sector Enterprise under the Government of India, incorporated on October 23, 1989. It is India's largest electric power transmission company, responsible for planning, implementing, operating, and maintaining the nation's high-voltage transmission systems. citeturn0search0
As of the fiscal year 2023-24, POWERGRID reported a turnover of ₹46,913 crore and a net profit of ₹15,573 crore. The company's gross fixed assets stand at ₹2,75,991 crore. POWERGRID consistently achieves over 99% network availability by employing advanced operation and maintenance techniques that align with global standards. citeturn0search6
The Government of India holds a 51.34% stake in POWERGRID, with the remaining shares held by institutional investors and the public. The company is headquartered in Gurugram, Haryana, and operates across various regions in India. citeturn0search3
In addition to its core transmission services, POWERGRID offers consultancy services in the transmission, distribution, and telecom sectors, including planning, design, engineering, load dispatch, optical ground wire (OPGW) on intra-state transmission networks, procurement management, operation and maintenance, financing, and project management. citeturn0search7
For more information or to get in touch with POWERGRID, you can visit their official website
POWERGRID continues to play a strategic role in the development of India's power sector, ensuring the optimum utilization of generating resources and maintaining a robust national grid.

#SARDAENFundamentals:
* ROCE - 15.3%, ROE - 14.1%. Debt to Equity - 0.48
* EPS / Revenue - has been steadily increasing
* FIIs - Have marginally increased holding from 2.28% to 2.66%
* Retail holding levels have gone down
* Promoter holding has remained steady
* Mutual Funds have increased stake
Technicals:
* Price is consolidating and has started to form a higher low pivot structure
* Forming some mini cup patterns under a larger Cup pattern
* Volumes have subsided indicating silent accumulation by Instituitions
* Relative strength is strong / Momentum indicates build up / ADR is 5.2% and indicating up move
* Weekly chart shows clear signs of consolidation and a potential double bottom move.
* In weekly chart we can see a prior up move of ~70% and pull back of 20% only
The last two days have seen sellers taking control at the end of the day. This has led to creation of wicks.
It will be prudent to take a pilot position and then gradually start adding as price crosses highs of earlier two days and consolidates.
Note - Entry / SL / Target / Position size - Please figure out on your own based on risk appetite
Disclaimer - Your money requires your due diligence! I merely analyze and bring out probabilities. All the best.

ONGC -Wave 5 Bottomed! OMG! - From Oil Rigs to Green Gigs!ONGC is making history, transitioning from oil dominance to renewable energy leadership.
On Feb 28, Last ONGC Idea on TradingView
I shared my TradingView idea, predicting Wave 5 completion at the bottom and expecting a bounce off the trendline. And here we are on March 6—ONGC surges from 215 lows to 232+ highs as of today’s close with a strong green candle.
ONGC’s Big Bet: A ₹9.25B Leap into Green Energy!
But that’s not all—ONGC just made a massive fundamental move, acquiring PTC Energy for ₹9.25B ($106M), adding 288 MW of operational wind power across three Indian states.
Why This is a Game-Changer
✅ India’s 500 GW non-fossil fuel target by 2030
✅ ONGC Green targeting 10 GW renewable energy portfolio
✅ Recent $2.3B Ayana Renewable Power acquisition with NTPC Green
Technical Perspective – The Power of Wave 5
Is Wave 5 bottom confirmed in some degree of the impulsive move which started falling from 345 highs as discussed and warned earlier in the Bigger Idea
Momentum building – are new highs incoming
From oil rigs to green gigs, ONGC is shifting gears fast. Is this just the beginning of an explosive rally?
Let us decode the waves.
Catch me with another exciting idea from WaveTalks, Market Whispers! Can you hear them?
Regards,
Abhishek
WaveTalks

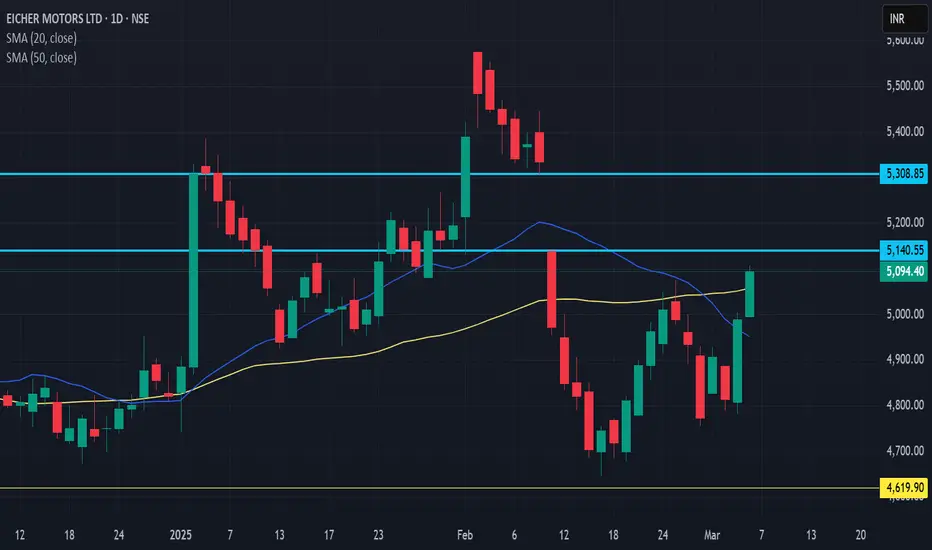
gap on weekly time frame.Gaps act like strong magnets, as one sentence from Trading in the Zone states. I want to experience this gap-filling theory.
If the 5150 Rs resistance is breached, possibly I am looking for the 50% gap to be filled immediately. if someone has experience on this, please have a word with me. thank you.


COALINDIA DOUBLE BOTTOM REVERSALCoalindia breaking double bottom reversal pattern
good volume building up strong rsi
after breaking target1 395 immediate traget 410+
no buy/sell recomendation

BUY TODAY SELL TOMORROW for 5%DON’T HAVE TIME TO MANAGE YOUR TRADES?
- Take BTST trades at 3:25 pm every day
- Try to exit by taking 4-7% profit of each trade
- SL can also be maintained as closing below the low of the breakout candle
Now, why do I prefer BTST over swing trades? The primary reason is that I have observed that 90% of the stocks give most of the movement in just 1-2 days and the rest of the time they either consolidate or fall
Trendline Breakout in CASTROLIND
BUY TODAY SELL TOMORROW for 5%

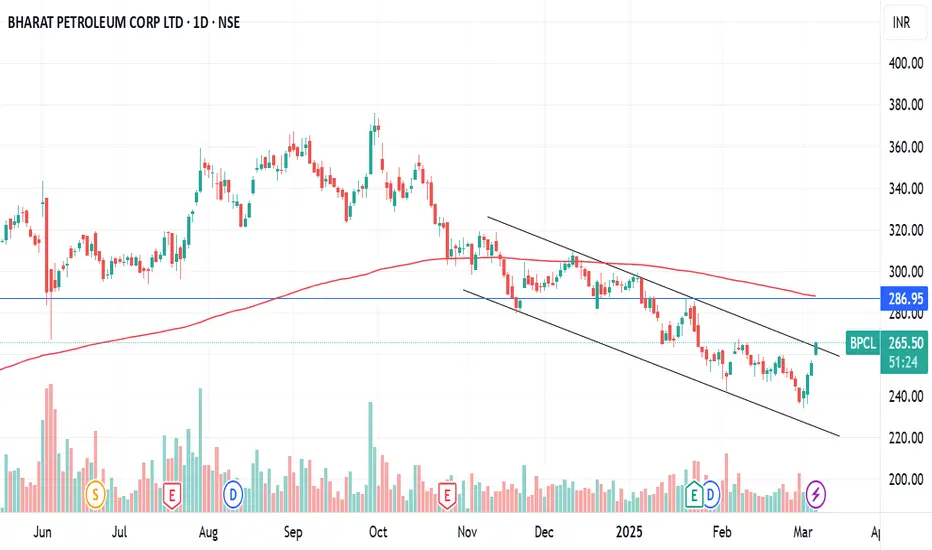
BPCL BREAKING CHANNELBPCL breaking channel with good volume
macd crossover done strong rsi
need to break 265
immediate #target 287
which is 200 ema also
NO BUY/SELL RECOMENDATION
Oil and Natural Gas Corporation (ONGC)- LongOil and Natural Gas Corporation (ONGC) on a 15-minute timeframe from NSE, showing an Inverted Head and Shoulders (IHS) pattern. Let’s break it down:
1. Identification of Inverted Head and Shoulders Pattern
Left Shoulder: The first smaller dip before the major drop.
Head: The lowest point in the pattern, indicating the strongest bearish move.
Right Shoulder: A higher low after the head, showing a potential reversal.
Neckline: The resistance level that connects the highs between the shoulders and head. The breakout above this neckline confirms the pattern.
2. Volume Analysis
Volume increases significantly during the breakout, confirming the validity of the pattern.
The rise in volume indicates strong buying interest, which is a bullish sign.
3. Moving Averages (EMA)
The price has crossed above the 200 EMA (purple line), which is a strong bullish signal.
The short-term moving averages (e.g., 9 EMA, 21 EMA) are also trending upwards, further supporting the bullish trend.
4. Entry and Exit Points
Entry: The best entry point is above the neckline breakout level, around 230-231, once confirmed with volume.
Stop-loss: Place a stop-loss just below the right shoulder, around 224-225.
Target (Exit Point): The projected target is calculated by adding the depth of the head to the neckline. This gives a target of around 243-244, which aligns with the previous resistance level (blue line).
Conclusion
The Inverted Head and Shoulders pattern is confirmed with a breakout and volume spike.
Bullish bias as price has crossed above the 200 EMA.
The price is likely to move toward 243-244 INR in the short term.
This analysis is for **educational and informational purposes only** and should not be considered as financial or investment advice. Trading and investing in financial markets involve risk, and past performance is not indicative of future results. Always conduct your own research, consult a qualified financial advisor, and use proper risk management strategies before making any trading decisions. The author is not responsible for any financial losses incurred based on this analysis.

BSE Ltd Market Projection: Bearish Continuation or Weak ReversalGiven the 33% decline from 6,050 to 4,035 in just 7 days, BSE Ltd is in a strong bearish trend. The upcoming price action will depend on key levels, consolidation phases, and possible retracements.
1. Slow & Consolidation Zone (Short-Term Accumulation)
Range: 4,299 – 4,439 (Bullish Order Block)
After a sharp drop, BSE Ltd could experience a temporary consolidation in this zone.
Expect low volatility as traders assess the next move.
2. Bearish Trend Continuation if 61.8% Retracement Breaks
Key Breakdown Level: 4,035 (61.8% Fibonacci & Bearish Order Block)
If price fails to hold 4,035, the downtrend will likely extend further.
Bearish Targets:
3,690 (Psychological support)
3,333 (Major historical demand zone)
Momentum: A breakdown below 4,035 could trigger a sharp fall, accelerating selling pressure.
3. Quick but Weak Reversal from 61.8% Retracement
If BSE Ltd bounces from 4,035, it is likely to be a weak recovery.
Upside Targets:
4,194 – 4,289 (Short-term resistance)
4,439 (Major supply zone)
Rejection Risk: Sellers could step in around 4,289 – 4,439, limiting further recovery.
Disclaimer: This analysis is for informational and educational purposes only and should not be considered financial or investment advice. Trading and investing in the stock market involve risks, and past performance is not indicative of future results. Always conduct your own research and consult with a qualified financial advisor before making any investment decisions.
The projections and price levels mentioned are based on technical analysis and market observations, which are subject to change due to market conditions, news events, and investor sentiment. Neither the author nor any affiliated parties are responsible for any financial losses incurred based on this analysis.

buy in chambal fertilizerStrengths: The company benefits from stable demand for fertilisers, government subsidies, and a strong distribution network. It is well-positioned in India's agriculture-driven economy.
Risks: The stock is sensitive to changes in government policies, fluctuations in raw material costs (like natural gas), and global urea prices. Environmental regulations could also impact operations.
Valuation: Check if the stock is trading at a reasonable valuation compared to its peers and historical averages. Analyze key metrics like P/E ratio, debt levels, and dividend yield.
Market Trends: Monitor government initiatives supporting agriculture and urea production, as well as global fertiliser market trends.
Diversification: Ensure your portfolio is diversified and aligns with your long-term strategy.

Ujjivan bank Bullish patternAfter a consolidation at the the major support , now there is a breakout at daily chart which shows that bulls started to take control over the bears , great time to enter with minimum risk and good reward...
Happy Trading :)

Looks good around 420 -425 levelsA long trade in the stock can be initiated with stop loss around 397-399 levels as fundamentally strong stocks can do good in coming months and have potential target of 450++ 505+++ levels maintain proper sl and trade as per your risk appetite

Big Blast trade on Summit Securitires around 1550-1570 levelsA long trade can be initiated in Summit securities considering the stop loss around 1450-1440 levels for potential target of1775+++ 1940+++ 2125+++ and soon mainitain proper sl with risk reward in mind and take position accordingly

Finding perfect bottom.Had marked swing low for a uptrend.
Price made bottom before moving upside.
Fresh buying can be looked for if price dips near 905 level.
Happy Investing
Girish Anchan
W.M.A

SOLARINDSSolar Industries is one of the largest domestic manufacturers of bulk and cartridge explosives, detonators, detonating cords and components which find applications in the mining, infrastructure and construction industries.
Company manufactures high-energy explosives, delivery systems, ammunition filling and pyros fuses for the defense sector.
The company manufactures bulk explosives, packaged explosives, and initiating systems, finding applications in the mining, infrastructure, construction, Defence, and Space Sector.
company manufactures High Energy Materials including HMX, RDX, TNT and their Compounds, Composite Propellants for Akash, Brahmos, PSOMXL & Space Rocket motors, Multi-Mode Hand Grenade, Mines, Warheads, etc.

Daily Timeframe Analysis – NATIONAL ALUMINIUM CO LTD on Renko Daily Timeframe Analysis – NATIONAL ALUMINIUM CO LTD (NSE: NATIONALUM)
This is a Renko Chart with 1% brick size, showing the daily price action.
Key Observation s:
1. Trend Analysis:
- The stock formed Higher Highs (HH) and Higher Lows (HL) until December 2024, confirming an uptrend.
- A Break of Structure (BOS) occurred, leading to a downtrend from the ₹250 zone to around ₹181.84.
- Currently, it has bounced from the ₹181.84 demand zone, which is a strong support.
2. Support & Resistance Levels:
- Strong Support:₹181.84 (Green Zone)
- Demand Zone: ₹165–₹175 (Blue Zone, marked as "Strong Low")
- Resistance Levels:
- ₹200-₹201 (Current Resistance)
- ₹210 (Major Resistance Zone)
3. Liquidity Areas & Structure:
- Weak High near ₹250 suggests it might get retested in the future.
-Equal Lows (EQL) were formed before the bounce, indicating liquidity was taken.
-Break of Structure (BOS) multiple times in the downtrend, confirming bearish momentum.
- Higher Low (HL) recently formed, indicating potential reversal.
Trading Plan:
Bullish Scenario (If Price Holds Above ₹200):
- A breakout above ₹201-₹210 could lead to a move toward ₹220-₹230.
- Stop-loss below ₹190 (previous support).
- Target 1: ₹210
- Target 2: ₹220
Bearish Scenario (If Rejected at ₹200) :
- If price faces rejection, it could retest ₹181.84, or even the ₹165–₹175 demand zone.
- A short opportunity can be considered below ₹190, targeting ₹181.84 and ₹175.
- Stop-loss above ₹202.
Conclusion:
- Price Action Near ₹200 is Key: If it breaks above, bullish momentum may continue.
- Rejection at ₹200: Could lead to a retest of ₹181.84 or even lower.
- Wait for confirmation before taking a position – A breakout candle in Renko will provide a strong directional clue.

UPL Ltd - Renko Analysis & Trade Setup
🔍 Stock: UPL Ltd (NSE)
📊 Chart Type: Renko (1% )
📆 Timeframe: Daily
Technical Analysis:
1. Resistance Zone (650-650.50)
- The price is testing a strong resistance zone around ₹650.
- This level has been previously respected, leading to pullbacks.
2. Bearish Reversal Signal
- The latest red Renko brick suggests potential downside momentum.
- A short-term correction could be in play.
3. Support Levels:
- The next major support is around ₹588-590.
- If the price fails to hold above ₹635, we might see further downside towards this level.
4. Indicators:
- The trendline still shows bullish momentum, but signs of weakness are appearing.
- RSI is currently above 60, indicating strength but also the possibility of overbought conditions.
Trade Setup:
✅ Bearish Bias: If price stays below ₹635, a potential short trade can be considered with a target of ₹590.
✅ Stop-loss: A strict stop-loss above ₹650 to protect from false breakouts.
✅ Bullish Confirmation: If price reclaims ₹650 convincingly, a breakout trade towards ₹675+ could be on the cards.
🔔 Conclusion:
UPL is at a key inflection point. A rejection at ₹650 can lead to a correction, while a breakout can fuel further upside. Keep an eye on price action for confirmation!
#UPL #Renko #StockMarket #TechnicalAnalysis #TradingView #NSE #SwingTrading

BUY TODAY SELL TOMORROW for 5% DON’T HAVE TIME TO MANAGE YOUR TRADES?
- Take BTST trades at 3:25 pm every day
- Try to exit by taking 4-7% profit of each trade
- SL can also be maintained as closing below the low of the breakout candle
Now, why do I prefer BTST over swing trades? The primary reason is that I have observed that 90% of the stocks give most of the movement in just 1-2 days and the rest of the time they either consolidate or fall
Flag & Pole Breakout in TCPLPACK
BUY TODAY SELL TOMORROW for 5%

BUY TODAY SELL TOMORROW for 5% DON’T HAVE TIME TO MANAGE YOUR TRADES?
- Take BTST trades at 3:25 pm every day
- Try to exit by taking 4-7% profit of each trade
- SL can also be maintained as closing below the low of the breakout candle
Now, why do I prefer BTST over swing trades? The primary reason is that I have observed that 90% of the stocks give most of the movement in just 1-2 days and the rest of the time they either consolidate or fall
Trendline Breakout in SHRIRAMFIN
BUY TODAY SELL TOMORROW for 5%
