OPEN-SOURCE SCRIPT
Updated BANKNIFTY list of stocks RSI trend on multi time frame
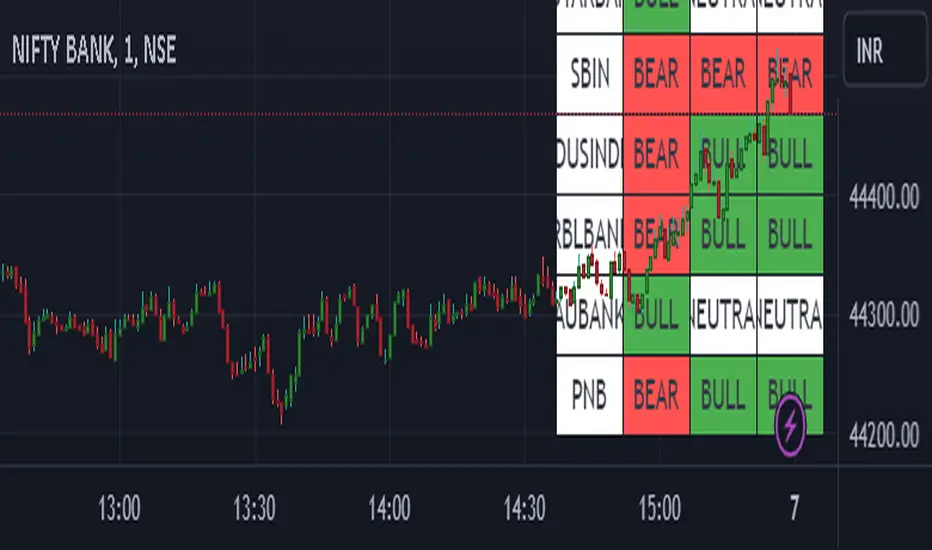
This script gives you an overview of banknifty and its underlying heavy weight stocks based on RSI
You can view the trend in single chart in 3 different time frames.
Color indication green for bullish and red for bearish trend and white for neutral
Symbol name shows green if the current day change is positive. Else red color
You can view the trend in single chart in 3 different time frames.
Color indication green for bullish and red for bearish trend and white for neutral
Symbol name shows green if the current day change is positive. Else red color
Release Notes
Few users reported that the change of time is not reflecting correctly.Also removed the color for the first column as there was a restriction from TV
Enjoy the script
Open-source script
In true TradingView spirit, the creator of this script has made it open-source, so that traders can review and verify its functionality. Kudos to the author! While you can use it for free, remember that republishing the code is subject to our House Rules.
Disclaimer
The information and publications are not meant to be, and do not constitute, financial, investment, trading, or other types of advice or recommendations supplied or endorsed by TradingView. Read more in the Terms of Use.