Strategic Omega Portfolio System | QuantumResearch
What it does
The Strategic Omega Portfolio System builds a rules-based multi-asset portfolio that adapts position and weight across up to five tickers (defaults: BTC, ETH, SOL, SUI + a spare slot).
It combines:
a trend/participation filter per asset, and
a two-pillar allocator (performance-quality via Omega and risk parity via inverse volatility).
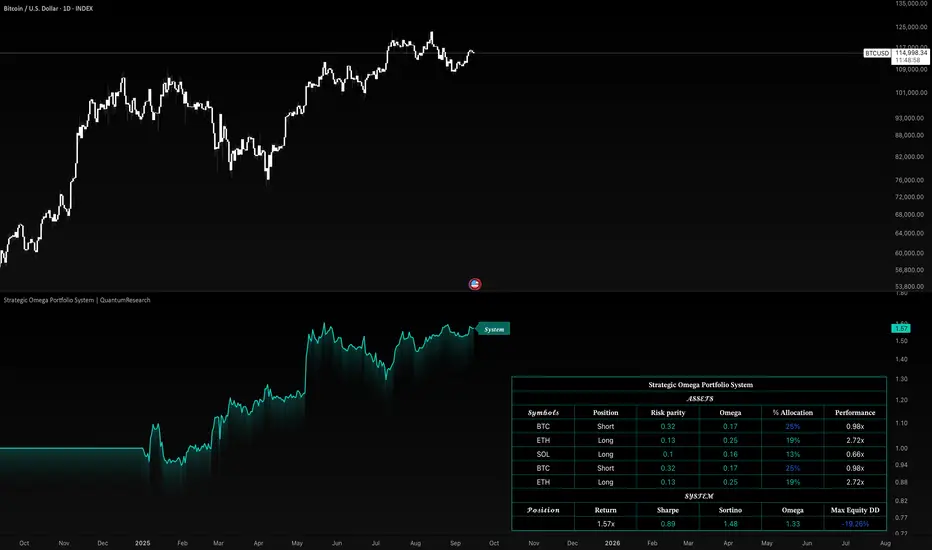
The output is an evolving portfolio equity curve with a companion table showing signals, weights, and performance metrics.
How it works (principle, no hidden math)
1) Trend Participation (TPI)
Each asset is passed through an adaptive oscillator that gauges how far price has stretched relative to volume-weighted value and adapts its thresholds to current volatility.
When the oscillator exceeds its adaptive upper threshold → participate Long in that asset.
When it falls below the lower threshold → participate Short (or reduce/offset risk).
This focuses exposure on regimes with directional momentum rather than constant holding.
2) Weight Engine = Omega (quality) × Risk Parity (risk)
Omega weighting: Assets with a better gain/loss profile (more upside vs downside in recent returns) receive higher weight. This rewards asymmetric return quality, not just high average returns.
Risk-parity weighting: In parallel, weights are computed from inverse realized volatility of each asset’s strategy equity, so more volatile legs contribute less risk.
Blend: The system averages the Omega and risk-parity weights to get a balanced allocation.
Sign overlay: Final weights inherit the sign of each asset’s TPI (Long if trend-up, Short if trend-down), so exposure direction follows regime while size follows quality and risk.
3) Execution assumptions (inside the script)
Daily compounding of portfolio equity using the weighted sum of asset strategy returns.
Slippage is modeled in the entry/exit routine when positions flip.
You can include/exclude assets 3–5 from the blend.
Everything is computed on-chart; no external links or dependencies are required to understand usage.
What you see on the chart
System equity curve (optionally shaded): the portfolio’s compounded value since your chosen backtest start date.
Metrics table (toggleable): shows for each asset
Position (Long/Short from TPI),
Risk-parity weight, Omega weight, Final % allocation,
Each asset’s strategy equity multiple (x).
It also shows system-level metrics: return multiple, Sharpe, Sortino, Omega, and max equity drawdown.
How to use it
Select your assets (inputs accept any symbols).
Pick a backtest start date relevant to your horizon.
Optionally toggle assets 3–5 and tune the TPI sensitivity and lookback/thresholds if you want a faster or slower regime filter.
Read the table:
Prefer assets with Long TPI and higher final % allocation when you want to lean risk-on.
If several assets are Short, the system will naturally reduce or offset exposure.
Use the system equity and drawdown to sanity-check whether the configuration fits your risk tolerance.
Why this is different (originality & value)
It does not allocate on simple momentum ranks alone or a single classic indicator.
It separates participation (trend regime) from sizing (quality × risk), which helps avoid over-allocating to noisy uptrends or under-allocating to durable ones.
The Omega component prioritizes asymmetric payoffs, not just average returns, while risk parity normalizes contribution so one asset doesn’t dominate portfolio risk.
The adaptive VWMA oscillator uses volatility-responsive thresholds, aiming to reduce whipsaws compared with static bands.
Clean-chart guidance (publishing)
Publish with a clean chart (no unrelated indicators). If you add drawings, explain how they map to positions, weights, or equity. The script stands on its own; no external materials are required to understand intent and usage.
Inputs you can tune
Assets 1–5 (symbols).
Backtest Start Date.
Include/Exclude assets 3–5.
TPI controls.
Risk-parity window (volatility lookback).
Table/System plot toggles.
Limitations & best practices
Works best when assets exhibit persistent trends; allocation will churn more in choppy conditions.
Weights and signs are conditional on the last confirmed bar; intra-bar changes may differ.
Results are sensitive to lookbacks, start date, and asset mix—treat them as parameters to test, not absolutes.
Disclaimer
This script is for research and educational purposes only and is not financial advice. Markets involve risk. Past performance does not predict or guarantee future results. Always validate settings on your instruments and use prudent risk management.
Invite-only script
Only users approved by the author can access this script. You'll need to request and get permission to use it. This is typically granted after payment. For more details, follow the author's instructions below or contact QuantumResearch directly.
TradingView does NOT recommend paying for or using a script unless you fully trust its author and understand how it works. You may also find free, open-source alternatives in our community scripts.
Author's instructions
whop.com/quantum-whop/
⚒️ Get access to our toolbox here for free:
quantumresearchportfolio.carrd.co
All tools and content provided are for informational and educational purposes only.
Disclaimer
Invite-only script
Only users approved by the author can access this script. You'll need to request and get permission to use it. This is typically granted after payment. For more details, follow the author's instructions below or contact QuantumResearch directly.
TradingView does NOT recommend paying for or using a script unless you fully trust its author and understand how it works. You may also find free, open-source alternatives in our community scripts.
Author's instructions
whop.com/quantum-whop/
⚒️ Get access to our toolbox here for free:
quantumresearchportfolio.carrd.co
All tools and content provided are for informational and educational purposes only.