OPEN-SOURCE SCRIPT
William's ProGo indicator
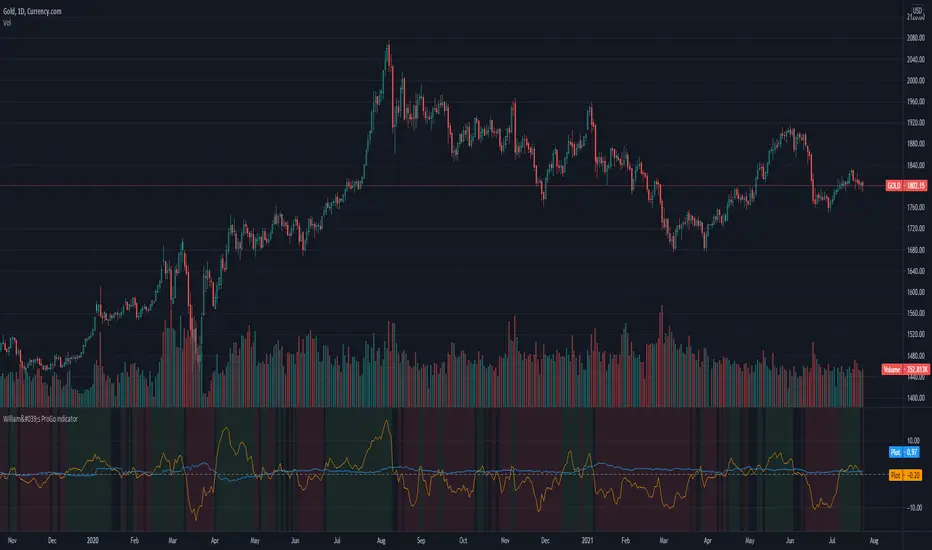
ProGo, created by Larry William, (earlier than 2002), is a 2 line graph using daily data.
1. Professional Line (color orange) is a professional Accumulation/Distribution line is constructed by using the change from today's open to today's close.
2. The Public Line (color blue) is done by creating a public accumulation/distribution line that shows the change from yesterdays close to today's open.
The graph is an index of the previous close to open +/- values (public) and then taking a 14 day average which is plotted against a 14 day average of the +/- values of the open to close(pro).
Background color:
Green colored area is where "pro" line crossover "amatuers" line, and the "pro" line is also positive.
Created this for literature review.
Open-source script
In true TradingView spirit, the creator of this script has made it open-source, so that traders can review and verify its functionality. Kudos to the author! While you can use it for free, remember that republishing the code is subject to our House Rules.
Disclaimer
The information and publications are not meant to be, and do not constitute, financial, investment, trading, or other types of advice or recommendations supplied or endorsed by TradingView. Read more in the Terms of Use.