OPEN-SOURCE SCRIPT
Updated Trend Following MOMO

Ingredients
Daily chart
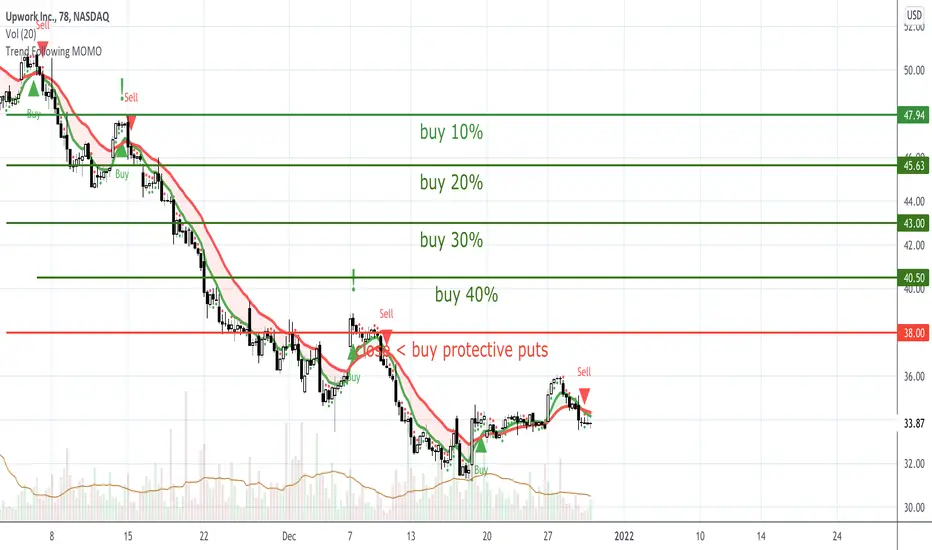
8ema & 21ema on a 78-minute chart
Trend Following v1 indicator for TradingView (optional)
Steps
Identify stocks that tend to move the same direction for one or more weeks at a time.
Find and locate stocks where the 8ema is crossing above (bullish) or below (bearish) the 21 ema on a 78-minute chart.
If the 8ema > 21ema, the indicator will show a GREEN shaded area , be bullish OR if the 21ema > 8ema, the indicator will show a RED shaded area, be bearish.
Buy to open with a “Limit buy” order if a green arrowis present at CLOSE of a 78-minute candle or sell to open with a “limit sell” or if a red arrowis present at CLOSE of a 78-minute candle.
Use either stocks or options. allocate the same $$ for each trade, continue in the trend (stay in the trade) until you 1) trend is changing. 2) ready to lock in profits.
Optional
The shift from bearish to bullish is the best scenario, consider Long only / short only / long and short.
Set alerts “Trend Reversal” inside the v1 trend following TradingView indicator and ONLY trade your alerts.
Premium indicator has built-in strategy tester.
Release Notes
Updated a few lines to allow 3rd party algos utilize the tv webhooks easier.Release Notes
*fixed the issue with alerts warning about "repainting"*simplified the messaging
Release Notes
UPDATE to fix the repainting warning that occurs intermittentlyOpen-source script
In true TradingView spirit, the creator of this script has made it open-source, so that traders can review and verify its functionality. Kudos to the author! While you can use it for free, remember that republishing the code is subject to our House Rules.
Disclaimer
The information and publications are not meant to be, and do not constitute, financial, investment, trading, or other types of advice or recommendations supplied or endorsed by TradingView. Read more in the Terms of Use.
Open-source script
In true TradingView spirit, the creator of this script has made it open-source, so that traders can review and verify its functionality. Kudos to the author! While you can use it for free, remember that republishing the code is subject to our House Rules.
Disclaimer
The information and publications are not meant to be, and do not constitute, financial, investment, trading, or other types of advice or recommendations supplied or endorsed by TradingView. Read more in the Terms of Use.