PROTECTED SOURCE SCRIPT
Bitcoin long term trends
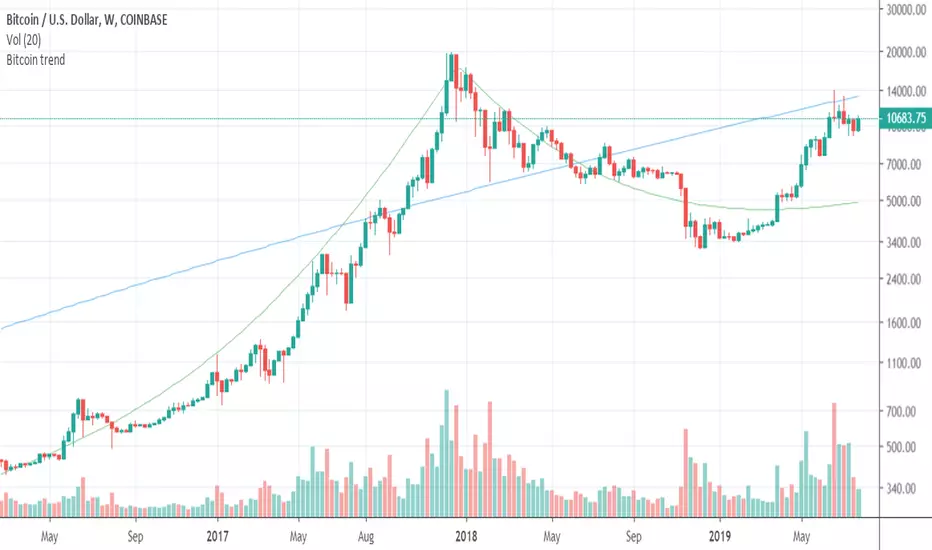
This script shows the long term trends in Bitcoin price.
It is based on my mathematical formula for the long term trends.
The blue line is a long term trend as a power function B = (t/693)^5.526
And the green line is a more sophisticated trend, which models the wave behavior over the whole history of bitcoin.
This script is only applicable to BTCUSD price. The trend lines are calculated as the functions of time only.
 BTCUSD
It is based on my mathematical formula for the long term trends.
The blue line is a long term trend as a power function B = (t/693)^5.526
And the green line is a more sophisticated trend, which models the wave behavior over the whole history of bitcoin.
This script is only applicable to BTCUSD price. The trend lines are calculated as the functions of time only.
Protected script
This script is published as closed-source. However, you can use it freely and without any limitations – learn more here.
Disclaimer
The information and publications are not meant to be, and do not constitute, financial, investment, trading, or other types of advice or recommendations supplied or endorsed by TradingView. Read more in the Terms of Use.