OPEN-SOURCE SCRIPT
Gradiente
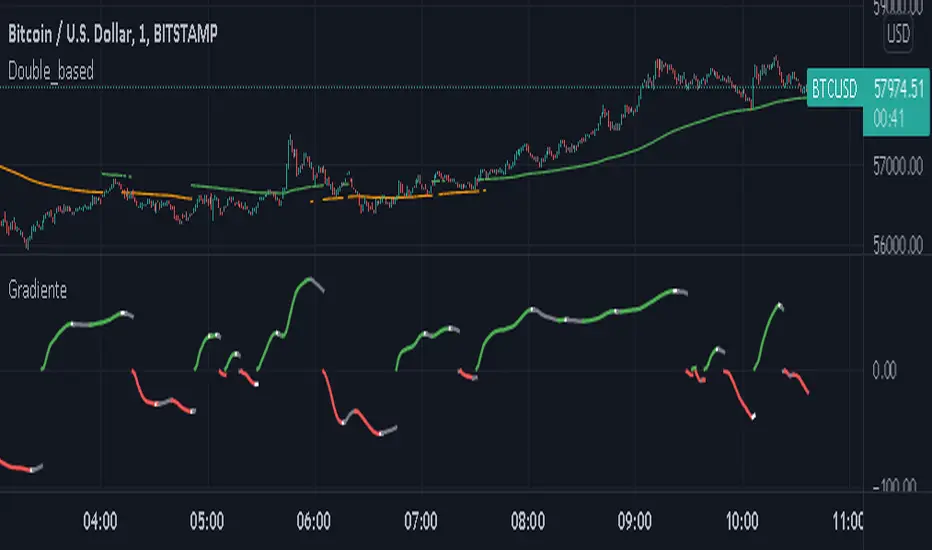
This indicator works in following concep. In a trend the area between two EMA increases as the trend go forward. When the trend loose strenth the fast EMA is the first to slow down and the area betwenn the EMA stop to increase indicating a lost of momentum.
The gradient is the division of the area formed between the EMA by the number of bars it contains.
In a up-trend is above 0.
In a down-trend is below 0.
The color green in the up trend shows the strenth is on, the white color shows the momentum is weaking.
The color red in the down trend shows the strenth is on, the white color shows the momentum is weaking.
Is necessary to plot the same EMA periods on the chart price to compare the strenth.
Open-source script
In true TradingView spirit, the creator of this script has made it open-source, so that traders can review and verify its functionality. Kudos to the author! While you can use it for free, remember that republishing the code is subject to our House Rules.
Disclaimer
The information and publications are not meant to be, and do not constitute, financial, investment, trading, or other types of advice or recommendations supplied or endorsed by TradingView. Read more in the Terms of Use.