OPEN-SOURCE SCRIPT
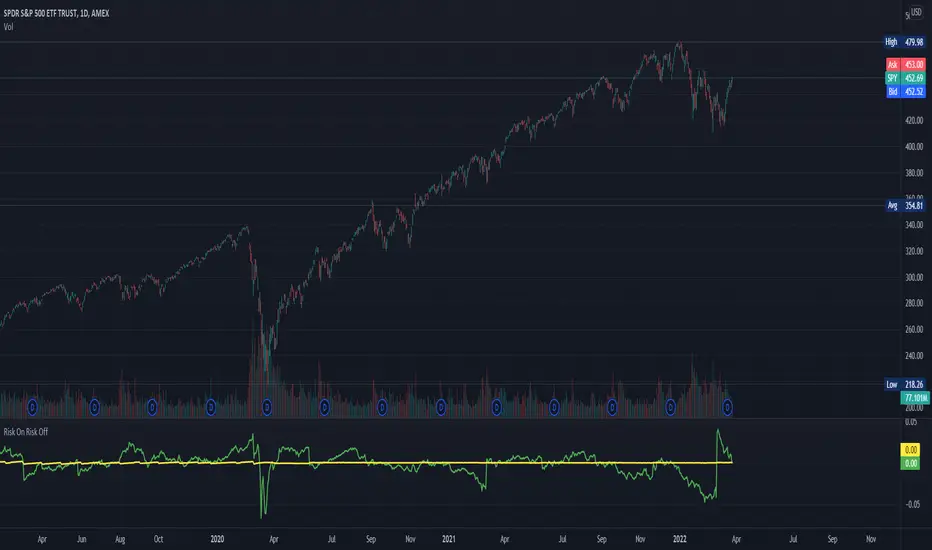
Risk On Risk Off

A helpful indicator for those who follow a systematic long-term investment approach.
What it shows:
It shows the 60 Day Cumulative Return of BND Vanguard Total Bond Market ETF against the 60 Day Cumulative Return of
  BIL SPDR Bloomberg Barclays 1-3 Month T-Bill ETF.
Why:
This Indicator will provide you a sense of where the economic environment is at, if the indicator shows that the 60 Day Cumulative return of BND is ABOVE
  BIL, it means that it's a good idea to go Risk ON in the stock market; On the other hand, if the inverse is true, it means that is a good idea to go Risk OFF in the stock market.
Example Uses:
Warren Buffet often advice Investors to just buy a S&P500 index tracking ETF like SPY consistently and you will likely to be making money in the long-term.
With this indicator you will be able to make the Buffet Strategy even simpler: when the indicator shows Risk ON, buy the SPY; when the indicator shows Risk OFF, consider hedges like
  IEF iShares 7-10 Year Treasury Bond ETF.
 SPY
SPY
What it shows:
It shows the 60 Day Cumulative Return of
Why:
This Indicator will provide you a sense of where the economic environment is at, if the indicator shows that the 60 Day Cumulative return of
Example Uses:
Warren Buffet often advice Investors to just buy a S&P500 index tracking ETF like
With this indicator you will be able to make the Buffet Strategy even simpler: when the indicator shows Risk ON, buy the
Open-source script
In true TradingView spirit, the creator of this script has made it open-source, so that traders can review and verify its functionality. Kudos to the author! While you can use it for free, remember that republishing the code is subject to our House Rules.
Disclaimer
The information and publications are not meant to be, and do not constitute, financial, investment, trading, or other types of advice or recommendations supplied or endorsed by TradingView. Read more in the Terms of Use.