OPEN-SOURCE SCRIPT
Bitcoin Cycle
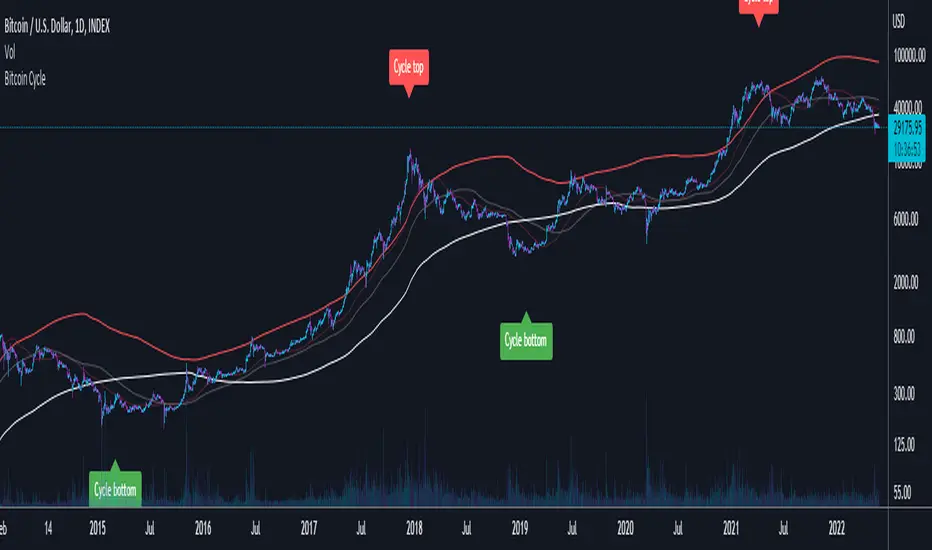
This script displays 4 different Moving Averages:
For the last cycles: once the 2 year MA crossed the 232 Day MA, it marked the cycle bottom within a few days and once the 1 year MA (x2) crossed the 116 Day MA, it marked the cycle top within a few days.
It is interesting to note that both 365/116 and 730/232 equal 3.1465, which is very close to Pi (3.142). It is actually the closest we can get to Pi when dividing 365 by another whole number.
- 2 Year Moving Average (White)
- 1 Year Moving Average (Doubled in value, Red)
- 116 Day Moving Average (Transparent, Red)
- 232 Day Moving Average (Transparent, White)
For the last cycles: once the 2 year MA crossed the 232 Day MA, it marked the cycle bottom within a few days and once the 1 year MA (x2) crossed the 116 Day MA, it marked the cycle top within a few days.
It is interesting to note that both 365/116 and 730/232 equal 3.1465, which is very close to Pi (3.142). It is actually the closest we can get to Pi when dividing 365 by another whole number.
Open-source script
In true TradingView spirit, the creator of this script has made it open-source, so that traders can review and verify its functionality. Kudos to the author! While you can use it for free, remember that republishing the code is subject to our House Rules.
Disclaimer
The information and publications are not meant to be, and do not constitute, financial, investment, trading, or other types of advice or recommendations supplied or endorsed by TradingView. Read more in the Terms of Use.