INVITE-ONLY SCRIPT
Updated Cashew Nuts
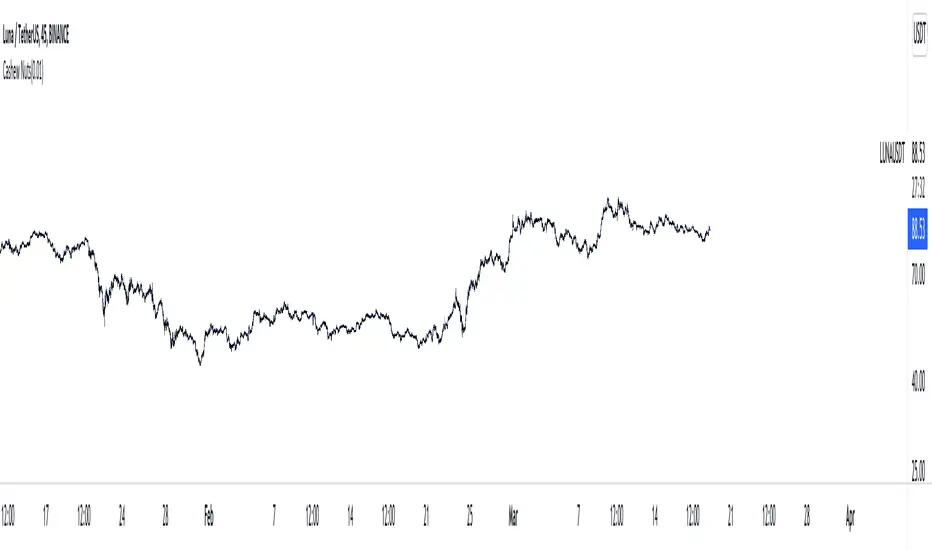
This indicator used the average regression of stock prices.
In general, stock prices show how they form new prices when they are outside the average price or range.
Therefore, when stock prices show an average price flow, if you take both long and short positions, you will have an opportunity to convert the spread into profit in the meantime.
How to use -
When the direction is determined from the average price, and when the direction is up, it is generally interpreted as a drop as soon as it deviates from the resistance line.
When the direction is determined from the average price, and when the direction is lowered, it is generally expected to rise as soon as it breaks the support line.
Precautions -
These indicators do not guarantee profits.
Release Notes
version update.Release Notes
protected indicatortelegram channel :
t.me/noah_technologies
t.me/noah_technologies
Invite-only script
Access to this script is restricted to users authorized by the author and usually requires payment. You can add it to your favorites, but you will only be able to use it after requesting permission and obtaining it from its author. Contact Quantkr for more information, or follow the author's instructions below.
TradingView does not suggest paying for a script and using it unless you 100% trust its author and understand how the script works. In many cases, you can find a good open-source alternative for free in our Community Scripts.
Author's instructions
″If you wish to use it, please send a message via the telegram written on the signature.
Want to use this script on a chart?
Warning: please read before requesting access.
telegram channel :
t.me/noah_technologies
t.me/noah_technologies
Disclaimer
The information and publications are not meant to be, and do not constitute, financial, investment, trading, or other types of advice or recommendations supplied or endorsed by TradingView. Read more in the Terms of Use.