PROTECTED SOURCE SCRIPT
Updated Wick Sentiment & Stop Hunts

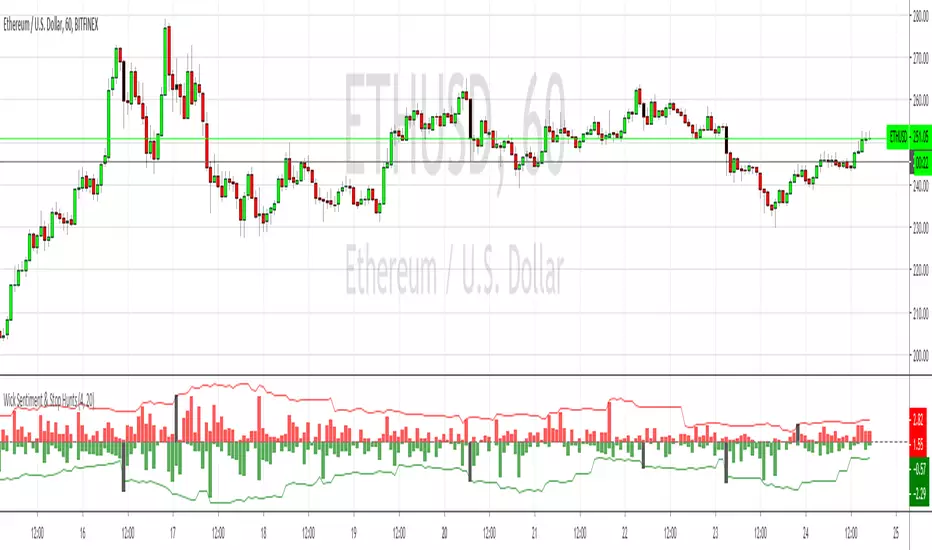
Takes the length of the wicks on the tops and bottoms of each candle and plots them on their own to reduce the noise and to give an idea of whether the bulls or bears are being more insistent about direction.
It also highlights the more aggressive wicks in black, which can be used to identify stop hunting if used in conjunction with support/resistance levels.
It also highlights the more aggressive wicks in black, which can be used to identify stop hunting if used in conjunction with support/resistance levels.
Release Notes
Added alertsRelease Notes
Add candle colouringRelease Notes
Added a standard deviation lookback input and gave meaningful titles to the outputs, which can be viewed in the Data Window on the right, with thanks to RokasFx for the suggestionsProtected script
This script is published as closed-source. However, you can use it freely and without any limitations – learn more here.
Disclaimer
The information and publications are not meant to be, and do not constitute, financial, investment, trading, or other types of advice or recommendations supplied or endorsed by TradingView. Read more in the Terms of Use.
Protected script
This script is published as closed-source. However, you can use it freely and without any limitations – learn more here.
Disclaimer
The information and publications are not meant to be, and do not constitute, financial, investment, trading, or other types of advice or recommendations supplied or endorsed by TradingView. Read more in the Terms of Use.