PROTECTED SOURCE SCRIPT
Nifty Trend vs Range (Final)
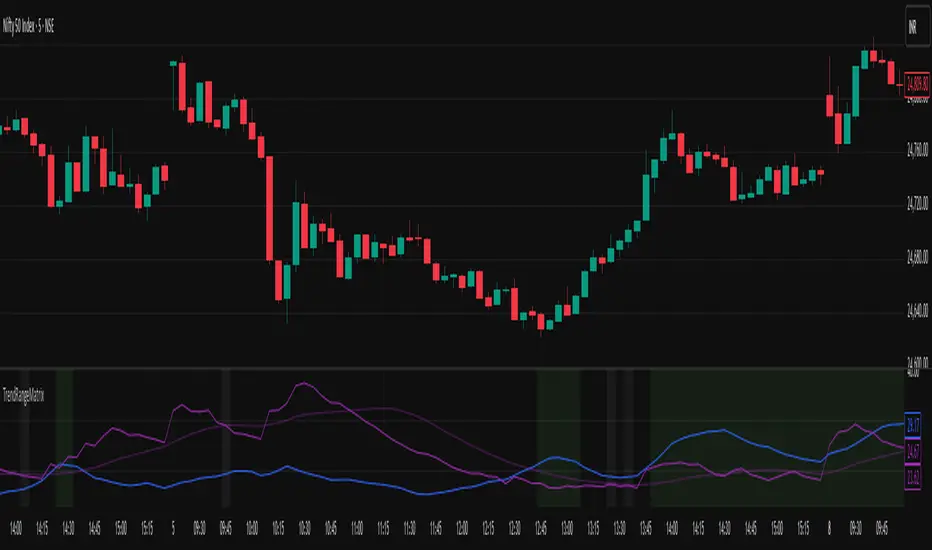
This indicator is designed to help you quickly identify whether the Nifty market is trending, ranging, or preparing for a breakout by combining three volatility and trend-strength measures:
India VIX (Volatility Index)
ADX (Average Directional Index)
ATR (Average True Range)
It creates a Trend vs Range Decision Matrix that categorizes the market into actionable states such as Range – Quiet, Breakout Watch, Trend – Smooth, Trend – Confirmed, Trend – Volatile, or Choppy / Noisy.
🔑 How it Works
India VIX (Market Volatility)
Pulled directly from NSE:INDIAVIX (or your chosen symbol).
VIX thresholds are defined:
Below VIX Low → Calm market (often ranges).
Between VIX Low & High → Neutral/moderate volatility.
Above VIX High → High volatility (potential big moves or choppiness).
VIX can be scaled and plotted in the same pane with ADX/ATR, or shown separately with a companion script.
ADX (Trend Strength)
Custom calculation (Wilder’s smoothing, not built-in ta.adx), to ensure more consistent results.
Thresholds (auto-tuned by timeframe if enabled):
Low ADX → Weak/no trend, sideways.
High ADX → Strong directional trend.
ATR (Volatility Expansion)
ATR compared to a moving average of ATR detects whether volatility is rising or flat.
Used as confirmation for breakouts or fading moves.
🧠 Market State Logic
The script combines the three signals into an interpretable market state:
Range – Quiet → VIX low, ADX low, ATR flat
Trend – Smooth → VIX low, ADX high
Breakout Watch → VIX neutral, ADX low, ATR rising
Trend – Confirmed → VIX neutral, ADX high, ATR rising
Choppy / Noisy → VIX high, ADX low, ATR rising
Trend – Volatile → VIX high, ADX high, ATR rising
Neutral → fallback if conditions don’t match
Each state is color-coded with background shading and displayed as a persistent label with key metrics (VIX, ADX, ATR).
⚙️ Features
✅ Intraday Auto-Tuning
ADX/ATR thresholds automatically adjust depending on chart timeframe (5m, 15m, etc.).
✅ Scalable VIX Plotting
Option to overlay a scaled VIX line in the same pane or hide it if you use a separate VIX pane.
✅ Persistent State Label
Shows the current regime, timeframe, and key values. Updates every bar without stacking multiple labels.
✅ Alerts Ready
Alerts for each market regime can be set directly in TradingView.
✅ Background Coloring
Quick at-a-glance identification of current state.
🎯 How to Use
Ranging markets (low VIX, low ADX, flat ATR): Favor mean-reversion strategies like option selling, iron condors, or scalping.
Smooth trends (low VIX, high ADX): Favor directional trades with futures/options spreads.
Breakout Watch: Stay alert for possible trend initiation.
Confirmed trends (neutral VIX, high ADX, rising ATR): Ideal for momentum trading.
Volatile trends (high VIX, high ADX): Use caution, hedge positions, or trade with wider stops.
Choppy/Noisy (high VIX, low ADX): Avoid overtrading, expect false signals.
Protected script
This script is published as closed-source. However, you can use it freely and without any limitations – learn more here.
Disclaimer
The information and publications are not meant to be, and do not constitute, financial, investment, trading, or other types of advice or recommendations supplied or endorsed by TradingView. Read more in the Terms of Use.