PROTECTED SOURCE SCRIPT
Updated Super Signal - Bollinger Bands
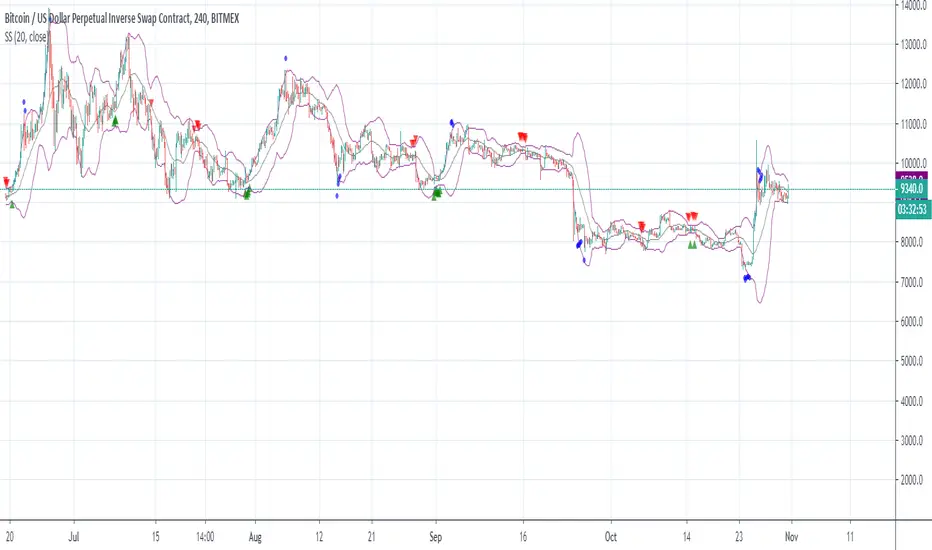
Bollinger Bands are price channels, or bands, that are plotted above and below price. The outer Bollinger Bands are based on price volatility, which means that they expand when the price fluctuates and trends strongly, and the Bands contract during sideways consolidations and low momentum trends. By using a combination of several indicators, we try to predict the direction of a large price movement when the Bands are compressed and the market is in a consolidation period.
To use the indicator:
Go long on the green arrows.
Go short on the red arrows.
The blue circles give a clear indication of when a trend has ended.
To use the indicator:
Go long on the green arrows.
Go short on the red arrows.
The blue circles give a clear indication of when a trend has ended.
Release Notes
Slight adjustments to the algorithm have been made to improve signals.Release Notes
Slight adjustments to improve signalsProtected script
This script is published as closed-source. However, you can use it freely and without any limitations – learn more here.
Disclaimer
The information and publications are not meant to be, and do not constitute, financial, investment, trading, or other types of advice or recommendations supplied or endorsed by TradingView. Read more in the Terms of Use.
Protected script
This script is published as closed-source. However, you can use it freely and without any limitations – learn more here.
Disclaimer
The information and publications are not meant to be, and do not constitute, financial, investment, trading, or other types of advice or recommendations supplied or endorsed by TradingView. Read more in the Terms of Use.