OPEN-SOURCE SCRIPT
Updated Crypto Price Volatility Range
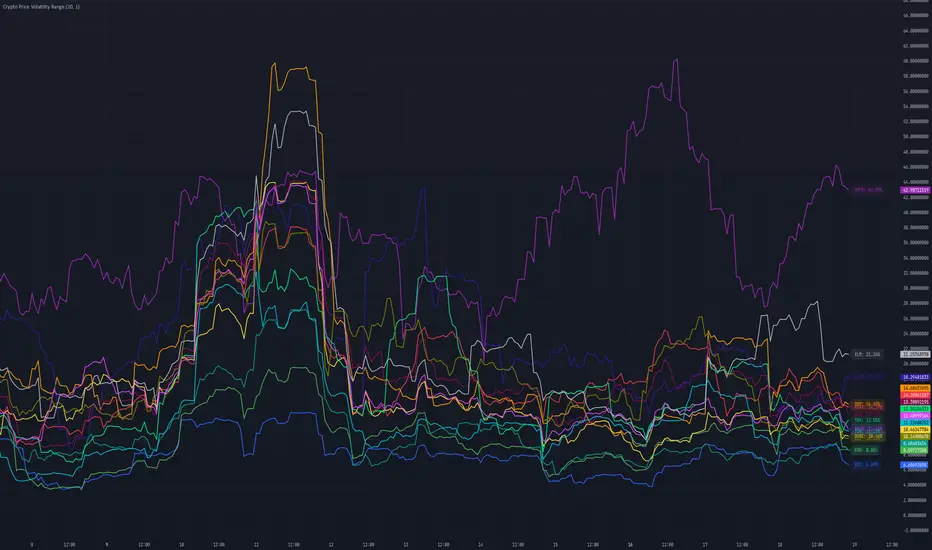
# Cryptocurrency Price Volatility Range Indicator
This TradingView indicator is a visualization tool for tracking historical volatility across multiple major cryptocurrencies.
## Features
- Real-time volatility tracking for 14 major cryptocurrencies
- Customizable period and standard deviation multiplier
- Individual color coding for each currency pair
- Optional labels showing current volatility values in percentage
## Supported Cryptocurrencies
- Bitcoin (BTC)
- Ethereum (ETH)
- Avalanche (AVAX)
- Dogecoin (DOGE)
- Hype (HYPE)
- Ripple (XRP)
- Binance Coin (BNB)
- Cardano (ADA)
- Tron (TRX)
- Chainlink (LINK)
- Shiba Inu (SHIB)
- Toncoin (TON)
- Sui (SUI)
- Stellar (XLM)
## Settings
- **Period**: Timeframe for volatility calculation (default: 20)
- **Standard Deviation Multiplier**: Multiplier for standard deviation (default: 1.0)
- **Show Labels**: Toggle label display on/off
## Calculation Method
The indicator calculates volatility using the following method:
1. Calculate daily logarithmic returns
2. Compute standard deviation over the specified period
3. Annualize (multiply by √252)
4. Convert to percentage (×100)
## Usage
1. Add the indicator to your TradingView chart
2. Adjust parameters as needed
3. Monitor volatility lines for each cryptocurrency
4. Enable labels to see precise current volatility values
## Notes
- This indicator displays in a separate window, not as an overlay
- Volatility values are annualized
- Data for each currency pair is sourced from USD pairs
Release Notes
Translate commentsRelease Notes
Update chartOpen-source script
In true TradingView spirit, the creator of this script has made it open-source, so that traders can review and verify its functionality. Kudos to the author! While you can use it for free, remember that republishing the code is subject to our House Rules.
Made by 🌸
Disclaimer
The information and publications are not meant to be, and do not constitute, financial, investment, trading, or other types of advice or recommendations supplied or endorsed by TradingView. Read more in the Terms of Use.
Open-source script
In true TradingView spirit, the creator of this script has made it open-source, so that traders can review and verify its functionality. Kudos to the author! While you can use it for free, remember that republishing the code is subject to our House Rules.
Made by 🌸
Disclaimer
The information and publications are not meant to be, and do not constitute, financial, investment, trading, or other types of advice or recommendations supplied or endorsed by TradingView. Read more in the Terms of Use.