OPEN-SOURCE SCRIPT
correlation
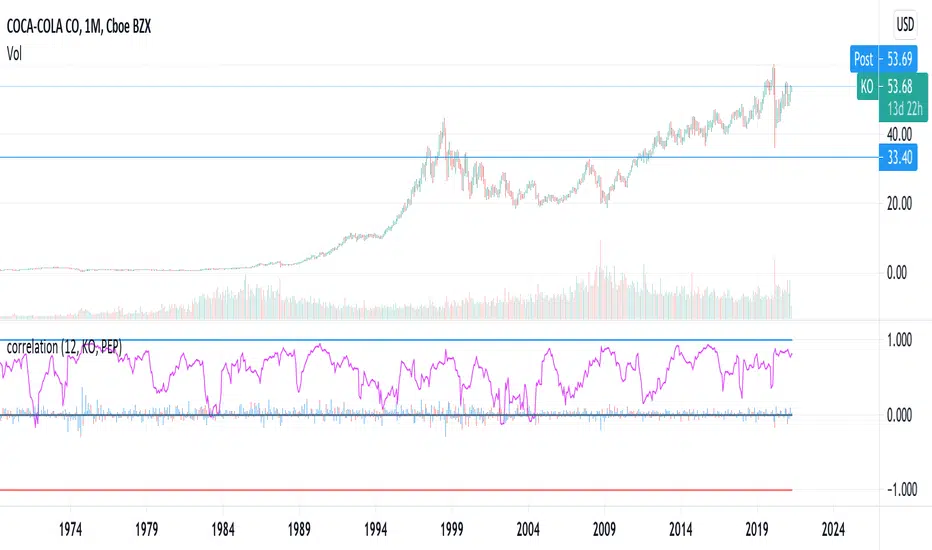
Choose two assets using the inputs, and plot their correlation. The correlation between their percentage returns is shown in purple, and the returns themselves are shown as small histograms.
By default, the correlation is computed over 12 periods, but you can adjust this as well using the inputs.
By default, the correlation is computed over 12 periods, but you can adjust this as well using the inputs.
Open-source script
In true TradingView spirit, the creator of this script has made it open-source, so that traders can review and verify its functionality. Kudos to the author! While you can use it for free, remember that republishing the code is subject to our House Rules.
Disclaimer
The information and publications are not meant to be, and do not constitute, financial, investment, trading, or other types of advice or recommendations supplied or endorsed by TradingView. Read more in the Terms of Use.