OPEN-SOURCE SCRIPT
Asset Selection Indicator by [VanHelsing]

Asset Selection Indicator
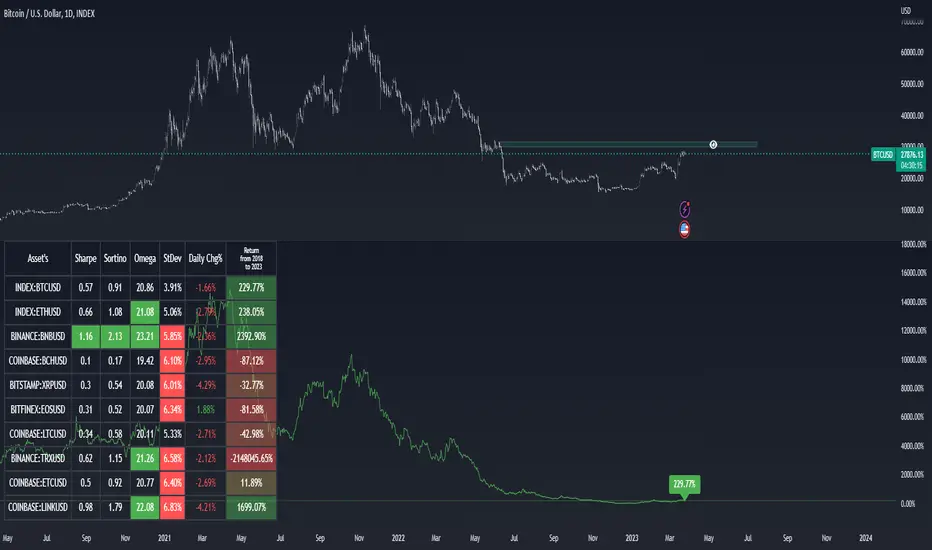
This is a table what will help you to see what asset's are optimal to use in your portfolio or strategies.
By different metrics what are ploted on a table you will see how each individual asset performe compare to other
Sharpe, sortino, omega ratio's are very valueble metriscs in bulding portfolio and now you can easly see them without difficult calculations.
Do you want to know return of asset for 3, 5, 2 years? You are welcome to choose in settings whatever period you want, the same for other metrics
Below is instruction how to use this indicator:
(Explanation of Settings for a period of data)

(Asset selection by Sharpe, Omega, Sortino, StDev)

(How to plot Equity)

And a nice bonus is an alert!
(you can send it to a spreadsheet like I explained in other my indicator "Stock Correlation Table")

This is a table what will help you to see what asset's are optimal to use in your portfolio or strategies.
By different metrics what are ploted on a table you will see how each individual asset performe compare to other
Sharpe, sortino, omega ratio's are very valueble metriscs in bulding portfolio and now you can easly see them without difficult calculations.
Do you want to know return of asset for 3, 5, 2 years? You are welcome to choose in settings whatever period you want, the same for other metrics
Below is instruction how to use this indicator:
(Explanation of Settings for a period of data)
(Asset selection by Sharpe, Omega, Sortino, StDev)
(How to plot Equity)
And a nice bonus is an alert!
(you can send it to a spreadsheet like I explained in other my indicator "Stock Correlation Table")
Open-source script
In true TradingView spirit, the creator of this script has made it open-source, so that traders can review and verify its functionality. Kudos to the author! While you can use it for free, remember that republishing the code is subject to our House Rules.
Disclaimer
The information and publications are not meant to be, and do not constitute, financial, investment, trading, or other types of advice or recommendations supplied or endorsed by TradingView. Read more in the Terms of Use.