OPEN-SOURCE SCRIPT
Updated Choppy Market Identifier - Using Bollinger Bands
The "Choppy Market Identifier" tells you whether the market is currently choppy or trending. A "choppy" market is one where the price is moving up and down within a narrow range without a clear direction, making it difficult to trade profitably.
How this indicator works:
Bollinger Bands are used to plot lines, two standard deviations away from a simple moving average (SMA) of the asset's price.
There three Bollinger Band lines:
The Basis (middle line), which is a simple moving average.
The Upper Band, which is the Basis + standard deviation.
The Lower Band, which is the Basis - standard deviation.
These bands expand and contract based on market volatility.
Price Inside Bollinger Bands:
The script checks if the closing price of the asset is within the Bollinger Bands (between the Upper and Lower bands).
If the price is within the bands, it adds 1 to a sum.
Choppiness Calculation:
Over a specific user defined period, it sums up how many times the price was inside the Bollinger Bands. If the price was inside the bands for more than 80% of this period, the market is considered "choppy".
Visual Representation
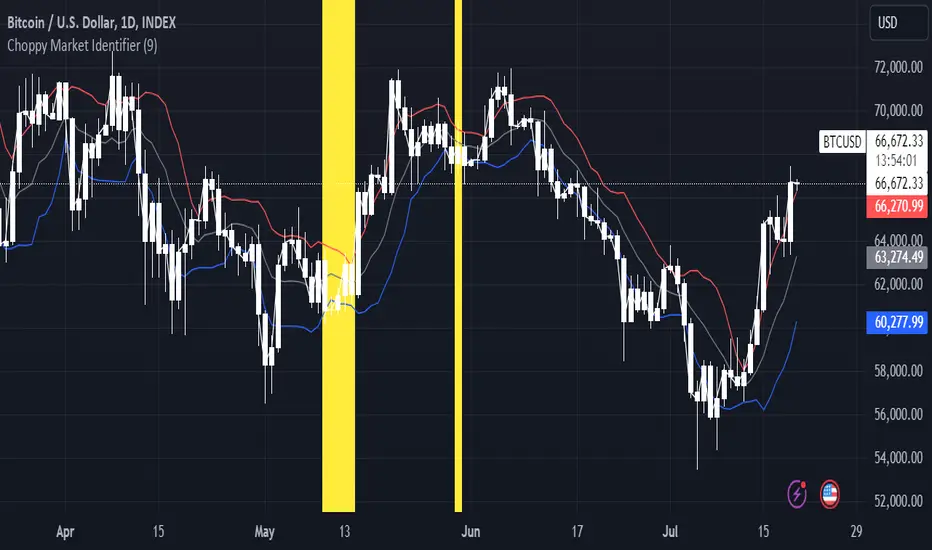
Bollinger Bands:
The Upper and Lower Bands are plotted in different colors (red for Upper, blue for Lower) on the price chart.
The Basis line (gray) shows the simple moving average.
Choppy Market Highlight:
When the market is deemed "choppy" based on the calculation above, the background of the price chart will change to yellow.
Why Is This Indicator Useful?
Choppy Market: In a choppy market, prices move up and down without much overall direction, which can lead to false signals. Traders might choose to avoid trading during these times.
Trending Market: When the market is not choppy (meaning prices are more often outside the Bollinger Bands), it may indicate a clearer trend, which can be more favorable for trading signals.
How To Use It?
Add the "Choppy Market Identifier" indicator to your chart in TradingView.
Interpret the Bands:
Watch for when the yellow background appears. This indicates a choppy market, which suggests that the price is moving within a narrow range and it might be a risky time to trade.
When the yellow background is not present, the market is likely trending, which might present better trading opportunities based on other analysis.
In summary, this indicator helps traders to identify when the market is in a period of low volatility (choppy) versus when it might be trending, thus aiding in making more informed trading decisions.
How this indicator works:
Bollinger Bands are used to plot lines, two standard deviations away from a simple moving average (SMA) of the asset's price.
There three Bollinger Band lines:
The Basis (middle line), which is a simple moving average.
The Upper Band, which is the Basis + standard deviation.
The Lower Band, which is the Basis - standard deviation.
These bands expand and contract based on market volatility.
Price Inside Bollinger Bands:
The script checks if the closing price of the asset is within the Bollinger Bands (between the Upper and Lower bands).
If the price is within the bands, it adds 1 to a sum.
Choppiness Calculation:
Over a specific user defined period, it sums up how many times the price was inside the Bollinger Bands. If the price was inside the bands for more than 80% of this period, the market is considered "choppy".
Visual Representation
Bollinger Bands:
The Upper and Lower Bands are plotted in different colors (red for Upper, blue for Lower) on the price chart.
The Basis line (gray) shows the simple moving average.
Choppy Market Highlight:
When the market is deemed "choppy" based on the calculation above, the background of the price chart will change to yellow.
Why Is This Indicator Useful?
Choppy Market: In a choppy market, prices move up and down without much overall direction, which can lead to false signals. Traders might choose to avoid trading during these times.
Trending Market: When the market is not choppy (meaning prices are more often outside the Bollinger Bands), it may indicate a clearer trend, which can be more favorable for trading signals.
How To Use It?
Add the "Choppy Market Identifier" indicator to your chart in TradingView.
Interpret the Bands:
Watch for when the yellow background appears. This indicates a choppy market, which suggests that the price is moving within a narrow range and it might be a risky time to trade.
When the yellow background is not present, the market is likely trending, which might present better trading opportunities based on other analysis.
In summary, this indicator helps traders to identify when the market is in a period of low volatility (choppy) versus when it might be trending, thus aiding in making more informed trading decisions.
Release Notes
cleaned code Open-source script
In true TradingView spirit, the creator of this script has made it open-source, so that traders can review and verify its functionality. Kudos to the author! While you can use it for free, remember that republishing the code is subject to our House Rules.
Disclaimer
The information and publications are not meant to be, and do not constitute, financial, investment, trading, or other types of advice or recommendations supplied or endorsed by TradingView. Read more in the Terms of Use.
Open-source script
In true TradingView spirit, the creator of this script has made it open-source, so that traders can review and verify its functionality. Kudos to the author! While you can use it for free, remember that republishing the code is subject to our House Rules.
Disclaimer
The information and publications are not meant to be, and do not constitute, financial, investment, trading, or other types of advice or recommendations supplied or endorsed by TradingView. Read more in the Terms of Use.