DEMA Indicator
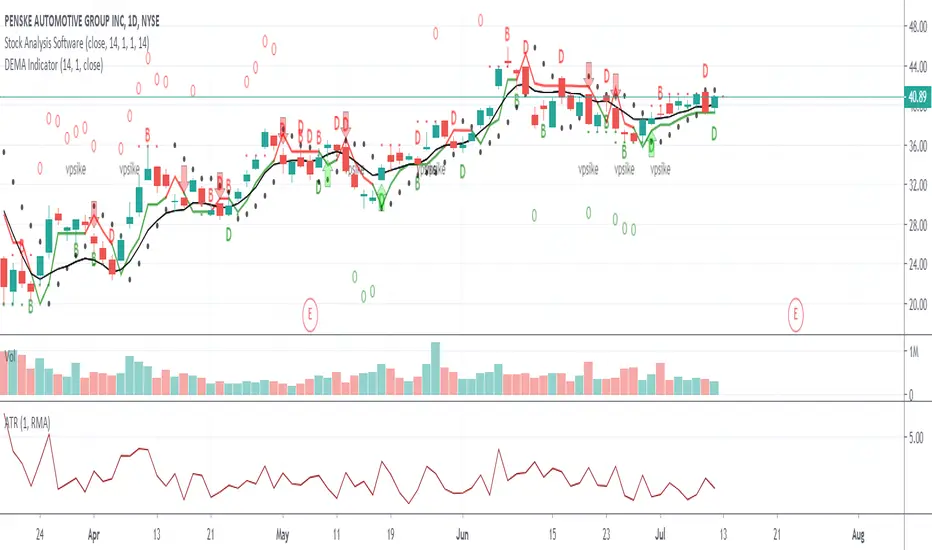
The DEMA indicator is part of the stock analysis software trading system and will highlight on the chart when the moving average and candle are touching on a certain percent ratio. When the candle is GREEN and touching the moving average in the correct ratio it will show a GREEN D below the candle. If the candle is RED and it is touching the moving average in the correct ratio it will plot a RED D above the candle.
If you look at any of these charts you will see the red and green D's. The green D's below the green candles would signal a more bullish looking setup where as a red D would signal a more bearish looking setup.
This indicator is great when added to the complete system to look for entries but also exits. This indicator has been used by myself for many years as a trading professional.
Invite-only script
Only users approved by the author can access this script. You'll need to request and get permission to use it. This is typically granted after payment. For more details, follow the author's instructions below or contact Dancharles directly.
TradingView does NOT recommend paying for or using a script unless you fully trust its author and understand how it works. You may also find free, open-source alternatives in our community scripts.
Author's instructions
Disclaimer
Invite-only script
Only users approved by the author can access this script. You'll need to request and get permission to use it. This is typically granted after payment. For more details, follow the author's instructions below or contact Dancharles directly.
TradingView does NOT recommend paying for or using a script unless you fully trust its author and understand how it works. You may also find free, open-source alternatives in our community scripts.