Triple ADX by KviateqMy favorite indicator to date. It plots three timeframe ADX lines on one chart along with a Key Level.
Once all the lines are above the Key Level the market is trending heavily.
Warning! Just like the standard ADX, the script DOES NOT show the direction of the trend, only its STRENGHT!
I set the secondary ADX's lines to 11, but that can be changed based on your preferences.
Enjoy!
ADX
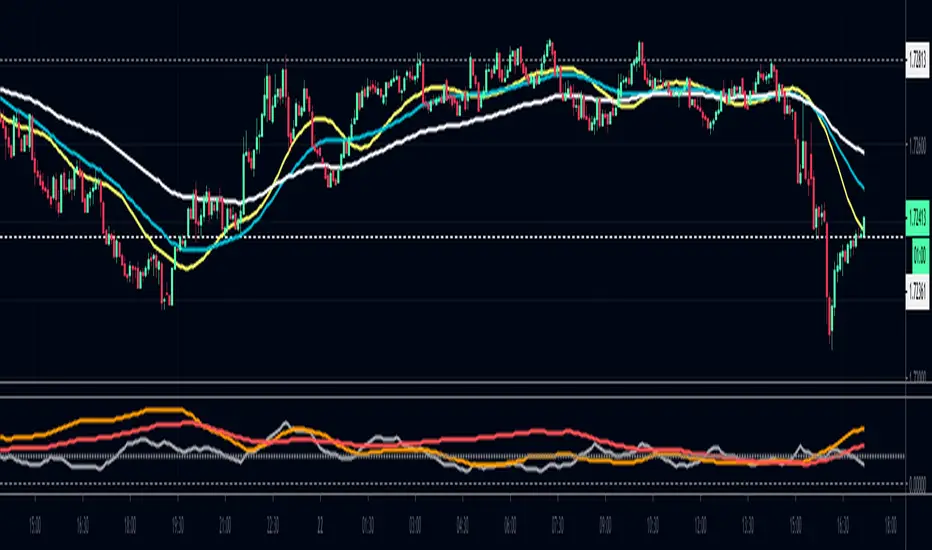
Stochastic RSI 3in1 & Volatility peaks + ADX by AGUDescription:
3 Lines are Stochastic RSI's, strongest move is when all crosses and moves to one direction (from top or bottom).
Orange is original Stochastic of the timeline. (Live movement of price).
Green is original Stoch x 6. (Short term movement).
Red is original Stoch x27 (Long term price movement).
Transparent columns are ADX signal.
Higher the mountain, stronger the signal. When the mountain tops, trend usually change.
And finally the volatility peaks. Green peak HIGHEST volatility , RED peak LOWEST volatility .
I use it on 1 min BTC chart. But it works on all.
TIPS >> 3HCQ41cRpxcq2MJdRUSYoq9N1RnEy98xD2

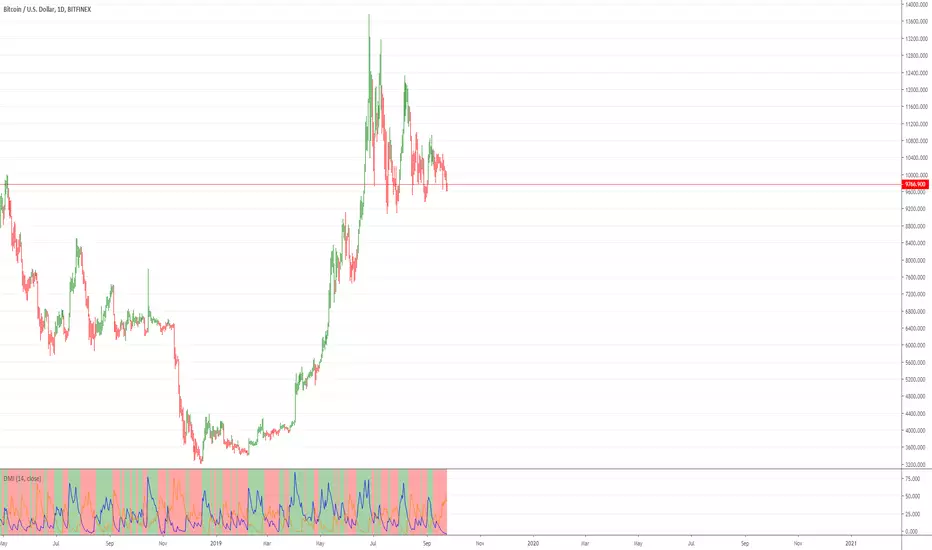
Hashem DMI/ADXThis indicator will time Breakouts.
DMI+ (DMI Plus) = Blue = Buying Pressure.
DMI- (DMI Minus) = Pink = Selling Pressure.
ADX = Overall strength of a Trend. White = Trend is strong and gaining momentum, Gray = Trend is Weakening.
Can apply same logic for Divergences on DMI+ and DMI- lines.

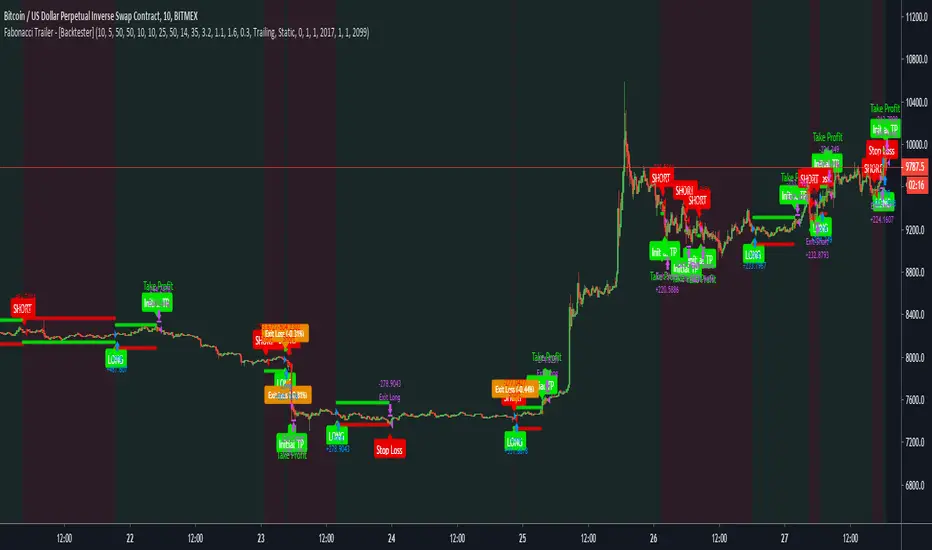
Fabonacci Trailer - [Backtester]This study comes with the following indicators and features:
ADX indicator
Chop indicator
Super Trend indicator
Trailing Take Profit and Stop Loss
Entry, Take Profit, and Stop Loss Alerts
Renko chart support
And a few more indicators in the back-end to increase accuracy and optimize entries
The study version with all alerts can be found in my profile. It is not repainting and we advise to use alerts on “Once Per Bar Close”.
Please note that this script is based on invite only.
Fabonacci Trailer - [Alerts]This script comes with the following indicators and features:
ADX indicator
Chop indicator
Super Trend indicator
Trailing Take Profit and Stop Loss
Entry, Take Profit, and Stop Loss Alerts
Renko chart support
And a few more indicators in the back-end to increase accuracy and optimize entries
This script works really well as a scalper on lower Time Frames as well as on higher Time Frames. Besides that you can also use it on pretty much any coin or asset.
This script is not repainting. We advise to use alerts on “Once Per Bar Close”.
If you’d like to automate this script you can do that by using AutoView, ProfitView, ProfitTrailer, CryptoHopper etc.
Please note that this script is based on invite only.

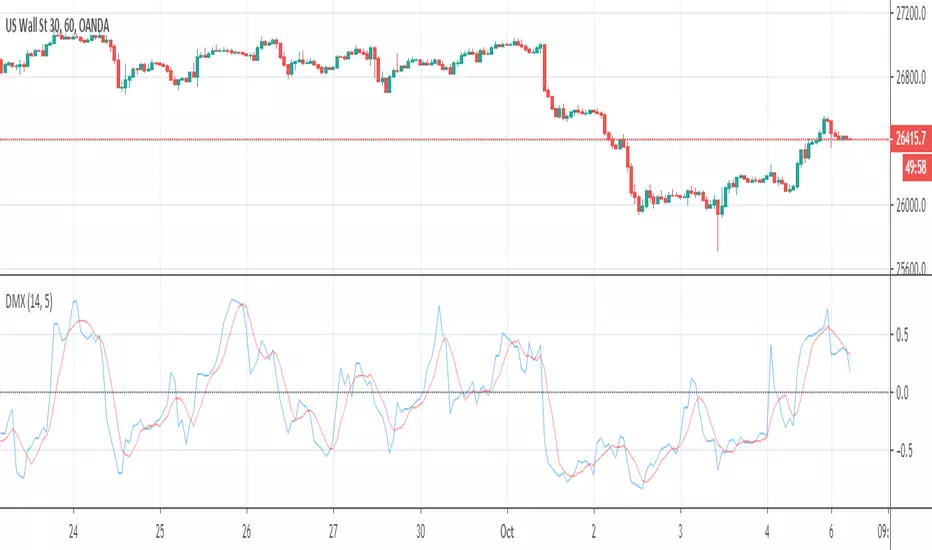
Directional Movement Quality IndexIndicator DMX (Bipolar DMI) is calculated using the standard indicator ADX. However, as compared to that, it displays data as an oscillator with a signal line, and has shorter delay.
DMX = (P-M) / (P+M)
Signal = MA(DMX, Signal period, Method)
where:
P - (+DI) ADX indicator line;
M - (-DI) ADX indicator line.
Source: www.mql5.com
Directional Movement Index with double exponential moving averagThe Directional system is a trend-following method developed by J. Welles Wilder,
in the mid-1970s. It identifies trends and shows
when a trend is moving fast enough to make it worth following. It helps traders to
profit by taking chunks out of the middle of important trends.
Trading Rules
1. Trade only from the long side when the positive Directional line is above the
negative one. Trade only from the short side when the negative Directional line
is above the positive one. The best time to trade is when the ADX is rising, show-
ing that the dominant group is getting stronger.
2. When ADX declines, it shows that the market is becoming less directional. There
are likely to be many whipsaws. When ADX points down, it is better not to use
a trend-following method.
3. When ADX falls below both Directional lines, it identifies a flat, sleepy mar-
ket. Do not use a trend-following system but get ready to trade, because major
trends emerge from such lulls.
4. The single best signal of the Directional system comes after ADX falls below
both Directional lines. The longer it stays there, the stronger the base for the
next move. When ADX rallies from below both Directional lines, it shows that
the market is waking up from a lull. When ADX rises by four steps
from its lowest point below both Directional lines, it “rings a bell” on a
new trend . It shows that a new bull market or bear market is being
born, depending on what Directional line is on top.
5. When ADX rallies above both Directional lines, it identifies an overheated mar-
ket. When ADX turns down from above both Directional lines, it shows that the
major trend has stumbled. It is a good time to take profits on a directional trade.
If you trade large positions, you definitely want to take partial profits.
This particular version uses DEMA (double exponential moving averages) in attempt to catch moves sooner.
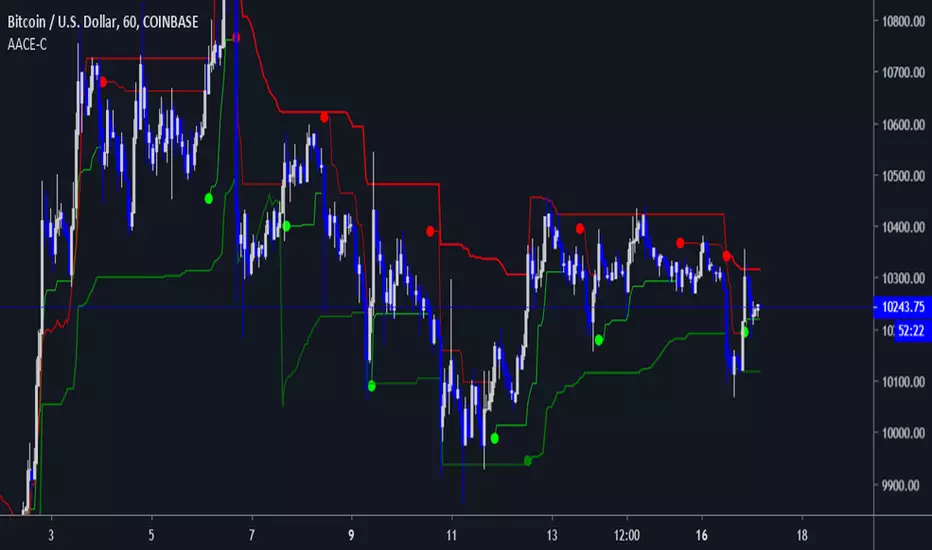
ATR-ADX Chandelier Exit ComboAcknowledgements: Everget for Chandelier Exit indicator, mortdiggiddy
for the Adaptive ATR-ADX Trend indicator
This indicator is a duct-tape combination of the two aforementioned indicators. I wanted a combination of potential stop options, some dynamic and others not, but both at the same time. It is less intrusive/clunky than the Fib-Pivot-Stop indicator, but not by much - I'm not sure how useful this would be considering the amount of visual real estate it takes on the chart compared to other indicators.
ADX Di+ Di- [Gu5]Fill indicates Strong Trend
Cross indicates End of Trend
--
El relleno indica una fuerte tendencia cuando el Di supera "Level Trend"
El cruce de Di+ con Di- indica el fin de la tendencia
Cuando el valor del ADX es menor a "Level Range", estamos en Rango

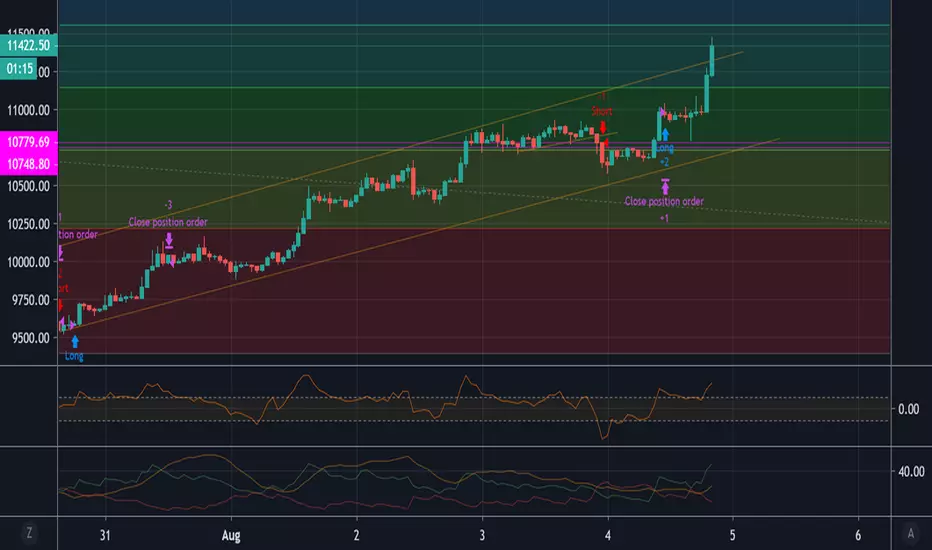
🐮 🆚 🐻 [Alerts]It's a remake of the previous script but for use in reverse positions at the same time.
In this script the reality could be even better than the Backtest, because, only close the position with profit, so profitability should be 100%, and Longs and Shorts don't mix because they are independent.
In real trade, you need an exchange that allows you to go in reverse positions at the same time or where you can have two independent sub-accounts: one for long and one for short and with margin trading. Although, if TP is small and does not mix with other inverse positions, it's not necessary. (With this script, you can go long and short at the same time and with independent configurations)
Settings for ETH at 5 minutes. (If you find good settings please comment)
Enjoy!

🐮 🆚 🐻 [Backtest]It's a remake of the previous script but for use in reverse positions at the same time.
In this script the reality could be even better than the Backtest, because, only close the position with profit, so profitability should be 100%, and Longs and Shorts don't mix because they are independent.
In real trade, you need an exchange that allows you to go in reverse positions at the same time or where you can have two independent sub-accounts: one for long and one for short and with margin trading. Although, if TP is small and does not mix with other inverse positions, it's not necessary. (With this script, you can go long and short at the same time and with independent configurations)
Settings for ETH at 5 minutes. (If you find good settings please comment)
Enjoy!

BO ADX Binary Option strategy based on ADX/DI cross, Put or Call at the beginning of the next candle, expire 5m for 5m candle.


ADX Free-The line control represents, if the ADX is greater than the line of 20, the price trend is considered strong, some people increase it to 25
-Dynamic adx color to better differentiate movements

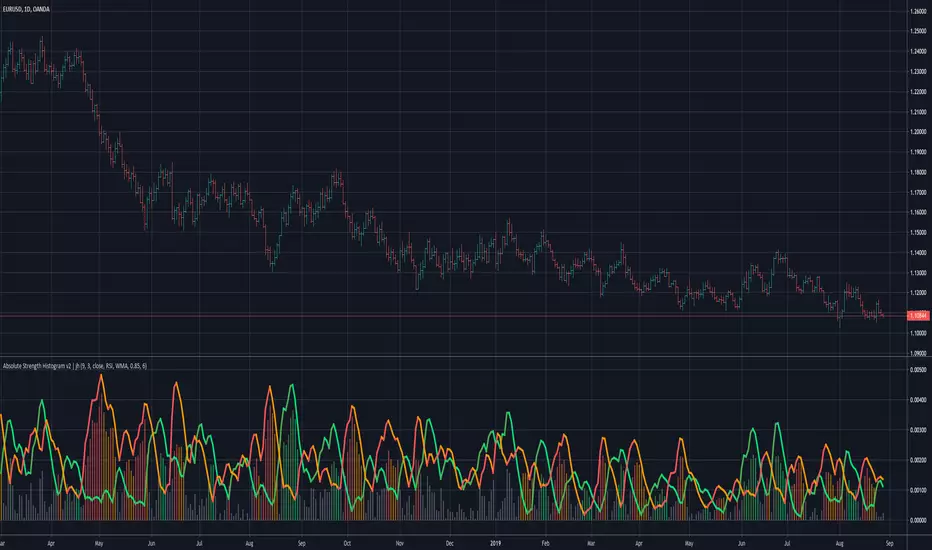
Absolute Strength Histogram v2 | jhv2 changes the way the histogram is plotted.
Histogram shows the strength and can be used to identify trending or ranging periods.

Absolute Strength Histogram | jhOriginal ASH code from alexgrover
Some changes:
- Change the price to SMA with Period of 1 with reference to the original MT4 code
- Added a few more MAs

Highly Optimized (Aroon, DMI, RWI)It is a highly optimized script for H4, D1. Backtests from (2016 - 2019, depending on the currency pair). Optimization still
going on.
Following alerts can be activated:
-
Buy-Signal (Baseline-Cross)!
Sell-Signal (Baseline-Cross)!
Buy Signal (Aroon)!
Sell Signal (Aroon)!
Buy Signal (DMI)!
Sell Signal (DMI)!
Buy Signal (RWI)!
Sell Signal (RWI)!
Can be used by the following pairs:
AUDCAD
AUDCHF
AUDJPY
AUDNZD
AUDSGD
AUDUSD
CADCHF
CADJPY
CHFJPY
CHFSGD
EURAUD
EURCAD
EURCHF
EURGBP
EURJPY
EURNZD
EURSGD
EURTRY
EURUSD
GBPAUD
GBPCAD
GBPCHF
GBPJPY
GBPNZD
GBPSGD
GBPUSD
NZDCAD
NZDCHF
NZDJPY
NZDUSD
SEKJPY
SGDJPY
USDCAD
USDCHF
USDCNH
USDJPY
USDSGD
USDTRY
XRPUSD
Price is 5€ per Month or 75€ lifetime. One week free for testing.

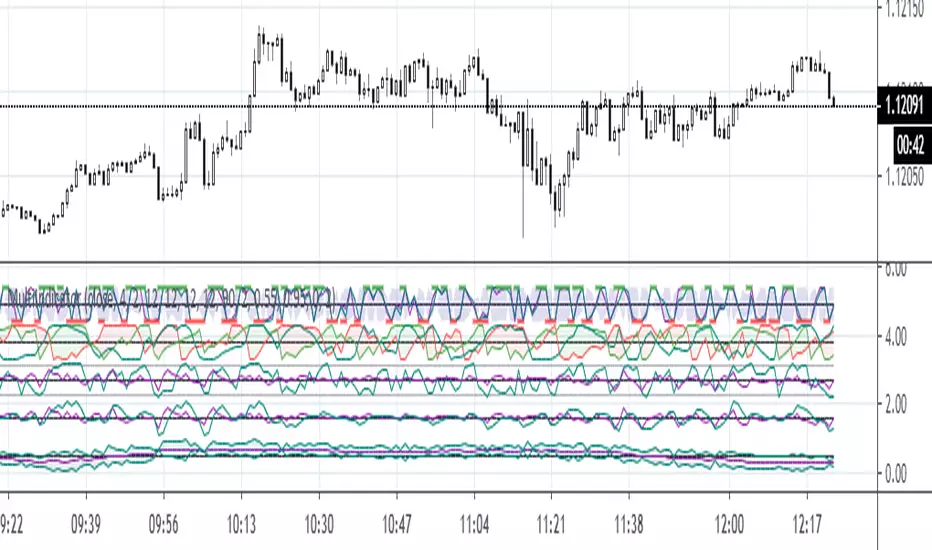
MultiIndicatorThis is just a bunch of useful funtions and
a recommenation how to construct a multiindicator for the sake of economy :))
NOT-ONLY-SHORTThis script is the same as NOT-ONLY-LONG but without the security() function.
It use the following indicators: RMI + ADX + RSI + ICHIMOKU cloud only.
The fuchsia dot is the average price of the positions. The Take Profit is calculated from there.
It does not have Stop Loss, instead it makes a re-entry to try to improve the liquidation price.
Enjoy!

RePaNoCHa V4 [Backtest]This is the Backtest version of the previous one.
It's important to correctly set the "TICKS / PIPS CORRECTION" parameter in each different chart.
Enjoy!