Open Interest Z-Score [BackQuant]Open Interest Z-Score
A standardized pressure gauge for futures positioning that turns multi venue open interest into a Z score, so you can see how extreme current positioning is relative to its own history and where leverage is stretched, decompressing, or quietly re loading.
What this is
This indicator builds a single synthetic open interest series by aggregating futures OI across major derivatives venues, then standardises that aggregated OI into a rolling Z score. Instead of looking at raw OI or a simple change, you get a normalized signal that says "how many standard deviations away from normal is positioning right now", with optional smoothing, reference bands, and divergence detection against price.
You can render the Z score in several plotting modes:
Line for a clean, classic oscillator.
Colored line that encodes both sign and momentum of OI Z.
Oscillator histogram that makes impulses and compressions obvious.
The script also includes:
Aggregated open interest across Binance, Bybit, OKX, Bitget, Kraken, HTX, and Deribit, using multiple contract suffixes where applicable.
Choice of OI units, either coin based or converted to USD notional.
Standard deviation reference lines and adaptive extreme bands.
A flexible smoothing layer with multiple moving average types.
Automatic detection of regular and hidden divergences between price and OI Z.
Alerts for zero line and ±2 sigma crosses.
Aggregated open interest source
At the core is the same multi venue OI aggregation engine as in the OI RSI tool, adapted from NoveltyTrade's work and extended for this use case. The indicator:
Anchors on the current chart symbol and its base currency.
Loops over a set of exchanges, gated by user toggles:
Binance.
Bybit.
OKX.
Bitget.
Kraken.
HTX.
Deribit.
For each exchange, loops over several contract suffixes such as USDT.P, USD.P, USDC.P, USD.PM to cover the common perp and margin styles.
Requests OI candles for each exchange plus suffix pair into a small custom OI type that carries open, high, low and close of open interest.
Converts each OI stream into a common unit via the sw method:
In COIN mode, OI is normalized relative to the coin.
In USD mode, OI is scaled by price to approximate notional.
Exchange specific scaling factors are applied where needed to match contract multipliers.
Accumulates all valid OI candles into a single combined OI "candle" by summing open, high, low and close across venues.
The result is oiClose , a synthetic close for aggregated OI that represents cross venue positioning. If there is no valid OI data for the symbol after this process, the script throws a clear runtime error so you know the market is unsupported rather than quietly plotting nonsense.
How the Z score is computed
Once the aggregated OI close is available, the indicator computes a rolling Z score over a configurable lookback:
Define subject as the aggregated OI close.
Compute a rolling mean of this subject with EMA over Z Score Lookback Period .
Compute a rolling standard deviation over the same length.
Subtract the mean from the current OI and divide by the standard deviation.
This gives a raw Z score:
oi_z_raw = (subject − mean) ÷ stdDev .
Instead of plotting this raw value directly, the script passes it through a smoothing layer:
You pick a Smoothing Type and Smoothing Period .
Choices include SMA, HMA, EMA, WMA, DEMA, RMA, linear regression, ALMA, TEMA, and T3.
The helper ma function applies the chosen smoother to the raw Z score.
The result is oi_z , a smoothed Z score of aggregated open interest. A separate EMA with EMA Period is then applied on oi_z to create a signal line ma that can be used for crossovers and trend reads.
Plotting modes
The Plotting Type input controls how this Z score is rendered:
1) Line
In line mode:
The smoothed OI Z score is plotted as a single line using Base Line Color .
The EMA overlay is optionally plotted if Show EMA is enabled.
This is the cleanest view when you want to treat OI Z like a standard oscillator, watching for zero line crosses, swings, and divergences.
2) Colored Line
Colored line mode adds conditional color logic to the Z score:
If the Z score is above zero and rising, it is bright green, representing positive and strengthening positioning pressure.
If the Z score is above zero and falling, it shifts to a cooler cyan, representing positive but weakening pressure.
If the Z score is below zero and falling, it is bright red, representing negative and strengthening pressure (growing net de risking or shorting).
If the Z score is below zero and rising, it is dark red, representing negative but recovering pressure.
This mapping makes it easy to see not only whether OI is above or below its historical mean, but also whether that deviation is intensifying or fading.
3) Oscillator
Oscillator mode turns the Z score into a histogram:
The smoothed Z score is plotted as vertical columns around zero.
Column colors use the same conditional palette as colored line mode, based on sign and change direction.
The histogram base is zero, so bars extend up into positive Z and down into negative Z.
Oscillator mode is useful when you care about impulses in positioning, for example sharp jumps into positive Z that coincide with fast builds in leverage, or deep spikes into negative Z that show aggressive flushes.
4) None
If you only want reference lines, extreme bands, divergences, or alerts without the base oscillator, you can set plotting to None and keep the rest of the tooling active.
The EMA overlay respects plotting mode and only appears when a visible Z score line or histogram is present.
Reference lines and standard deviation levels
The Select Reference Lines input offers two styles:
Standard Deviation Levels
Plots small markers at zero.
Draws thin horizontal lines at +1, +2, −1 and −2 Z.
Acts like a classic Z score ladder, zero as mean, ±1 as normal band, ±2 as outer band.
This mode is ideal if you want a textbook statistical framing, using ±1 and ±2 sigma as standard levels for "normal" versus "extended" positioning.
Extreme Bands
Extreme bands build on the same ±1 and ±2 lines, then add:
Upper outer band between +3 and +4 Z.
Lower outer band between −3 and −4 Z.
Dynamic fill colors inside these bands:
If the Z score is positive, the upper band fill turns red with an alpha that scales with the magnitude of |Z|, capped at a chosen max strength. Stronger deviations towards +4 produce more opaque red fills.
If the Z score is negative, the lower band fill turns green with the same adaptive alpha logic, highlighting deep negative deviations.
Opposite side bands remain a faint neutral white when not in use, so they still provide structural context without shouting.
This creates a visual "danger zone" for position crowding. When the Z score enters these outer bands, open interest is many standard deviations away from its mean and you are dealing with rare but highly loaded positioning states.
Z score as a positioning pressure gauge
Because this is a Z score of aggregated open interest, it measures how unusual current positioning is relative to its own recent history, not just whether OI is rising or falling:
Z near zero means total OI is roughly in line with normal conditions for your lookback window.
Positive Z means OI is above its recent mean. The further above zero, the more "crowded" or extended positioning is.
Negative Z means OI is below its recent mean. Deep negatives often mark post flush environments where leverage has been cleared and the market is under positioned.
The smoothing options help control how much noise you want in the signal:
Short Z score lookback and short smoothing will react quickly, suited for short term traders watching intraday positioning shocks.
Longer Z score lookback with smoother MA types (EMA, RMA, T3) give a slower, more structural view of where the crowd sits over days to weeks.
Divergences between price and OI Z
The indicator includes automatic divergence detection on the Z score versus price, using pivot highs and lows:
You configure Pivot Lookback Left and Pivot Lookback Right to control swing sensitivity.
Pivots are detected on the OI Z series.
For each eligible pivot, the script compares OI Z and price at the last two pivots.
It looks for four patterns:
Regular Bullish – price makes a lower low, OI Z makes a higher low. This can indicate selling exhaustion in positioning even as price washes out. These are marked with a line and a label "ℝ" below the oscillator, in the bullish color.
Hidden Bullish – price makes a higher low, OI Z makes a lower low. This suggests continuation potential where price holds up while positioning resets. Marked with "ℍ" in the bullish color.
Regular Bearish – price makes a higher high, OI Z makes a lower high. This is a classic warning sign of trend exhaustion, where price pushes higher while OI Z fails to confirm. Marked with "ℝ" in the bearish color.
Hidden Bearish – price makes a lower high, OI Z makes a higher high. This is often seen in pullbacks within downtrends, where price retraces but positioning stretches again in the direction of the prevailing move. Marked with "ℍ" in the bearish color.
Each divergence type can be toggled globally via Show Detected Divergences . Internally, the script restricts how far back it will connect pivots, so you do not get stray signals linking very old structures to current bars.
Trading applications
Crowding and squeeze risk
Z scores are a natural way to talk about crowding:
High positive Z in aggregated OI means the market is running high leverage compared to its own norm. If price is also extended, the risk of a squeeze or sharp unwind rises.
Deep negative Z means leverage has been cleaned out. While it can be painful to sit through, this environment often sets up cleaner new trends, since there is less one sided positioning to unwind.
The extreme bands at ±3 to ±4 highlight the rare states where crowding is most intense. You can treat these events as regime markers rather than day to day noise.
Trend confirmation and fade selection
Combine Z score with price and trend:
Bull trends with positive and rising Z are supported by fresh leverage, usually more persistent.
Bull trends with flat or falling Z while price keeps grinding up can be more fragile. Divergences and extreme bands can help identify which edges you do not want to fade and which you might.
In downtrends, deep negative Z that stays pinned can mean persistent de risking. Once the Z score starts to mean revert back toward zero, it can mark the early stages of stabilization.
Event and liquidation context
Around major events, you often see:
Rapid spikes in Z as traders rush to position.
Reversal and overshoot as liquidations and forced de risking clear the book.
A move from positive extremes through zero into negative extremes as the market transitions from crowded to under exposed.
The Z score makes that path obvious, especially in oscillator mode, where you see a block of high positive bars before the crash, then a slab of deep negative bars after the flush.
Settings overview
Z Score group
Plotting Type – None, Line, Colored Line, Oscillator.
Z Score Lookback Period – window used for mean and standard deviation on aggregated OI.
Smoothing Type – SMA, HMA, EMA, WMA, DEMA, RMA, linear regression, ALMA, TEMA or T3.
Smoothing Period – length for the selected moving average on the raw Z score.
Moving Average group
Show EMA – toggle EMA overlay on Z score.
EMA Period – EMA length for the signal line.
EMA Color – color of the EMA line.
Thresholds and Reference Lines group
Select Reference Lines – None, Standard Deviation Levels, Extreme Bands.
Standard deviation lines at 0, ±1, ±2 appear in both modes.
Extreme bands add filled zones at ±3 to ±4 with adaptive opacity tied to |Z|.
Extra Plotting and UI
Base Line Color – default color for the simple line mode.
Line Width – thickness of the oscillator line.
Positive Color – positive or bullish condition color.
Negative Color – negative or bearish condition color.
Divergences group
Show Detected Divergences – master toggle for divergence plotting.
Pivot Lookback Left and Pivot Lookback Right – how many bars left and right to define a pivot, controlling divergence sensitivity.
Open Interest Source group
OI Units – COIN or USD.
Exchange toggles for Binance, Bybit, OKX, Bitget, Kraken, HTX, Deribit.
Internally, all enabled exchanges and contract suffixes are aggregated into one synthetic OI series.
Alerts included
The indicator defines alert conditions for several key events:
OI Z Score Positive – Z crosses above zero, aggregated OI moves from below mean to above mean.
OI Z Score Negative – Z crosses below zero, aggregated OI moves from above mean to below mean.
OI Z Score Enters +2σ – Z enters the +2 band and above, marking extended positive positioning.
OI Z Score Enters −2σ – Z enters the −2 band and below, marking extended negative positioning.
Tie these into your strategy to be notified when leverage moves from normal to extended states.
Notes
This indicator does not rely on price based oscillators. It is a statistical lens on cross venue open interest, which makes it a complementary tool rather than a replacement for your existing price or volume signals. Use it to:
Quantify how unusual current futures positioning is compared to recent history.
Identify crowded leverage phases that can fuel squeezes.
Spot structural divergences between price and positioning.
Frame risk and opportunity around events and regime shifts.
It is not a complete trading system. Combine it with your own entries, exits and risk rules to get the most out of what the Z score is telling you about positioning pressure under the hood of the market.
Aggregated

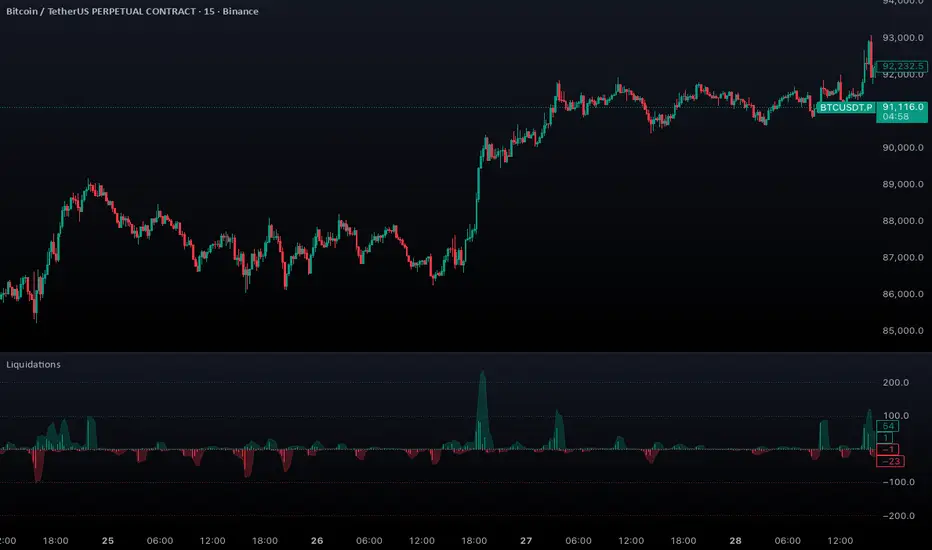
Aggregated Liquidations by ktp. GonzoAggregated Liquidations combines real-time liquidation data from multiple major futures exchanges into a single, unified view. This tool helps traders identify liquidation clusters, squeezes, and high-impact forced-exit events that often mark key reversal or continuation points.
This script delivers a clean, aggregated perspective on one of the most impactful forms of market data—providing clarity during volatile, liquidation-driven moves.
Supported Exchanges
Binance: USDT, USDC, USD
BitMEX: USDT, USD
Bybit: USDT, USDC, USD
Deribit: USDC, USD
HTX: USDT, USD (optional, tick-volume based)
OKX: USDT, USDC, USD (partially reported liquidations)
Toggle each feed individually for complete control over your data sources.
Features
Combined Long & Short Liquidations from all enabled exchanges
Configurable Currency Mode to show liquidation volume in base or quote currency
Adjustable Accumulation Window in bars, minutes, hours, or days
Threshold Lines to quickly spot abnormal liquidation spikes
How to Use
Track liquidation cascades across multiple venues
Spot potential long/short squeezes before price reacts
Identify exhaustion zones where forced liquidations dominate
Combine with order flow, volume, or momentum tools for confirmation
Volume Weighted Average Price AdvancedVWAP (Advanced) with Multi‑Venue Aggregation and Historical Value Areas
Core: Anchored VWAP with configurable anchor (session/week/month/quarter/year/decade/century or corporate events), offset, and up to three standard-deviation bands.
Multi‑Venue Aggregation: Optionally pull price/volume from up to 5 additional exchanges/symbols (pair-matched by default). VWAP/σ are computed on the aggregated price*volume.
Value Area Blocks: Each completed anchor draws a block from the chosen basis (±1σ or ±2σ) or an optional percentile-based range (default 20–80%). Blocks project to the exact next anchor boundary, or you can extend them to the latest bar. Prior-period VWAP lines are shown inside the blocks.
Volume Gate: Optionally skip drawing prior blocks when the anchor’s aggregated volume is below a median/mean baseline times a multiplier.
HTF Context: Optional higher-timeframe VWAP overlay; can filter the current VWAP/bands so they only show when aligned with the HTF VWAP.
Venue Health: Label shows how many extra venues were included (non‑na) and median venue volume; flags divergence when primary volume is below venue median × threshold.
Alerts: Price in current value area (VWAP ±1σ) and price crossing the most recent prior VWAP.
Styling: Bands and fills are minimal; HTF VWAP is a distinct line; value-area blocks are shaded with prior VWAP lines inside.
Configure via the grouped inputs: VWAP Settings, Additional Exchange Sources, Historical Value Areas, HTF Context, and Bands Settings.

Aggregated Open InterestAggregates Open Interest data across 10 major crypto exchanges: Binance, Bybit, Kraken, MEXC, Bitget, BingX, Coinbase, Deribit, HTX, and Crypto.com.
Displays total market OI with candlesticks on intraday timeframes and a step line on daily+ timeframes. Color-coded: teal for increasing OI, red for decreasing OI.
Toggle individual exchanges on/off in settings to customize your view.
With this indicator there is no need to be on the perpetual chart of the asset for the open interest to be displayed.

Aggregated Open Interest Multi-Exchange (USD)This indicator aggregates Open Interest (OI) data from multiple major cryptocurrency exchanges into a single unified view in USD, using data available on TradingView. It automatically adapts to the asset you're viewing on the chart.
Features:
Aggregates OI from 7 major exchanges: Binance, Bybit, OKX, Bitget, Deribit, HTX, and Coinbase
All values converted to USD - unlike native OI which shows contracts/coins
Uses only data available on TradingView platform
Automatically detects the asset from your chart (BTC, ETH, SOL, etc.)
True apples-to-apples comparison across exchanges
Displays as candlesticks showing OI open, high, low, and close
Toggle exchanges on/off individually
Handles different contract types per exchange automatically
Why USD conversion matters:
Traditional OI indicators show values in contracts or crypto units, making it difficult to compare across exchanges. This indicator converts everything to USD, giving you the real dollar value of open positions across all exchanges.
How it works:
Simply add the indicator to any crypto perpetual futures chart. It will automatically fetch and aggregate OI data from all supported exchanges for that asset using TradingView's built-in data feeds, converting everything to USD.
Supported Exchanges:
Binance, Bybit, Bitget, HTX: USDT perpetuals
Deribit: BTC/ETH use USD contracts, others use USDC
OKX: Contract-based (automatically converted)
Coinbase: USDC perpetuals
Perfect for traders who want a comprehensive view of total market Open Interest in USD across exchanges using reliable TradingView data.

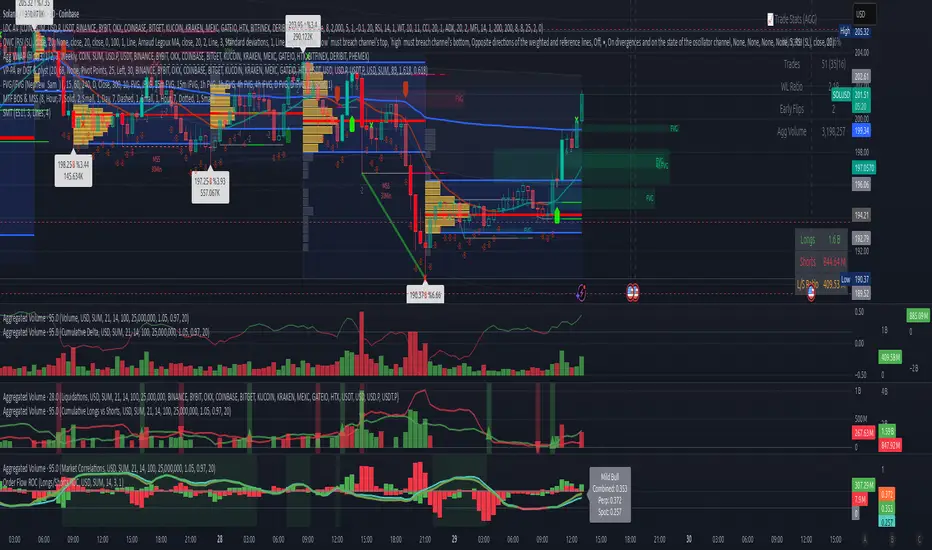
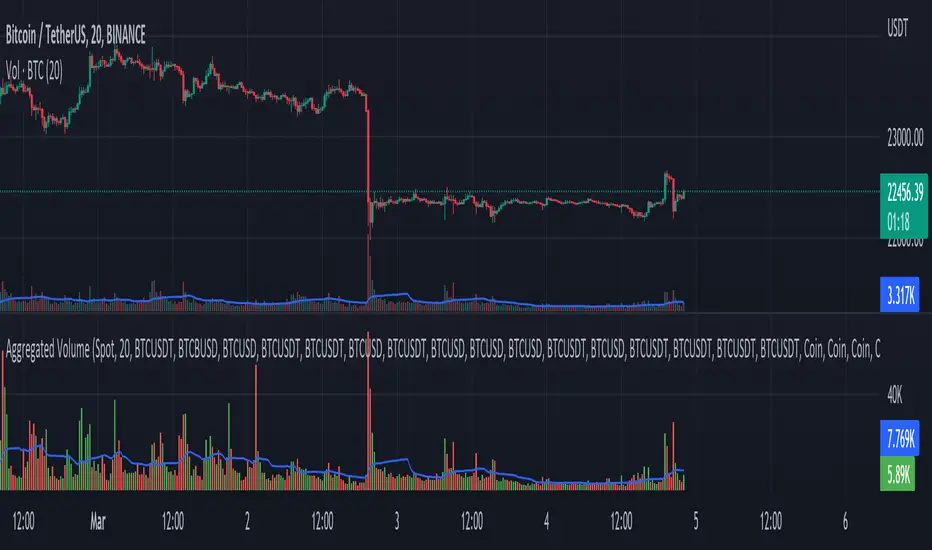
Volume Aggregated Spot & Futures -- Crypto (by plyst & more)📊 Volume Aggregated Spot & Futures - Enhanced Edition
🎯 Overview
Advanced volume aggregation indicator that combines spot and perpetual futures volume across the top 10 cryptocurrency exchanges. This enhanced version builds upon the original work by @HALDRO Project with optimized calculations and expanded functionality.
✨ Key Features
- 📈 Real-time aggregated volume from 10 major exchanges (Binance, Bybit, OKX, Coinbase, Bitget, KuCoin, Kraken, MEXC, Gate.io, HTX)
- 🔄 Multiple visualization modes: Volume, Delta, Cumulative Delta, Spot vs Perp analysis, Liquidations, OBV, and MFI
- 💱 Multi-currency support: Display volume in COIN, USD, or EUR
- 🎨 Clean, single-color bar chart showing total cumulative volume
- 📊 Multiple calculation methods: SUM, AVG, MEDIAN, VARIANCE
- 🎯 Separate spot (USDT, USD, USDC, etc.) and perpetual futures (.P contracts) tracking
🔧 Technical Improvements
✓ Corrected MFI formula for accurate money flow calculations
✓ Optimized volume aggregation logic with proper NA handling
✓ Support for 10 exchanges (up from 9)
✓ Streamlined codebase for better performance
✓ Updated perpetual contract naming conventions (.P format)
📖 Usage
Perfect for analyzing total market volume, identifying liquidation events, tracking buyer/seller pressure through delta analysis, and understanding the spot vs futures market dynamics.
🙏 Credits
Original concept and framework by @HALDRO Project. This version includes mathematical corrections, code optimizations, and expanded exchange support.
⚠️ Note
Aggregated volume is calculated from external exchange data using request.security(). Ensure your plan supports the necessary security calls for optimal performance.
Crypto OI AgregatedCrypto OI Aggregated — Open Interest Aggregator for Crypto Exchanges
General Description
The indicator is designed for comprehensive analysis of Open Interest (OI) across major cryptocurrency exchanges. It consolidates data from multiple platforms, visualizes it as candlestick charts or deltas, and builds tables with breakdowns by exchange and contract type. This allows traders to quickly understand where market interest is concentrated and how the market structure is shifting.
Unlike standard tools that only show data from a single exchange, this indicator provides a full market overview and makes it easy to compare dynamics across different platforms.
⸻
Key Features
• Aggregation of OI data from exchanges: Binance, Bybit, OKX, Bitget, Kraken, HTX, Deribit (feel free to leave a comment if you’d like me to add other exchanges that provide open interest data)
• Support for contract types: USDT.P, USD.P, USDC.P, USD.PM
• Automatic normalization of various OI data formats from different providers
• Display modes:
• OI candlestick chart (total aggregated OI)
• OI Delta (change in OI per bar)
• Full table with detailed data by exchange and contract type
• Short summary table with totals in USD and base assets
• Support for USD or COIN denomination
• Convenient formatting for large numbers
• Customizable colors
⸻
How to Use the Indicator
1. Select Exchanges
In the settings, enable or disable specific exchanges. It is recommended to activate only the ones you need for analysis — this will make the indicator faster.
2. Choose Data Type
• OI — aggregated open interest from selected exchanges.
• OI delta — delta (change in OI compared to the previous bar).
3. Denomination
• USD — values are converted into USD equivalents.
• COIN — values are shown in the base asset (BTC, ETH, etc.).
4. Reading the Chart
• OI candlesticks show the overall OI dynamics.
• Delta histogram highlights how much OI has grown or decreased per bar.
• Colors are fully customizable.
5. Tables
• Enabled via the Show table option.
• Full Table → Rows = exchanges, Columns = contract types. Cells contain OI values in either USD or the base asset, depending on settings. Quickly shows where the main interest is concentrated.
• Short Table → Displays only the total OI values in USD and the base asset.
⸻
Important Notes
• For better readability of large values, two custom formatting functions were implemented. They work similarly to format.volume, but with improved digit grouping and adjustable decimal precision. In the tables, the top row is formatted using format.volume, while the bottom row uses the improved formatting functions for clearer representation.
str(d, n, s) =>
str.substring(d, 0, str.length(d) - n) + '.' + str.substring(d, str.length(d) - n, str.length(d) - (n - 2)) + s
format(_r) =>
d = str.tostring(math.round(_r))
str.length(d) > 9 ? str(d, 9, " B") : str.length(d) > 6 ? str(d, 6, " M") : str.length(d) > 3 ? str(d, 3, " K") : d
⸻
Conclusion: Crypto OI Aggregated is a convenient and powerful tool for cryptocurrency derivatives traders. It enables tracking of OI dynamics across multiple exchanges simultaneously, detecting imbalances between contracts, and identifying signals that are not visible when analyzing a single exchange.

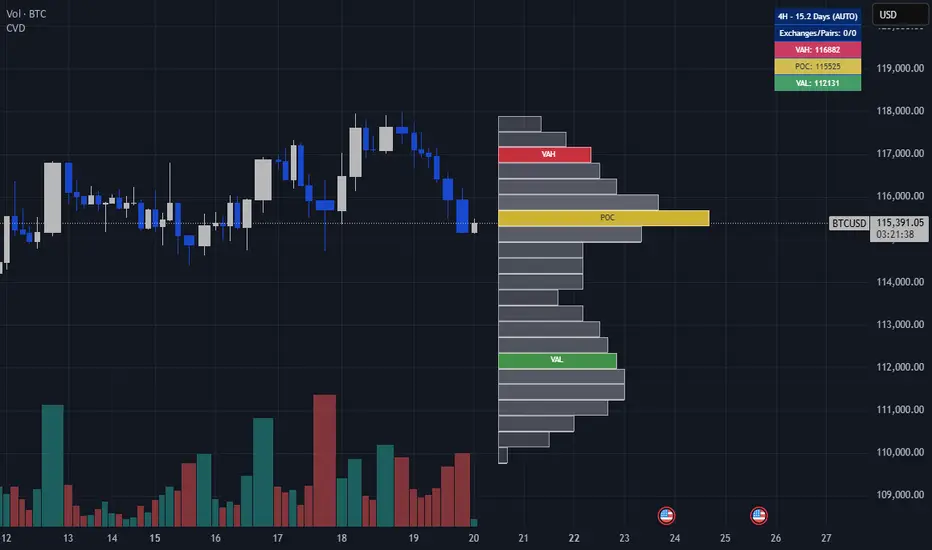
Crypto Volume Data (VAH,POC,VAL)Crypto Volume Data (VAH, POC, VAL) — Multi-Exchange Aggregated Volume Zones
This indicator delivers a high-precision volume profile for crypto assets by aggregating real traded volume across Binance, Bybit, Coinbase, Kraken, OKX, and MEXC. It auto-detects multiple quote pairs (USD, USDT, USDC, FDUSD, USDT.P, USDC.P) and merges the live volume distribution respecting each exchange’s volume for that symbol to calculate institutional-grade VAH, POC, and VAL levels.
No matter which symbol or pair from which exchange is open on the chart, the script dynamically detects the base asset and fetches volume from all matching pairs on supported exchanges. For example, whether you load BTC/USDT, ETH/USDT.P, or SOL/FDUSD, the system identifies the symbol and aggregates volume from all relevant pairs of that symbol across all mentioned exchanges, weighting them based on real volume. This leads to significantly more accurate value areas — especially compared to single-source or single-pair profiles that miss fragmented liquidity and the real volume of each exchange.
This script is fully plug-and-play. There’s no need to select lookback windows or configure pairs — it's already optimized with pre-set internal parameters for common trading timeframes. (Still, you can adjust for your needs in the settings, but keep in mind more lookback is not necessarily a good thing — it might affect the accuracy of your output depending on the timeframe.)
Key Features:
Live aggregation of volume across 5 exchanges
Supports most listed altcoins with reliable quote pair coverage
Dynamic auto symbol/quote detection and normalization
Automatically adapts to any crypto chart without user setup
Real institutional zones — not synthetic, not heuristic
Why It Matters:
In fragmented crypto markets, liquidity isn’t centralized. Volume for a coin like ETH may be split between USDT on Binance, USD on Kraken, or USDC on MEXC. Most indicators ignore that. This tool doesn’t. It brings that volume together to provide the most contextually accurate VAH/POC/VAL levels possible, tailored to the charted asset and timeframe.
This isn't just another volume indicator. It’s built from the ground up to capture where the real trades happen — not just where price moved — and shows you the zones that institutions and large players respect.
Disclaimer:
This tool is for educational and informational purposes only. It does not constitute financial advice or an invitation to trade. Always do your own research and manage risk responsibly.
Credits:
Volume unification logic, cross-pair normalization, and exchange weighting system developed by me. No third-party libraries or reused scripts involved. Original architecture built from scratch for high-resolution crypto volume profile analysis.
Note:
Script designed to respect TradingView limits for both free and paid accounts, with a smart fallback system in case of hitting the limit. If you find any bug, error, or issue, kindly comment below. I will address and fix them ASAP.
Enjoy and cheers.
Aggregated Open Interest [Alpha Extract]The Aggregated Open Interest indicator provides a comprehensive view of open interest across multiple cryptocurrency exchanges, allowing traders to monitor institutional positioning and market sentiment. By aggregating data from major exchanges like Binance, BitMEX, and Kraken, this indicator offers valuable insights into potential price movements and market shifts.
🔶 CALCULATION
The indicator processes open interest data through multiple analytical methods:
Exchange Aggregation: Collects and normalizes open interest data from multiple exchanges (Binance, BitMEX, Kraken) with proper currency normalization.
Multi-Mode Analysis: Calculates various metrics including raw open interest values, OI change, OI delta, volume-weighted delta, and OI RSI.
Divergence Detection: Uses pivot point analysis to identify divergences between price action and open interest movements.
Activity Assessment: Tracks bullish and bearish activity patterns by correlating open interest changes with price movements.
Formula:
Aggregate OI = Sum of normalized open interest from selected exchanges
OI Change = Current OI - Previous OI
OI Delta = Net change in open interest across timeframes
OI Delta × Volume = OI Delta weighted by relative volume
OI RSI = Relative Strength Index applied to open interest values
OI Heatmap = Multi-timeframe visualization of OI changes across 7 distinct periods
🔶 DETAILS
Visual Features:
Open Interest: Candlestick representation of aggregated open interest
OI Change: Histogram showing period-to-period changes
OI Delta: Histogram displaying net OI movements
OI Delta × Volume: Volume-weighted OI delta for enhanced signals
OI RSI: Oscillator showing overbought/oversold OI conditions
OI Heatmap: Multi-timeframe visualization showing OI changes across 7 periods (3, 5, 8, 13, 21, 34, and 55 days)
Divergence Detection: Color-coded markers (teal for bullish, red for bearish) highlighting significant divergences between price and open interest
Analysis Table: Real-time summary of key metrics including aggregate OI, recent changes, and bullish/bearish activity.
Interpretation:
Increasing Open Interest + Rising Price: Strong bullish trend confirmation
Increasing Open Interest + Falling Price: Strong bearish trend confirmation
Decreasing Open Interest + Rising Price: Weak bullish trend (potential reversal)
Decreasing Open Interest + Falling Price: Weak bearish trend (potential reversal)
Divergences: Signal potential trend exhaustion and reversals when price moves in one direction while open interest moves in the opposite direction
Heatmap: Provides at-a-glance insight into open interest trends across multiple timeframes, with green bars indicating rising OI and red bars indicating falling OI
🔶 EXAMPLES
Trend Confirmation: Rising open interest accompanying a price increase confirms strong bullish momentum with institutional backing.
Example: During January-February 2025, rising OI during price advances confirms institutional participation in the uptrend.
Bearish Divergence: Price makes a higher high while open interest makes a lower high, signaling potential trend reversal.
Example: Red markers appear at market tops where price continues higher but open interest fails to confirm, preceding significant corrections.
Bullish Divergence : Price makes a lower low while open interest makes a higher low, indicating potential bottoming.
Example: Teal markers appear at market bottoms where price continues lower but open interest fails to confirm, preceding significant rallies.
OI Heatmap Analysis : Multiple timeframes showing consistent red signals across short to long-term periods indicate strong institutional selling pressure.
Example: When all 7 periods (3-55 days) show red during a price uptrend, this signals institutional selling into retail strength, often preceding major corrections.
🔶 SETTINGS
Customization Options:
Data Sources: Toggle different exchanges (Binance USDT/USD/BUSD, BitMEX USD/USDT, Kraken USD)
Display Mode: Choose between Open Interest, OI Change, OI Delta, OI Delta × Volume, OI RSI, and OI Heatmap
Currency Units: Display in USD or base cryptocurrency (COIN)
Analysis Tools: Moving Average (length and color), RSI (length and color)
Divergence Detection: Enable/disable signals, adjust lookback period and threshold percentage, customize bullish/bearish divergence colors
OI Heatmap Colors: Customize bullish (green) and bearish (red) signal colors for the multi-timeframe heatmap visualization
The Aggregated Open Interest indicator provides traders with comprehensive insights into institutional positioning across major exchanges, helping identify potential trend continuations, reversals, and key market turning points driven by smart money movements. The addition of the OI Heatmap feature enables traders to quickly visualize open interest trends across multiple timeframes, providing valuable context for institutional positioning over different market cycles.

mrD Open InterestIntroduction
"mrD Open Interest" is a technical analysis reference tool that can help investors monitor and analyze Open Interest data from various cryptocurrency exchanges. This indicator provides insights into Open Interest data through patterns, bursts, and money flow based on proprietary algorithms.
Important Note
Trading always involves risk and can lead to capital loss. This indicator should only be used as a supplementary tool in technical analysis and should not be considered as an accurate forecasting tool or the sole basis for trading decisions. Past results do not guarantee future results.
Proprietary Features of the Indicator
"mrD Open Interest" has been developed with several proprietary features, qualifying it for source code protection when published:
- Unique Multi-Source Integration Algorithm: The indicator uses a smart aggregation method to combine OI data from multiple exchanges, creating a holistic view of market pressure that is not dependent on a single exchange. This method employs special weighting and noise filtering to ensure the aggregated data accurately reflects market conditions.
- Proprietary OI-Price Correlation Analysis Algorithm: Unlike traditional OI indicators that simply display OI values, this indicator uses a complex algorithm to analyze the correlation between price movements and OI changes. This algorithm automatically identifies four money flow patterns (Buy Inflow, Sell Inflow, Buy Outflow, Sell Outflow) and ranks them by potential market impact.
- Advanced Burst Detection Technology: The proprietary algorithm identifies "bursts" - sudden changes in OI that can lead to significant market volatility. This system relies not only on absolute change but also analyzes the rate of change, amplitude, and correlation with historical peaks/troughs to determine the significance of a burst.
- Integrated Smart Alert System: The indicator features a smart alert algorithm, only sending notifications when patterns with high statistical significance are detected, reducing "alert noise" and helping users focus on the most potential opportunities.
- Visual Representation Technology: The user interface design uses proprietary visual representation technology, allowing users to easily identify important patterns and signals through a special system of colors, icons, and display formats.
Features That May Assist
1. Reference Data from Multiple Exchanges: The indicator can collect Open Interest information from various exchanges (Binance, BitMEX, Kraken) and different currency pairs (USDT, USD, BUSD), potentially providing investors with more information about the market.
2.Money Flow Pattern Analysis: The indicator suggests 4 patterns that may help identify market conditions:
Buy Inflow: Potential opening of new long positions (price up, OI up)
Buy Outflow: Potential closing of long positions (price down, OI down)
Sell Inflow: Potential opening of new short positions (price down, OI up)
Sell Outflow: Potential closing of short positions (price up, OI down)
Burst Identification: The indicator attempts to detect "bursts" - notable changes in Open Interest that may signal changes in money flow. Bursts are divided into two types: Up Burst and Down Burst.
3. Price-OI Correlation Reference: The tool provides information about the relationship between price movement and OI changes, potentially helping to assess whether current price momentum is supported by new money flow.
4. Diverse Display Modes: The indicator offers 3 display modes (Columns, Candles, Columns, and Price Line) that may suit different analytical approaches.
Setup and Usage Guide
1. Basic Setup
Select Data Sources (Exchange Settings):
By default, the indicator uses data from Binance USDT Perpetual.
Depending on the coin pair and exchange you're interested in, you can enable/disable different data sources (Binance USD, BUSD, BitMEX USD, USDT, or Kraken).
Recommendation: For popular coins like BTC or ETH, consider combining data from 2-3 major exchanges for a more comprehensive view.
2. Display Customization (Visuals Settings):
OI Display Type: Choose a display type that suits your analysis style:
"Columns": Column format, making it easy to identify OI changes.
"Candles": Candle format, similar to price charts, helps identify candlestick patterns in OI.
"Columns and Price Line": Combines OI columns and price line, helping directly compare OI with price movements.
Show background: Enable to highlight burst periods with a colored background (recommended when using candle mode).
Show signals: Enable to display of burst indicators on the chart (recommended to keep enabled).
Text Color: Customize text color to match your chart background.
3. Alert Settings:
hoose alert types that suit your trading strategy:
"Inflows Only": Only alerts when new money flows into the market.
"Outflows Only": Only alerts when money flows out of the market.
"Bursts Only": Only alerts when there's a strong burst in OI.
"All": Alerts for all the above events.
Effective Usage
Trend Analysis Based on Money Flow Patterns:
Buy Inflow (Green): When the price increases along with OI, it may indicate new buying pressure. Can be considered as a supportive signal for an uptrend.
Sell Inflow (Red): When price decreases along with increasing OI, it may indicate new selling pressure. Can be considered as a supportive signal for a downtrend.
Buy Outflow (Teal): When price decreases but OI also decreases, it may indicate taking profit/cutting loss from long positions. Usually not strong selling pressure and may be ending soon.
Sell Outflow (Dark Red): When the price increases but OI decreases, it may indicate closing of short positions. Usually not strong buying pressure and may be ending soon.
Burst Analysis:
Up Burst: Strong and positive change in OI, most notable when occurring in a Buy Inflow pattern, may signal strong buying money flow into the market.
Down Burst: Strong and negative change in OI, most notable when occurring in a Sell Inflow pattern, may signal strong selling money flow into the market.
Bursts are often signals that deserve special attention and may indicate strong changes in market sentiment.
Using the Information Table:
Monitor "Aggregated OI" to capture the total amount of open contracts.
Pay attention to "OI Change (%)" to assess the degree of change compared to the previous candle.
"Relative OI" provides information about the relative level of OI compared to the average.
"Flow Type" indicates the current money flow pattern.
"Burst Status" displays the burst status if any.
Combining with Other Indicators:
Use in combination with trend indicators (MA, MACD) to confirm trends.
Combine with volume indicators for a more comprehensive view of market activity.
Reference additional momentum indicators to assess trend strength.
Customizing According to Timeframe:
Short timeframes (1m-15m): May show more noise signals.
Medium timeframes (30m-4h): Often provide a good balance between sensitivity and noise filtering.
Long timeframes (D-W): Suitable for monitoring long-term OI trends.

Volume Aggregated Spot & FuturesAggregated volume for cryptos using spot and perpetual contracts but only those that are based on normal volume and not on tick volume.
Provides more reliable volume than volume from one provider.
Thanks to HALDRO because it's his code and I simplified it to create this version.
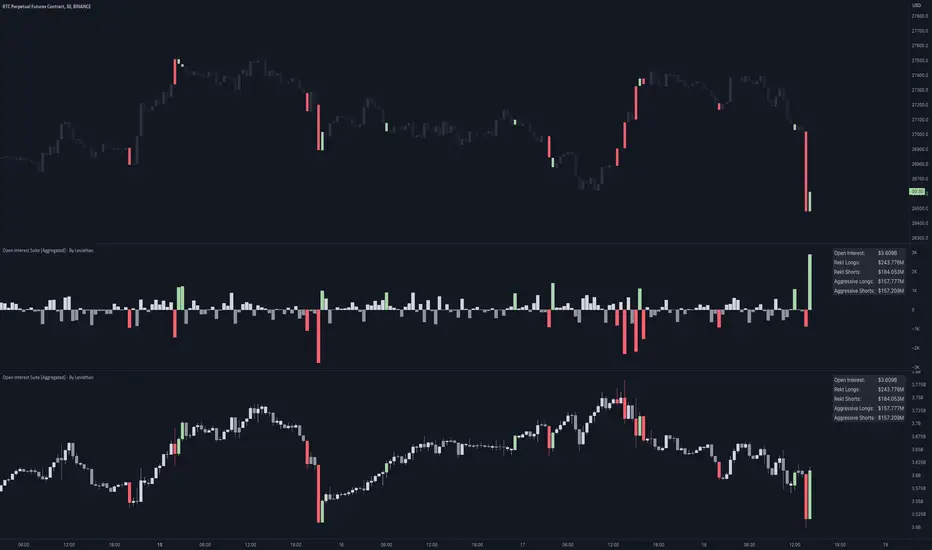
Open Interest Suite [Aggregated] - By LeviathanThis script is an all-in-one indicator that uses aggregated Open Interest data to plot OI candles, Open Interest Delta, OI x rVOL, and OI RSI. It also includes tools such as an OI Distribution profile, large OI increase/decrease coloring, a Stats Screener, and much more.
You can select and have the script plot the following:
- Open Interest in the form of OHLC candles
- Open Interest Delta in the form of a histogram
- Open Interest x Relative Volume in the form of a histogram
- Open Interest RSI in the form of a line
Additional features include:
- OI Distribution Profile (It shows the distribution of open interest in the visible range on y axis. This makes it easier to identify when Open Interest is relatively high or low and at which values most of the action took place)
- Stats screener (The screener includes the real-time net Open Interest value, Rekt Longs/Rekt Shorts based on large OI decreases and Aggressive Longs/Shorts based on large OI increases)
- Coloring (You can color OI Delta nodes, background and chart candles based on large OI increases/decreases)
- more
Instructions for the settings will be provided in the tooltips shortly.
Full credit goes to @KioseffTrading for the profile generation code.
Aggregated VWAP by AncheAbout this indicator
Aggregated VWAP shows you a combined VWAP of different assets which you can choose inside the options panel.
This allows you to select the same asset from multiple exchanges and the indicator plots a VWAP based on all the prices of the selected tickers.
The above image shows you the VWAP of the current asset (red, thick line) and an Aggregated VWAP of BTCUSD from this exchange + 5 others (black line). This clearly shows a discrepancy between both values.
How to use
Open the options of the indicator, at the bottom you will find 5 input fields to select 5 tickers. This allows you to select your asset from different exchanges so that their value gets computed inside the value for the Aggregated VWAP.
Inside the "style" settings you can change colors, lines, etc.

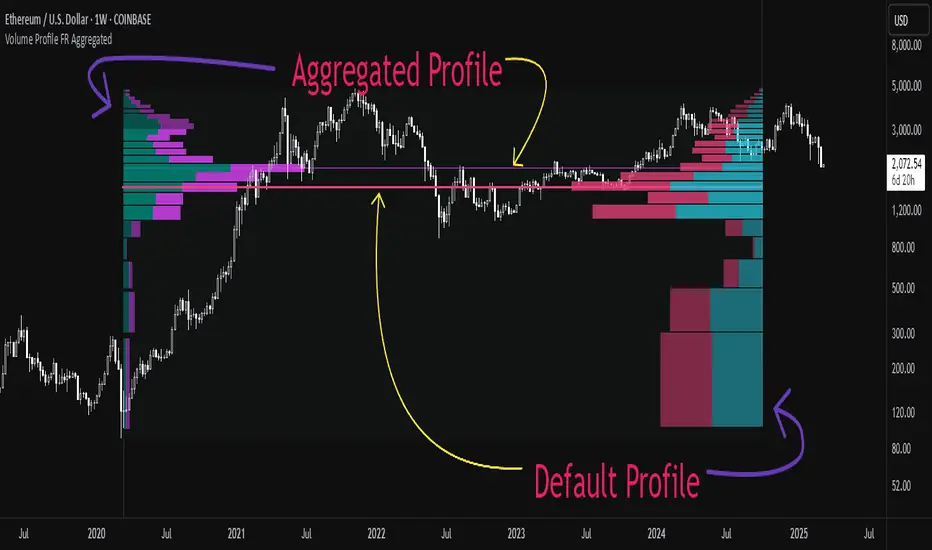
Aggregated Volume Profile Spot & Futures ⚉ OVERVIEW ⚉
Aggregate Volume Profile - Shows the Volume Profile from 9 exchanges. Works on almost all CRYPTO Tickers!
You can enter your own desired exchanges, on/off any others, as well as select the sources of SPOT, FUTURES and others.
The script also includes several input parameters that allow the user to control which exchanges and currencies are included in the aggregated data.
The user can also choose how volume is displayed (in assets, U.S. dollars or euros) and how it is calculated (sum, average, median, or dispersion).
WARNING Indicator is for CRYPTO ONLY.
______________________
⚉ SETTINGS ⚉
‾‾‾‾‾‾‾‾‾‾‾‾‾‾‾‾‾‾‾‾‾‾
Data Type — Choose Single or Aggregated data.
• Single — Show only current Volume.
• Aggregated — Show Aggregated Volume.
Volume By — You can also select how the volume is displayed.
• COIN — Volume in Actives.
• USD — Volume in United Stated Dollar.
• EUR — Volume in European Union.
• RUB — Volume in Russian Ruble.
Calculate By — Choose how Aggregated Volume it is calculated.
• SUM — This displays the total volume from all sources.
• AVG — This displays the average price of the volume from all sources.
• MEDIAN — This displays the median volume from all sources.
• VARIANCE — This displays the variance of the volume from all sources.
• Delta Type — Select the Volume Profile type.
• Bullish — Shows the volume of buyers.
• Bearish — Shows the volume of sellers.
• Both — Shows the total volume of buyers and sellers.
Additional features
The remaining functions are responsible for the visual part of the Volume Profile and are intuitive and I recommend that you familiarize yourself with them simply by using them.
________________
⚉ NOTES ⚉
‾‾‾‾‾‾‾‾‾‾‾‾‾‾‾‾
If you have any ideas what to add to my work to add more sources or make calculations cooler, suggest in DM .
Also I recommend exploring and trying out my similar work.
Aggregated Volume Spot & Futures ⚉ OVERVIEW ⚉
The indicator presents a comprehensive approach to Aggregated Volume Data . Works on almost all CRYPTO Tickers!
The script also includes several input parameters that allow the user to control which exchanges and currencies are included in the aggregated data.
This script allows the user to choose from several data display modes, including volume, spot & perp, delta, cumulative delta, and others.
The user can also choose how volume is displayed (in assets, U.S. dollars or euros) and how it is calculated (sum, average, median, or dispersion).
WARNING Indicator is for CRYPTO ONLY.
______________________
⚉ SETTINGS ⚉
‾‾‾‾‾‾‾‾‾‾‾‾‾‾‾‾‾‾‾‾‾‾
Mode — Choose Mode.
• Volume — This displays the Volume
• Volume (Colored) — Shows aggregated volume but applying different volume colors for different exchanges.
• Delta — This displays the difference between the number of sellers and buyers.
• Cumulative Delta — This displays the cumulative delta between sellers and buyers.
• Spot & Perp — Shows Spot and Futures volume at the same time.
• Delta (Spot - Perp) — Shows the difference between Spot and Futures Volume.
• Liquidations — Displays Potential Liquidations. (Calculated between the difference in volume between Futures and Spots)
• OBV — On Balance Volume.
• MFI — Money Flow Indicator.
• Data Type — Choose Single or Aggregated data.
• Single — Show only current Volume.
• Aggregated — Show Aggregated Volume.
Volume By — You can also select how the volume is displayed.
• COIN — Volume in Actives.
• USD — Volume in United Stated Dollar.
• EUR — Volume in European Union.
• RUB — Volume in Russian Ruble.
Calculate By — Choose how Aggregated Volume it is calculated.
• SUM — This displays the total volume from all sources.
• AVG — This displays the average price of the volume from all sources.
• MEDIAN — This displays the median volume from all sources.
• VARIANCE — This displays the variance of the volume from all sources.
* 🡅 Be Careful, Reacts to Every Mode.
Additional features
• Show MA — Show Movieng Average of Volume.
• MA Period — Period of MA.
• Lookback — Lookback period for 'Cumulative Delta' and for 'MFI'.
• Liquidation Filter — Filters out small or negative difference values.
• Show Table — Table shows the current volume of the last candle. Also in the Mode "Colored" shows the color of exchanges if they have volume.
________________
⚉ NOTES ⚉
‾‾‾‾‾‾‾‾‾‾‾‾‾‾‾‾
I don't pretend to be the best choice for calculating CVD , Delta and Liquidations, the calculations are chosen to be optimal from what I have seen and know.
If you have any ideas what to add to my work to add more sources or make calculations cooler, suggest in DM .

Relative Aggregate Strength OscillatorCredits to
@wolneyyy - "Mean Deviation Detector - Throw Out All Other Indicators"
And
@algomojo - "Responsive Coppock Curve"
And the default Relative Strength Index
The candles are the average of the MFI ,CCI ,MOM and RSI values presented as candles, they seemed similar enough in style to me so I created candles out of each and the took the sum of all the candle's OHLC values and divided by 4 to get an average.
In the Background we have @wolneyyy's - "Mean Deviation Detector - Throw Out All Other Indicators" in blue
along with @algomojo's - "Responsive Coppock Curve" in red and green.

.b BTC-Exchange volumeBINANCE:BTCUSDT
It's tool to check exchange trading status.
You can see "BTC-exchange's realtime trading volume, previous closed volume" at once.
You can switch to see 'Previous close volume' on script's panel.
Timeframe recommended ; 15m, 1H, 4H, D, W, whatever.
Each exchange may have a different volume display unit, so I converted it into roughly BTC units. (using hl2 price)
This indicator aims to recognize the difference in the trading volume of the exchange at once.
It's not for the purpose of check the exact trading volume.
All data come from tradingview.
The comparison target exchanges refer to the ranking of CoinMarketCap.
if you have any questions freely contact to me by message on tradingview, or telegram @sr_bt
but please understand that responses may be quite late.

Aggregated Moving AveragesUsers can display moving averages from higher time frame charts and display them on their current chart. This script supports up to 4 moving averages aggregated from a selected time frame. Each plot can be toggled if the user does not wish to have all 4 plots displayed.
Inputs allow user to edit:
Moving average length
Average type
Color
Timeframe input allows user to select which timeframe the moving averages are calculated from.
If you wish to have multiple timeframes across different moving averages, it is recommended you add a separate copies of the indicator for each timeframe you wish to display. Toggle visibility of which plots which you don't need.
Aggregated Volume - By InFinitoVolume indicator that works like a normal Volume indicator with the following additional features:
- Aggregates Volume across different exchanges and Market Types - *Original Aggregation Code By Crypt0rus*
- Displays data by Market Type and combinations of Market Types (Spot, Futures , Perpetuals, Futures+Perpetuals & All Volume )
- Allows for the user to select the exchanges from which to aggregate Volume (This allows for the aggregation of any other pair i.e ETH, SOL, LUNA)
- Normalizes the Volume reported through TradingView by every exchange in order to homogenize the data (i.e Binance reports Bitcoin Volume in BTC terms BUT FTX reports Bitcoin Volume in USD)
- Allows for manual input of how Volume is reported in a particular Pair/Exchange (i.e If you want to aggregate data from the BTCEUR pair, you can select 'Other' and introduce the Value of EUR in USD terms)
COIN: Select this option if the volume is reported in terms of the asset traded ( BTC , ETH, SOL, etc....)
USD: Select this option if the Volume is reported in terms of the USD amount traded
OTHER: Select this option in case the Volume is reported in another currency (EUR, ETH, etc....)
NOTE: *ALL VOLUME IS AGGREGATED IN TERMS OF THE ASSET TRADED, FOR EXAMPLE IN THIS CASE: BTC . BUT IF YOU'RE AGGREGATING BNB PAIRS, VOLUME WILL BE CALCULATED TO BE DISPLAYED IN BNB TERMS*
Feel free to leave suggestions/questions in the comments or to message them directly to me
Stablecoin DominanceThis simple indicator combines all the currently available stable-coin dominance values into one percentage; the first of its kind public on TradingView !
If trading view adds more in the future I will add them as well, and feel free to leave suggestions in the comments below :)

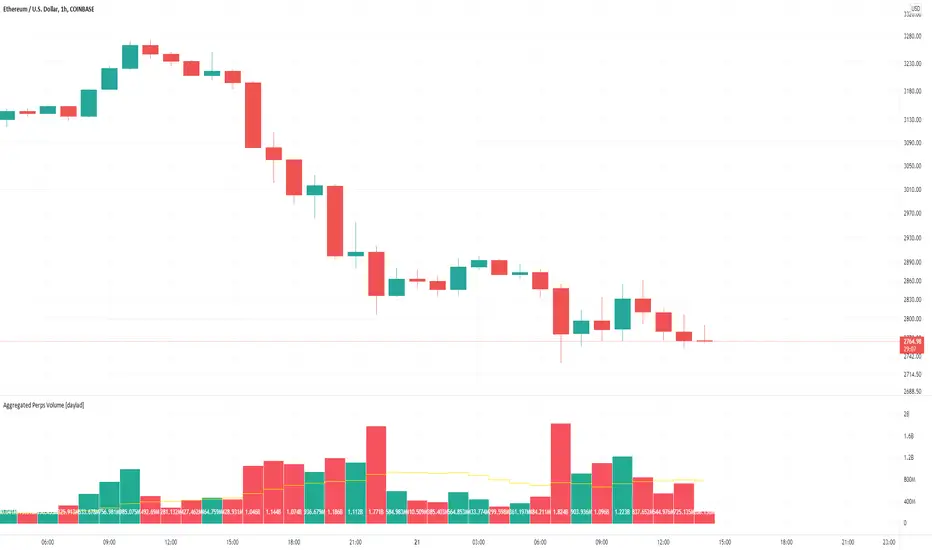
Aggregated Perps Volume [daylad]Same thing as my aggregated spot volume indicator, but for crypto perpetual futures contracts ().
Works with any crypto chart! No need to manually update symbols, this indicator will detect if there is a matching symbol and add it automatically!
The price labels display the total volume per bar in USD.
Pulls data for the following pairs (when available):
BINANCE: + base_symbol + PERP
BINANCE: + base_symbol + BUSDPERP
BINANCE: + base_symbol + USDTPERP
OKEX: + base_symbol + USDTPERP
OKEX: + base_symbol + PERP
FTX: + base_symbol + PERP
PHEMEX: + base_symbol + USD
BYBIT: + base_symbol + USD
BYBIT: + base_symbol + USDT
DERIBIT: + base_symbol + PERP
HUOBI: + base_symbol + PERP
BTSE: + base_symbol + PFC
EXAMPLE -- If you're looking at the COINBASE:SOLUSD chart the indicator will automatically aggregate the volume from BINANCE:SOLPERP, FTX:SOLPERP...etc... BYBIT:SOLUSDT...etc... BTSE:SOLPFC. If an exchange does not have a corresponding pair, then that pair returns 0 and does not add to the total.
If you have any questions feel free to ask. Happy trading!
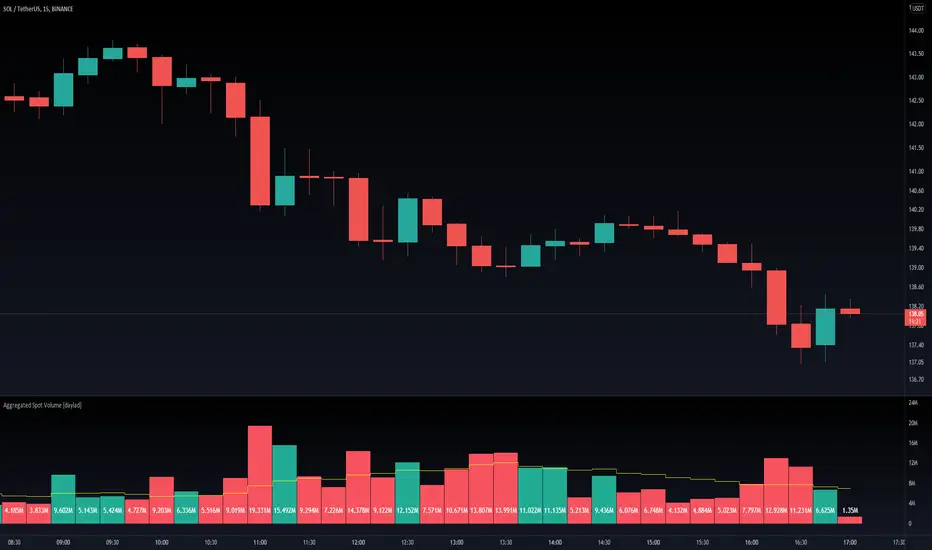
Aggregated Spot Volume [daylad]Works with any crypto chart! Automatically pulls and aggregates trading volume for the top stop pairs.
No need to manually update symbols, this indicator will detect if there is a matching symbol and add it.
Pulls data for the following pairs (when available):
COINBASE: + symbol + USD
COINBASE: + symbol + USDT
COINBASE: + symbol + EUR
BINANCE: + symbol + USDT
BINANCE: + symbol + BUSD
BINANCEUS: + symbol + USD
OKEX: + symbol + USDT
OKEX: + symbol + USDK
FTX: + symbol + USD
HUOBI: + symbol + USDT
BITFINEX: + symbol + USD
KRAKEN: + symbol + USD
KUCOIN: + symbol + USDT
CURRENCYCOM: + symbol + USD
POLONIEX: + symbol + USDT
UPBIT: + symbol + KRW
BITHUMB: + symbol + KRW
EXAMPLE -- If you are looking at the BINANCE:ADAUSDT chart, the indicator will automatically aggregate the volume from COINBASE:ADAUSD, COINBASE:ADAUSDT...etc... BINANCE:ADAUSDT...etc... BITHUMB:ADAKRW. If an exchange does not have a specific pair, then that pair returns 0 (does not add to the total).
If you have any questions feel free to ask. Happy trading!
Aggregated Volume Indicator - Across biggest exchangesThis indicator allows you to view the total volume across multiple exchanges at the same time.
Currently, the indicator is pulling volume from these exchanges
COINBASE
FTX
BINANCE
BITFINEX
KUCOIN
KRAKEN
The script will pull data from coins that are available on those exchanges and sum up the volume.
